London Challenge:
Survey of Pupils and Teachers 2006
Sarah Wilson, Tom Benton, Emma Scott
and Lesley Kendall
London Challenge:
Survey of Pupils and Teachers 2006
Sarah Wilson, Tom Benton, Emma Scott
and Lesley Kendall
National Foundation for Educational Research
The views expressed in this report are the authors’ and do not necessarily reflect those of the Department for Education and Skills.
Acknowledgements i
Executive summary iii
1. Introduction 1
1.1 Context 1
1.2 Aims of the research 1
1.3 Research methods 2
1.4 Survey analysis 5
1.5 Outline of report structure 5
2. Main findings from the pupil surveys 7
2.1 Happiness at school 8
2.2 School quality 9
2.3 Transition from primary to secondary school in London 11
2.4 Relationship with teachers 12
2.5 Views on teaching and learning 13
2.6 Out of lesson activities 16
2.7 School discipline 18
2.8 Pupil behaviour and attendance 19
2.9 Support and access to resources at home 22
2.10 Travelling to school 25
2.11 Future learning and careers 26
2.12 Telling other young people about the school 26
2.13 Further statistical analysis 29
3. Main findings from the teacher surveys 32
3.1 Teachers’ perceptions of their school 33
3.2 The importance of non-curricular support 40
3.3 Time and workforce remodelling 41
3.4 Pupil behaviour 42
3.5 Improving the transition process 44
3.6 Good classroom practice 46
3.7 Location 46
3.8 Recruitment and retention 47
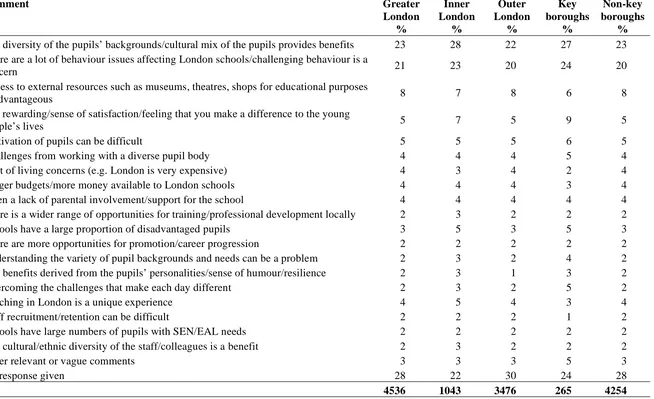
3.9 Open-ended responses – opinions about teaching 48
3.10 Further statistical analysis 54
4. Variation between schools 58
4.1 Pupil questionnaire 58
4.2 Teacher questionnaire 60
5. Changes over time 62
5.1 Changes between 2004, 2005 and 2006 62
6.1 Pupil surveys 73
6.2 Teacher surveys 75
Appendix A Sample representativeness 78
Appendix B Copies of the London questionnaires 81
Appendix C Copies of the metropolitan questionnaires 105
Appendix D Year 7 pupil data 113
Appendix E Year 10 pupil data 137
Appendix F Teacher data 161
Appendix G Factor analysis of teacher and pupil attitudes
The authors would like to thank the teachers and pupils who gave up their time to take part in the survey. We would also like to thank the following colleagues at NFER for their help and input:
Executive summary
Introduction
The London Challenge is a partnership between the Department for Education and Skills (DfES), schools and local authorities to raise educational standards in London’s schools. It aims to improve the educational opportunities for London’s young people and to create a world class education system in the capital.
In 2006, DfES commissioned the National Foundation for Educational Research (NFER) to carry out a survey of Year 7 pupils, Year 10 pupils and teachers from maintained schools in London.
The survey sought to gather information on pupils’ and teachers’ attitudes, expectations and perceptions of schooling in London. Additionally, schools from other metropolitan areas in England were also sent questionnaires on key questions, in order for the views of pupils and teachers in these areas to be compared with those from London. Findings from this year’s surveys were also compared to the findings of similar surveys conducted in 2004 and 2005.
Key findings
Pupil surveys
• On average, just over two-thirds of pupils in London and other
metropolitan areas (69%) considered their school to be a good school.
• In London, a substantial minority of pupils said that lessons were dull and
boring (29% of Year 7 pupils and 37% of pupils in Year 10). These views differed from the view held by the majority of teachers in London (74%) that most lessons were motivating and challenging.
• In London, 37% of Year 7 pupils and 28% of pupils in Year 10 felt that
bullying was a particular problem at their school.
• In 2006, pupils in London were more likely than in 2005 to identify
travelling by public transport as one of the means by which they travelled to school.
• In London, there was a significant increase in the proportion of pupils with
access to the internet at home (from 80% in 2005 to 85% in 2006).
• The majority of pupils received help and advice with their school work
Teacher surveys
• Teachers were generally positive about their current schools. 87% of
London teachers and 83% of teachers from metropolitan areas said that they enjoyed working in their current school and most would recommend the school to other teachers as a good place to work (77% of London teachers, 78% from metropolitan areas).
• Teachers in key boroughs, however, were slightly more likely to
recommend working in London than those working in non-key boroughs (75% compared to 67%).
• About 45% of teachers thought staff morale was high in their school, with
teachers in London responding slightly more positively than teachers in other metropolitan areas.
• The majority of London teachers felt that staff dealt effectively with
bullying among pupils (67%) and that in the school as a whole, control of pupils was good (61%).
• Just under half of teachers in London (46%) and a slightly smaller
proportion of teachers in other metropolitan areas (41%) felt that the overall quality of schooling in their school had improved over the last year. A fifth of teachers in London, and a quarter of teachers in metropolitan authorities, felt that the quality had worsened during this period.
Background
The London Challenge is a partnership between all those who seek more for
London’s young people. It aims to raise levels of attainment in London
schools and involves a range of work focused around three components:
• transforming key London boroughs – Islington, Hackney, Haringey,
Southwark and Lambeth;
• providing support for those schools on the frontline of breaking the link
between disadvantage and low attainment; and
• providing a better deal for London pupils, teachers, leaders and schools
(DfES, 2003).1
Aims
The main aim of the research was to gather information on pupils’ and teachers’ attitudes, expectations and perceptions of education in London. This data could then be compared to views reported in the 2004 and 2005 surveys
1
Department for Education and Skills (2003).The London Challenge: Transforming London Secondary Schools[online]. Available:
in order to assess delivery and monitor change. Additionally, schools from other metropolitan areas in England were also sent questionnaires on key questions, in order for the views of pupils and teachers in these areas to be compared with those from London.
As well as informing policy development, the research aimed to provide information to schools which could enable and support ongoing evaluation at a local level and be used as a management tool for school improvement.
Methodology
All maintained secondary schools in London and a matched sample of schools from other metropolitan areas in England were invited to take part in the survey during the summer term of 2006. The survey was completed by Year 7 pupils, Year 10 pupils and teachers. The pupil questionnaires were designed as a paper document to be administered in a classroom session, whilst teachers had the option of completing the survey via the internet or on paper.
A total of 4,536 teacher questionnaires and 47,727 pupil questionnaires were received from 200 schools in London. 2,505 completed teacher questionnaires and 13,238 pupil questionnaires were received from comparison schools in other metropolitan authorities in England.
Findings
Pupil survey
Did pupils think they attended a good school?
• Most pupils in London and other metropolitan areas (69%) considered
their school to be a good school. Pupils in key boroughs2 (particularly
Year 10 pupils) tended to be less positive: 55% of pupils in Year 10 agreed that their school was a good school compared to 67% of Year 10 pupils in non-key boroughs.
• Most pupils in London (81% of Year 7 pupils and 74% of pupils in Year
10) felt that their school was giving them a good education. However, the percentage of pupils in key boroughs who agreed that they were getting a good education was markedly lower (71% of Year 7 pupils, 68% of pupils in Year 10).
Pupils’ classroom experience
• 84% of pupils in London felt that it was important to be praised for good
work or behaviour, but only 40% of pupils in Year 7 and 27% of pupils in
2
Year 10 said that this ‘always’ or ‘often’ happened. In contrast, 93% of London teachers said that pupils were praised and encouraged in their work.
• Less than half the pupils in London agreed that teachers were good at
keeping control in the classroom (47% of pupils in Year 7 and 38% of pupils in Year 10).
• 29% of pupils in London reported that other pupils in their school tried to
disrupt lessons every day; 45% of pupils in London and 42% of pupils in other metropolitan areas reported that other pupils were ‘always’ or ‘often’ so noisy in class that they found it difficult to work. Overall, Year 7 pupils in London were the most likely to indicate that there was a high level of noise from other pupils in class.
Pupil behaviour
• Most pupils considered themselves to be well behaved at school. Overall,
pupils in London were more likely to admit being badly behaved than similar pupils in other metropolitan areas.
• A small minority of pupils in London and other metropolitan areas (4% or
less) admitted to often playing truant. Pupils in London schools were
more likely to admit to missing school without permission than similar pupils in other metropolitan areas.
Bullying
• 3% of pupils in London said that they were bullied every day and a further
3% every week.
• Most pupils in London had seen another pupil being bullied at school.
30% of pupils said that this happened ‘sometimes’; a further 17% said that they had witnessed other pupils being bullied on a daily or weekly basis.
• Less than 40% of pupils in London agreed that most teachers dealt
effectively with bullying or were good at dealing with poor pupil behaviour if and when it occurred.
Racism
• In London, 24% of Year 7 pupils and 19% of pupils in Year 10 said that
racism was a particular problem at their school.
• In 2006, the survey indicates that pupils in London were less likely than in
2004 to indicate that racism was not a particular issue at their school and more likely to respond that they were unsure.
Support and access to resources at home
• There was considerable variability in the extent to which pupils from
Travelling to school
• Just over half of pupils in London (53%) did not attend the school closest
to their home.
• On average it took pupils in London longer to get to school than pupils in
other metropolitan authorities.
• For the majority of pupils in London (70%) the journey to school took less
than half an hour; 13% of pupils reported that that it took them between 30 and 45 minutes; 6% said their journey took between 46 minutes and an hour. For a minority of London pupils (2%) the journey to school took more than an hour.
• Pupils (in London and in other metropolitan areas) with longer journey
times to school (particularly of 45 minutes or more) were less likely than otherwise similar pupils to say that they were happy at school and more likely to admit being badly behaved. They were also less likely to say that they received help with their school work at home.
• Year 7 pupils with long journeys to schools were less likely to say that
they found the work they did at school interesting.
• Year 10 pupils with long journey times to school (particularly over 45
minutes) were more likely than otherwise similar pupils to admit to missing school without permission.
Overall trends
• Overall, London pupils’ attitudes to school were broadly similar to the
attitudes held by pupils attending schools in other metropolitan areas.
• The main difference in attitudes was between pupils in Year 7 and pupils
in Year 10, with younger pupils tending to respond more positively than older pupils.
Teacher survey
Teachers’ views of their school
• Almost two-thirds of London teachers overall (65%), but less than half of
those in key boroughs (45%), said that they would advise friends to send their children to the school.
Teachers’ morale
• 31% of teachers in London and 36% of teachers in other metropolitan
areas did not think that staff morale was high in their schools. Within London, teachers in non-key boroughs were more likely than teachers in key boroughs to report high staff morale (48% compared to 39%).
Teachers’ views on the quality of schooling
• Compared to 2005, there was a decrease of six percentage points in the
41% in 2006). The percentage of teachers in London reporting improvements remained the same (46%).
• More senior teachers, and those in relatively high-attaining schools or in
schools in the lowest attainment band, were more likely to report that quality had improved than less senior colleagues, or those in schools with average levels of attainment.
Views on senior management
• 56% of teachers in London and 50% of teachers in other metropolitan
areas felt that the senior management at their school provided good leadership.
• Within London teachers in key boroughs were considerably less positive
about school leadership and management than teachers in non-key boroughs. Teachers in key boroughs were less likely than teachers in non-key boroughs to feel that senior management dealt effectively with unauthorised absence (34% compared to 50%) and to feel supported when they needed help with a difficult pupil (49% compared to 62%).
Pupil behaviour
• About 70% of teachers in London and other metropolitan areas felt that
pupils generally or always behaved well, although the proportion was markedly lower (about 54%) in the key boroughs. The higher the level of overall attainment of the school, the greater the proportion of teachers reporting that pupil behaviour was good. Pupil behaviour was also seen as good in smaller schools.
• Overall, bullying was not seen as a major problem. However, schools in
key boroughs seemed to face greater challenges in relation to bullying, with over a quarter of teachers from these areas reporting that bullying was a problem, compared with less than a fifth in non-key boroughs.
Teacher recruitment and retention in London
• The majority of teachers in London felt that access to high quality
professional development from subject specialists (90%), support with the cost of housing, for example through the Key Worker initiative (88%), up-to-date ICT resources (87%), good school buildings (75%), and recognition through achieving Chartered London Teacher (57%) could all help to improve recruitment and retention.
Overall trends
• Patterns in teachers’ responses were not always consistent; however,
1.
Introduction
1.1
Context
The London Challenge is a partnership between those who seek more for London’s young people. It aims to raise levels of attainment in London schools and involves a range of work focused around three components:
• transforming key London boroughs – Islington, Hackney, Haringey,
Southwark and Lambeth
• providing support for those schools on the frontline of breaking the link
between disadvantage and low attainment; and
• providing a better deal for London pupils, teachers, leaders and schools
(DfES, 2003).3
Approximately one sixth of England’s secondary school pupils are educated in London schools. London is a unique context: it has a large number of small local authorities (LAs), high levels of deprivation, a highly diverse and mobile population, and high costs of living which affect recruitment and retention of teachers. These are not seen in such sharp relief anywhere else in the country.
In 2004 and 2005, Year 7 pupils, Year 10 pupils and teachers from maintained secondary schools in London were surveyed to gather information on their perceptions of maintained school provision and the quality of schooling. In 2006, the Department for Education and Skills (DfES) commissioned NFER to conduct a third survey of pupils and teachers.
1.2
Aims of the research
The main aim of the research was to collect data on pupils’ and teachers’ attitudes, expectations and perceptions of schooling in London. This data was then compared to views reported in the 2004 and 2005 surveys, in order to monitor change.
Additionally, schools from other metropolitan areas in England were also sent questionnaires on certain key questions, in order for the views of pupils and teachers in these areas to be compared with those from London.
3
Department for Education and Skills (2003).The London Challenge: Transforming London Secondary Schools[online]. Available:
As well as informing policy development, the study aimed to provide information to schools, through the production of feedback reports that could enable and support ongoing evaluation at a more local level and be used as a management tool for school improvement.
The questions in the 2006 survey were largely based on questions used in the 2004 and 2005 surveys. The research gathered information relating to pupils’ and teachers’ perceptions of schools, including:
• perceptions of the quality of schooling (including ethos, facilities and
resources, the school workforce, attainment, attendance and behaviour);
• experiences and perceptions of London secondary schools locally, across
London, and nationally;
• views on behaviour, discipline and teaching and learning;
• perceptions of change and views on the factors inhibiting change;
• the changes teachers and pupils would like to see; and
• the extent to which attitudes and experiences vary in relation to the social
characteristics and circumstances of respondents.
There were some key questions that appeared in both the London questionnaires and the shortened versions of the questionnaires that were sent to metropolitan schools. These questions were selected because it was felt they provided particularly valuable data and were applicable to pupils and teachers in all areas. Copies of the questionnaires for London respondents and respondents in metropolitan authorities can be found in Appendices B and C.
1.3
Research methods
1.3.1 Survey administration
In May 2006, all maintained secondary schools in London (411 schools) and a matched sample of 411 secondary schools from other metropolitan areas were invited to take part in the 2006 London Challenge Surveys of Pupils and Teachers.
All schools were asked to return a reply form indicating whether or not they wished to participate in the surveys by mid-June. On the reply form, schools were asked to name a contact person for the survey and to detail the number of questionnaires they required for their Year 7 pupils, Year 10 pupils and teachers.
Questionnaires were dispatched to 336 schools (222 schools in London; 114 schools in other metropolitan authorities) in mid-June for completion and
return by the end of July 2006.4 All teachers were also given the opportunity
to complete the survey online.
Consent was sought from all participating London schools, excluding academies and City Technology Colleges (CTCs), to share their findings with their Local Authority (LA).
1.3.2 Sample details
The number of London schools returning completed questionnaires has increased each year since the survey began (see Table 1).
Table 1. Number of London schools participating in the survey
Year Number of London schools returning completed questionnaires
2004 114
2005 187
2006 200
In 2006, completed questionnaires were received from 200 schools in London and 92 schools in other metropolitan authorities.
A total of 4536 completed teacher questionnaires were received from schools in London and 47,727 pupil questionnaires.
2505 teacher questionnaires and 13,238 pupil questionnaires were received from schools in other metropolitan authorities.
The following tables provide a breakdown of the number of schools agreeing to participate in the surveys; the numbers of schools returning questionnaires, and the total number of completed questionnaires returned.
4
Table 2. Response rate – invitation to participate
Schools in London authorities
Schools in metropolitan authorities Number % Number % Invited to participate 411 100 411 100
Sent reminder letter 318 77 311 77
Telephoned for participation 235 57 224 55
Declining involvement 67 16 104 25
Agreeing to participate 222 54 114 28
Table 3. Response rate – participating schools
Schools in London authorities
Schools in metropolitan authorities Number % Number % Sent questionnaires 222 100 114 100
Sent reminder letter for return
of materials 130 59 49 43
Telephoned for return of
materials 109 49 45 39
Not returning questionnaires 22 10 22 19
Returning questionnaires
(either pupil questionnaires, or teacher questionnaires or both)
200 90 92 81
Table 4. Questionnaire returns
London
Number of completed questionnaires
Metropolitan Number of completed
questionnaires
Year 7 questionnaires 25,276 6784
Year 10 questionnaires 22,451 6454
Teacher questionnaires 4536 2505
1.4
Survey analysis
Once questionnaires were received, responses to the open-ended questions were coded and all data was keyed and then analysed. The pupil background data (name and date of birth) was matched to information from the National Pupil Database (NPD). This provided background characteristic information such as eligibility for Free School Meals (FSM), Special Educational Needs (SEN), and ethnicity. Data from the 2001 census was also included in the
analysis.5
Initial descriptive statistics based on pupils’ and teachers’ responses to the survey were produced. Significance testing was not carried out on the
descriptive analyses due to the large sample sizes involved.6
Further analysis using multilevel modelling was undertaken on the key questions (questions which appeared in both the London and the metropolitan surveys) in order to explore the relationships and associations between teachers’ or pupils’ background characteristics and their attitudes towards school.
In addition to this, factor analysis was used to develop quantitative measures of the attitudes and experiences of pupils and teachers in London. Multilevel modelling was then used to explore the relationships between factor scores and various pupil, teacher and school characteristics. Further details about the factor analysis can be found in Appendix G.
Significance testing was carried out as part of the further analysis.
1.5
Outline of report structure
The analysis of findings from the survey is provided in the following chapters.
Chapter 2 presents the main findings from the pupil survey. The main
findings from the teacher survey are provided inChapter 3.
These chapters contain descriptive statistics based on pupils’ and teachers’ responses to the survey. When describing differences in the descriptive analyses, differences of five percentage points or greater are focused on.
5
Factor analysis was then used to create four categories of deprivation from the census variables. 6 One of the disadvantages of the chi-squared test is that it is sensitive to large numbers and can give
These chapters also include findings from the multilevel modelling undertaken on the key questions (questions which appeared in both the London and the metropolitan pupil surveys). Multilevel modelling enables comparisons to be made on a like with like basis. For example, when comparing male and female pupils there are many differences in their background characteristics but in order to make comparisons that take account of these other differences and make statements that are purely related to gender, modelling is used to estimate what the differences between groups would be if all other background characteristics were the same. This will be written as (for example) ‘female pupils were more likely to say that they were usually happy at school
compared to otherwisesimilarboys’.
Where findings from the multilevel modelling are discussed these are statistically significant. Findings from this further analysis are presented in text boxes to distinguish them from the descriptive statistics.
Findings from the multilevel modelling using factor scores are provided at the end of Chapters 2 and 3.
Chapter 4 discusses the extent to which responses to questions vary between London schools.
Changes in teachers’ and pupils’ attitudes over time are explored in Chapter
5.
Finally, Chapter 6 draws together the overall findings from the teacher and
2.
Main findings from the pupil surveys
This chapter presents the main findings from the surveys of Year 7 and Year 10 pupils in London boroughs and other metropolitan authorities. A breakdown of responses to each closed question on the Year 7 survey can be found in Appendix D. Appendix E contains a breakdown of the data for all closed questions on the Year 10 survey.
Further analysis was carried out on the questions which appeared in both the London and the metropolitan survey of pupils. Findings from this further analysis are presented in text boxes.
Summary of findings from the pupil surveys
Most pupils in London and other metropolitan authorities responded positively to questions about their school. Approximately two-thirds of pupils in London and other metropolitan areas thought their school was a good school (69%). Most pupils in London (81% of pupils in Year 7 and 74% of pupils in Year 10) felt that they were getting a good education.
The majority of pupils in London (84%) and other metropolitan authorities (85%) were happy at school. When asked what they would say to someone considering coming to their school, most pupils in London and other metropolitan authorities said that they would recommend it. Further analysis revealed that in 2006, pupils (in London and metropolitan authorities) were slightly more likely to say that they were happy at school than similar pupils in 2005.
Overall, the main difference in attitudes was between pupils in Year 7 and pupils in Year 10, with younger pupils tending to hold more positive attitudes than older ones. Pupils’ responses also varied for some questions according to their gender, ethnic background and the length of time it took them to get to school.
Overall findings suggest that a relatively high proportion of pupils in London and other metropolitan areas do not find their classroom experiences particularly stimulating. Less than half of pupils in London and other metropolitan areas (45%) said that school work was interesting. However, this year there was a very small but statistically significant increase in the proportion of London pupils reporting that they found most of the work they did at school interesting (from 44% in 2005 to 45% in 2006).
37% of Year 7 pupils and 28% of Year 10 pupils in London felt that bullying was a particular problem at their school. Approximately a fifth of pupils in London (24% of Year 7 pupils and 19% of pupils in Year 10) said that racism was an issue for their school.
In London, there was a significant increase in the proportion of pupils with access to the internet at home (from 80% in 2005 to 85% in 2006).
Over half of pupils in London (53%) did not go to the school closest to where they lived. However, most pupils in London and other metropolitan areas reported that it took them less than half an hour to get to school, and for approximately two-fifths of pupils the journey to school took less than 15 minutes. On average it took pupils in London longer to get to school than pupils in other metropolitan authorities.
2.1
Happiness at school
Pupils in London and metropolitan authorities were asked if they were usually happy at school. Over 80% of pupils in London, and a similar percentage of pupils from metropolitan schools, said that they were. Overall, pupils in Year 7 tended to respond more positively to this question than pupils in Year 10 (see Table 5 below). Within London, the level of positive response to this question was higher amongst pupils in non-key boroughs than in key
boroughs.7
Table 5. I am usually happy at school Metropolitan
%
Greater London
%
Inner London
%
Outer London
%
Key Boroughs
%
Non-key Boroughs
%
Year 7 pupils 87 87 85 87 83 87
Year 10 pupils 82 81 78 82 77 81
Percentage of pupils responding ‘true’
I am usually happy at school
Pupils in 2006 in all areas were slightly but significantly more likely to say that they were happy at school than similar pupils in 2005. In particular, girls were more likely than boys to say they were usually happy at school.
Within London, however, Year 10 pupils attending schools in Inner London were less likely to say they were usually happy at school than similar pupils attending schools in outer London or other metropolitan areas.
7
The longer it took pupils to get to school (particularly if the journey took 45 minutes or more) the less likely they were than other similar pupils to say that they were happy at school.
Pupils with high levels of prior attainment (at either Key Stage 2 or Key Stage 3) were more likely than other similar pupils to report being happy at school. Pupils with special educational needs (particularly those on school action or school action plus) were less likely to say they were usually happy at school.
The London survey also asked pupils if they would prefer to go to a different school. As can be seen in Table 6, around a quarter of Year 7 pupils and a slightly higher proportion of pupils in Year 10 said that they would. The proportion of pupils indicating that they would like to go to a different school was highest amongst pupils in key boroughs. Differences were also noted between pupils in Inner and Outer London, with a higher proportion of pupils in Inner London stating that they would prefer to go to a different school (see Table 6 below).
Table 6. Would you prefer to have gone to a different school? Greater
London %
Inner London
%
Outer London
%
Key Boroughs
%
Non-key Boroughs
%
Year 7 pupils 24 29 22 36 23
Year 10 pupils 28 33 27 36 28
Percentage of pupils responding ‘yes’
Pupils in London were also asked to what extent they agreed with the statement ‘most of the time I do not want to go to school’. Overall, 33% of pupils said they agreed with this statement.
2.2
School quality
Pupils in London and other metropolitan authorities were asked to what extent they agreed that the school they attended was a good school.
Table 7. Year 7 pupils – This school is a good school Metropolitan
%
Greater London
%
Inner London
%
Outer London
%
Key Boroughs
%
Non-key Boroughs
%
Strongly agree 20 25 20 26 14 26
Agree 53 48 46 48 46 48
Not sure 20 19 23 18 26 19
Disagree 4 4 5 4 7 4
Totally disagree 3 3 3 3 4 3
No response 0 1 2 1 2 1
N 6784 25,276 5845 19,431 1412 23,864
A single response item
Due to percentages being rounded to the nearest integer, they may not sum to 100
Table 8. Year 10 pupils – This school is a good school Metropolitan
%
Greater London
%
Inner London
%
Outer London
%
Key Boroughs
%
Non-key Boroughs
%
Strongly agree 11 13 12 13 6 14
Agree 53 53 50 54 49 53
Not sure 23 20 23 20 26 20
Disagree 9 8 9 8 10 8
Totally disagree 4 4 4 4 4 4
No response 0 2 3 1 4 1
N 6454 22,451 5048 17,394 1428 21,014
A single response item
Due to percentages being rounded to the nearest integer, they may not sum to 100
Differences can also be seen between pupils’ responses in Inner and Outer London, and in key and non-key boroughs (see Tables 7 and 8). However, further analysis of this key question found that once the background characteristics of pupils were taken into account, these differences were not statistically significant.
This school is a good school
Pupils in schools with a high proportion of pupils eligible for free school meals were less likely to agree that their school was a good school than similar pupils in other schools. On the other hand, further analysis found that pupils attending specialist schools were more likely than other similar pupils to report that their school was a good school.
Pupils in London were also asked some further questions about the quality of their school. Questions focused on the extent to which they agreed that the school they attended was better than other schools, and was providing them with a good education. Overall, most pupils responded positively to these questions.
Most pupils in London felt that their school was giving them a good education. As with previous questions, pupils in Year 7 tended to respond more positively than pupils in Year 10: overall, 81% of pupils in Year 7 agreed with this statement compared to 74% of pupils in Year 10. There was little difference between the views of pupils in Inner London and Outer London. However, the percentage of Year 7 pupils in key boroughs who felt they were receiving a good education was lower than for those in non-key boroughs: just 71% of Year 7 pupils in key boroughs agreed that they were getting a good education compared to 81% of the same age pupils in non-key boroughs.
When asked whether their school was better or worse than most schools, overall 61% of London pupils in Year 7 and 54% of London pupils in Year 10 said that their school was ‘much better’ or ‘better’ than other schools.
The percentage of Year 7 pupils describing their school as better than most schools was lower in key boroughs than in non-key boroughs: 46% in key boroughs thought that their school was better than other schools compared to 62% in non-key boroughs.
2.3
Transition from primary to secondary school in London
Year 7 pupils in London were asked a number of questions about their experiences of moving from primary to secondary school.
Most pupils (83%) had been on an organised visit to their secondary school before starting Year 7. Pupils in non-key boroughs were slightly more likely than pupils in key boroughs to have visited their school before joining (84% compared to 78%).
Since starting secondary school, almost all pupils had found it easy to make new friends (89%) and just under 80% of pupils felt that they were getting on well at their new school.
Just over three-quarters of pupils (76%) liked having different teachers for different lessons; less than a third (32%) would have preferred to stay in the same room for most of their lessons.
this view was higher in schools in Outer London than in Inner London (76% compared to 69%); and in schools in non-key boroughs than in key boroughs (74% compared to 65%).
When asked if they were happier in their current school than at primary school, overall responses were mixed. Just over a third of pupils said that they were; a similar proportion said that they were not. Approximately a quarter of pupils were unsure.
Pupils in non-key boroughs were more likely to report that they were happier in their current school than pupils in key boroughs (37% compared to 28%). 26% of pupils in key boroughs indicated that they ‘totally disagreed’ with this statement, compared to 18% of pupils in non-key boroughs.
Differences were also noted between pupils in Inner and Outer London, with pupils in Outer London more likely to report that they were happier at secondary school than pupils in Inner London (38% compared to 32%).
Comments from Year 7 pupils in London included:
‘It may seem a shock at first but you can easily make friends and find your way around quickly’.
‘It’s a good school. At first you will find it big and you might get lost but when you get used to it you should enjoy it a lot’.
‘Don’t come here if you don’t want to be worked hard!’
‘Don’t worry. This school is very welcoming and there are very nice teachers and pupils to help you settle in’.
2.4
Relationship with teachers
Year 7 and Year 10 pupils in London were asked a number of questions about the relationship between pupils and teachers at their school. Responses to these questions were more mixed than in relation to earlier questions.
Year 7 pupils were more than twice as likely as pupils in Year 10 to strongly agree that most of their teachers were respected by pupils (11% compared to 5%). A further 31% of pupils in Year 7 and 30% of pupils in Year 10 agreed with this statement. Overall, responses to this question were more positive amongst Year 7 pupils in non-key boroughs than in key boroughs: 43% of Year 7 pupils in non-key boroughs felt that most of the teachers at their school were respected by pupils compared to 36% of the same age pupils in key boroughs.
Overall, Year 7 pupils were also more likely than pupils in Year 10 to agree that teachers treated pupils with respect (60% compared to 50%). Amongst Year 7 pupils, responses were more positive in non-key boroughs than in key boroughs (62% compared to 52%).
2.5
Views on teaching and learning
All pupils were asked their views on the quality of teaching at their school. Just under half described ‘all’ or ‘most’ of their teachers as good teachers. A slightly higher proportion of pupils from London boroughs than from metropolitan authorities said that this was the case (50% compared to 47%).
Overall responses about the quality of teachers tended to be more positive in Year 7 than in Year 10. For example in London, 55% of pupils in Year 7 felt that most of their teachers were good teachers compared to 46% of pupils in Year 10. A similar difference was noted between responses from Year 7 and Year 10 pupils in metropolitan authorities.
How many of your teachers are good teachers?
Further analysis showed that pupils in London were significantly more likely to report that all or most of their teachers were good teachers than similar pupils in other metropolitan areas.
As well as the location of the school, the type of school pupils attended was also found to be significant.
Pupils from a Black Caribbean background were less likely than white pupils to agree that all or most of their teachers were good teachers. Year 7 pupils who were from a Black African background were also less likely than similar pupils from other ethnic backgrounds to report all or most of their teachers were good teachers. Year 10 pupils with English as an additional language were more likely than other similar pupils to think that most of their teachers were good teachers.
twice as likely as pupils in Year 10 to report that this happened in every lesson (23% compared to 12%).
Just over 60% of pupils in London said that teachers took time to discuss their progress with them and to advise them on how they could improve their work.
The majority of pupils in London (84%) felt that it was important to be rewarded for good work or behaviour. Just under half of these pupils described it as ‘very important’. Pupils in key boroughs (in particular Year 10 pupils) were less likely to respond to this question than pupils in non-key boroughs (7% of Year 10 pupils in key boroughs did not respond to this question compared to 2% of Year 10 pupils in non-key boroughs).
Around a third of pupils in London said that teachers ‘always’ or ‘often’ praised them when they worked hard. Pupils in Year 7 were more likely than pupils in Year 10 to report that this was the case (40% compared to 27%). Again, pupils attending schools in key boroughs (in particular Year 10 pupils) were less likely to respond to this question than pupils in non-key boroughs (8% of Year 10 pupils in key boroughs did not respond to this question compared to 2% of Year 10 pupils in non-key boroughs).
The majority of pupils in London said that most of their teachers set homework regularly (each week). A higher proportion of pupils in Year 7 than in Year 10 reported that this was the case (86% compared to 79%).
The lowest proportions of Year 10 pupils reporting that teachers set homework on a regular basis were in key boroughs: 69% of Year 10 pupils in key boroughs said that they were set homework regularly compared to 79% of Year 10 pupils in non-key boroughs.
Differences were also noted between pupils in Outer and Inner London, with pupils in Outer London more likely than those in Inner London to report that teachers set homework regularly (80% compared to 73% of pupils in Year 10; 87% compared to 80% of pupils in Year 7).
Around a quarter of pupils in London said that they were ‘often’ taught by a supply teacher.
Overall, nearly a fifth of London pupils said that there was ‘often’ a teaching assistant helping in class. Year 7 pupils were considerably more likely than pupils in Year 10 to report that this was the case (24% compared to 10%).
Classroom experience
Findings suggest that a relatively high proportion of pupils in and outside of London did not find their classroom experiences particularly stimulating. Overall, just under half of pupils in Year 7, and approximately 60% of pupils in Year 10 indicated that most of the work they did at school was not interesting.
When pupils in London were asked to what extent they agreed that school work was dull and boring, responses were fairly evenly divided between those who agreed it was, those who disagreed, and those who were unsure. Overall, pupils in Year 10 were more likely than pupils in Year 7 to agree with the statement (37% compared to 29%).
Most of the things I work on at school are interesting
Further analysis revealed that there had been a significant increase in the tendency for London pupils to find the things they worked on at school interesting.
Amongst Year 7 pupils, significant differences were also identified in relation to gender and the length of time it took to get to school. Female pupils were more likely to report that school work was interesting than similar male pupils. Year 7 pupils with long journeys to school (particularly taking 45 minutes or more) were less likely to say they found most things at school interesting. Pupils who spoke English as an additional language were more likely than pupils who spoke English as their first language to say they found most things at school interesting.
Just under 30% of pupils in London said that other pupils tried to disrupt lessons every day. Around two-fifths of pupils (43%) from schools in London felt that most teachers were good at keeping control in the classroom. Pupils in Year 7 tended to respond more positively to this question than pupils in Year 10 (47% compared to 38%).
‘Be careful about talking and disrupting lessons here, you will nearly always be caught doing so’(Year 7 pupil, London)
‘Only come to [name of school] if you don’t mind not learning in certain subjects as some teachers can’t control the class’. (Year 7 pupil, London)
How often are other pupils noisy in class?
Year 7 pupils in London were more likely to complain about the level of pupil noise in class than similar pupils elsewhere.
Pupils attending schools with a high percentage of pupils eligible for free school meals were more likely than similar pupils from other schools to report other pupils were often or always noisy. Likewise, pupils in schools with larger class sizes8 were more likely than similar pupils elsewhere to report that pupils in their school were often or always noisy in class.
Resources to support teaching and learning
Pupils in London were asked how often they had books and other resources to take home. Overall, less than half the sample indicated that this happened regularly (9% ‘every’ lesson and 37% ‘most’ lessons) while 34% said it happened ‘sometimes’. 16% of pupils said it happened ‘hardly ever’ or ‘never’. Year 7 pupils in non-key boroughs were more likely to report that they had books and other resources to take home after ‘every’ or ‘most’ lessons than Year 7 pupils in key boroughs (47% compared to 39%).
Almost two-thirds of pupils in London agreed that they learnt more easily when they used a computer in class, and just under 60% of pupils said that they found it easier to learn when their teachers used an interactive whiteboard. Pupils in Year 7 were more likely to strongly agree with each of these statements than pupils in Year 10.
Pupils in London were also asked how often they used a computer as part of a lesson. Just over half said that they ‘sometimes’ used a computer; around a quarter responded ‘hardly ever’ or ‘never’. Only a minority of pupils (14%) said that they used a computer in ‘every’ or ‘most’ of their lessons. Year 10 pupils in key boroughs were slightly more likely to report using computers in either ‘every’ or ‘most’ of their lessons than pupils in non-key boroughs (23% compared to 17%).
2.6
Out of lesson activities
Opportunities for extra study
Most schools provided opportunities for pupils to do extra learning activities or study outside of lesson time. On average 80% of pupils attending schools in metropolitan authorities said that they had opportunities to do extra learning activities, compared with 71% of pupils in London. Further analysis found that this difference was statistically significant.
Overall, Year 10 pupils were slightly more likely to report that they had opportunities to do extra study than pupils in Year 7. A higher proportion of pupils in Outer London than Inner London (particularly amongst Year 7 pupils) and in non-key boroughs than in key boroughs said that they had opportunities for extra study (see Tables 9 and 10).
Table 9. We have opportunities outside of lesson time to do extra learning activities or extra study (Year 7 pupils)
Metropolitan
%
Greater London
%
Inner London
%
Outer London
%
Key Boroughs
%
Non-key Boroughs
%
True 77 68 63 70 60 69
False 21 30 34 28 37 29
No response 1 2 3 2 4 2
N 6784 25,276 5845 19,431 1412 23,864
A single response item
Due to percentages being rounded to the nearest integer, they may not sum to 100
Table 10. We have opportunities outside of lesson time to do extra learning activities or extra study (Year 10 pupils)
Metropolitan
%
Greater London
%
Inner London
%
Outer London
%
Key Boroughs
%
Non-key Boroughs
%
True 82 74 72 74 67 74
False 16 24 25 24 27 24
No response 1 2 3 2 6 2
N 6454 22,451 5048 17,394 1428 21,014
A single response item
Due to percentages being rounded to the nearest integer, they may not sum to 100
Opportunities for extra study
Further analysis showed that London pupils were less likely than similar pupils in other areas to report that they had opportunities for extra study. However, the gap between Year 7 pupils in London and in other metropolitan areas had narrowed since 2005. This was due to a reduction in the percentage of pupils in metropolitan areas reporting that they have opportunities for extra study which was not seen in London.
Pupils in schools with a high percentage of pupils eligible for free school meals were less likely to say they had opportunities for extra study compared to similar pupils from other schools, as were Year 7 pupils in schools with larger class sizes.
Year 7 female pupils were more likely to report having opportunities for extra study than other similar pupils.
Pupils in London and other metropolitan areas with English as an additional language were less likely than otherwise similar pupils to say they had opportunities for doing extra work.
Opportunities to attend other after-school clubs
Around two-fifths of pupils in London thought that after-school clubs were either very important (13%) or quite important (29%). Overall, pupils in Year 7 tended to place greater importance on after-school clubs than pupils in Year 10 (47% of pupils in Year 7 described after-school clubs as either ‘very’ or ‘quite’ important compared to 36% of pupils in Year 10).
The majority of pupils in London (75%) agreed that there were lots of activities (e.g. sport and drama) to take part in at lunchtime or after school:
‘This school has a wide variety of clubs and activities to offer. Make the most of them and enjoy yourself!’(Year 7 pupil, London)
As would perhaps be expected given the greater importance they placed on after-school activities, pupils in Year 7 were also more likely than pupils in Year 10 to say that they regularly took part in activities at lunchtime or after school (50% compared to 33%).
Year 7 pupils in Inner London were less likely to take part in after-school clubs than pupils in Outer London (44% compared to 52%), and Year 7 pupils in key boroughs were less likely to participate than pupils in non-key boroughs (42% compared to 51%). One possible explanation could be pupils’ travel arrangements: 40% of Year 7 pupils in key boroughs indicated that their travel arrangements did not allow them to take part in after-school activities, compared to 30% of pupils in non-key boroughs. A higher proportion of Year 7 pupils in Inner London than in Outer London also said that travel arrangements prevented them from participating in activities after school (35% compared to 30%).
2.7
School discipline
The majority of pupils in London (61%) thought that the level of discipline at their school was ‘about right’. However, responses were less positive in relation to teachers’ abilities to deal with poor pupil behaviour or to tackle issues of bullying.
‘There are a few good teachers but not many can deal well with bullying. Try to avoid bullies but if they physically hurt you, you’re best bet is to take lessons in self-defence’. (Year 7 pupil, London)
‘This is a good school but it can get very noisy and messy especially at lunchtimes’. (Year 7 pupil, London)
Overall, 39% of pupils agreed that most teachers dealt effectively with bullying; 38% agreed that teachers were good at dealing with poor behaviour. However, as with previous questions, Year 7 pupils responded more positively than pupils in Year 10.
• 47% of pupils in Year 7 agreed that most teachers dealt effectively with
bullying compared to 30% of pupils in Year 10.
• 45% of Year 7 pupils agreed that most teachers were good at dealing with
poor pupil behaviour compared to 31% of pupils in Year 10.
Pupils in London were asked to what extent they agreed with the statement ‘most teachers are very strict about pupils missing school’. Just over 60% of pupils either strongly agreed or agreed with the statement. Pupils in Year 7 were more likely to strongly agree than pupils in Year 10 (34% compared to 22%).
2.8
Pupil behaviour and attendance
Most pupils in London and in other metropolitan authorities considered themselves to be well behaved at school and reported that they never missed school without their school’s permission. When asked how often they behaved badly at school the majority of pupils in both areas responded ‘rarely’ or ‘never’ (60% of pupils in London and 62% of pupils in other metropolitan areas).
How often do you behave badly at school?
Pupils in London were more likely to admit being badly behaved than similar pupils elsewhere. Overall, female pupils were less likely than male pupils to admit to being badly behaved.
Journey time to school was also found to be significant with pupils with the longest journey times to school (particularly 45 minutes or longer) being more likely to admit to being badly behaved at school.
A relatively small percentage of pupils (4% or less) admitted to often playing truant. As can be seen in Tables 11 and 12, pupils in metropolitan authorities were slightly more likely to report that they never missed school without permission than pupils in London authorities. Further analysis revealed that this difference was significant.
Differences can also be seen between pupils in London. Pupils in Outer London or in non-key boroughs were more likely than pupils in other areas to report that they never missed school without the school’s permission. Pupils in Inner London or in key boroughs were more likely not to respond to this question than pupils in other areas. However, further analysis of this key question found that once the background characteristics of pupils were taken into account, these differences were not statistically significant.
Table 11. Year 7 – This term, how often have you missed school without permission from school?
Metropolitan
%
Greater London
%
Inner London
%
Outer London
%
Key Boroughs
%
Non-key Boroughs
%
Often 2 3 3 2 4 3
Sometimes 8 10 12 10 11 10
Rarely 21 21 22 21 24 21
Never 68 62 57 64 55 63
No response 1 4 6 3 7 3
N 6784 25,276 5845 19,431 1412 23,864
A single response item
Due to percentages being rounded to the nearest integer, they may not sum to 100
Table 12. Year 10 – This term, how often have you missed school without permission from school?
Metropolitan
%
Greater London
%
Inner London
%
Outer London
%
Key Boroughs
%
Non-key Boroughs
%
Often 3 4 4 4 4 4
Sometimes 11 13 14 13 14 13
Rarely 26 24 25 23 26 24
Never 59 56 50 57 46 56
No response 1 4 6 3 9 3
N 6454 22,451 5048 17,394 1428 21,014
A single response item
How often do you miss school without permission from school?
Pupils in London schools were more likely to admit missing school without permission than similar pupils in other metropolitan areas.
Year 7 pupils in schools with a high percentage of pupils eligible for free school meals were also more likely than similar pupils to admit to missing school.
Year 10 pupils who had longer journeys to school, specifically over 45 minutes, were more likely to admit to missing school without permission compared to otherwise similar pupils with shorter journeys to school.
Pupils with higher prior attainment levels were less likely to admit to missing school without permission. Likewise pupils from Black African or Black Caribbean backgrounds were less likely than similar pupils from other ethnic backgrounds to admit to missing school without permission.
Pupils in London were also asked if they sometimes deliberately missed lessons even when they were at school. Overall, the majority of pupils (89%) said that they did not. However, the proportion of pupils reporting that they did not miss lessons was slightly higher in Year 7 (91%) than in Year 10 (86%).
Bullying behaviour
In London, just under 40% of pupils said that pupils were ‘always’ or ‘often’ made fun of if they worked hard. This kind of behaviour was more commonly reported by pupils in:
• Year 7 than in Year 10 (42% compared to 33%);
• non-key boroughs than in key boroughs (42% compared to 29% of pupils
in Year 7; 34% compared to 24% of pupils in Year 10); and
• Outer London than in Inner London (43% compared to 34% of pupils in
Year 7; 34% compared to 28% of pupils in Year 10).
Pupils in London were asked if they thought that bullying was a particular problem at their school. Overall, a third of pupils thought that it was, with pupils in Year 7 more likely to report this than pupils in Year 10 (37% compared to 28%). Although most pupils said that they had never been bullied, overall 3% of pupils in London said that they were bullied every day and a further 3% every week. Just under half of pupils in London said that they ‘hardly ever’ or ‘never’ saw other pupils being bullied; 30% said that they ‘sometimes’ did; and a further 17% said that they had witnessed other pupils being bullied on a daily or weekly basis.
school (19% compared to 14%). Male pupils in both years were also more likely to report that they were bullied at school. Of those pupils who said that they were bullied every day, in Year 7 55% were male and 42% were female,
in Year 10 55% were male and 35% were female.9
Further analysis also found that there was a positive relationship between how often pupils reported that they were bullied at school and how often they missed school without permission. Of the Year 10 pupils in London who said that they were bullied every day, 22% indicated that they often missed school without permission, 42% said that they never missed school. Of those who said that they were never bullied 3% said that they often missed school, 60% reported that they never missed school without permission. A similar pattern of responses was also found amongst pupils in Year 7.
Racism
The London survey asked pupils to what extent they agreed that racism was a particular problem at their school. Just under half of pupils (46%) disagreed with the statement, 29% said that they were not sure. Around a fifth of pupils in London (21%) felt that racism was a particular problem at their school.
2.9
Support and access to resources at home
Support from parents or carers
The majority of pupils in London and other metropolitan authorities received help and advice with their school work from parents or carers. Year 7 pupils were more likely to report that they received help with their school work. (Approximately 90% of Year 7 pupils in London and other metropolitan authorities reported that they received help and advice from parents or carers compared with around 80% of pupils in Year 10.)
My parents or carers help and advise me with my school work
Year 7 pupils attending specialist schools, in particular science schools, were more likely to say they received help compared to pupils from similar pupils from other schools.
Year 10 pupils in schools with high proportions of pupils eligible for free school meals were less likely than similar pupils from other schools to say they received help with their school work.
Of pupils in Year 10, those with high levels of attainment levels at Key Stage 3 were less likely to say they got help with their school work.
Pupils with longer journeys to school (in particular more than 45 minutes for Year 7 pupils and more than 30 minutes for pupils in Year 10) were less likely to say they received help with their school work compared to similar pupils with shorter journeys to school.
Among London pupils, nearly half of those in Year 7 and around a third of those in Year 10 said that their parents or carers ‘often’ asked them about school.
Almost 90% of pupils in London said that their parents or carers came to parents’ evenings. 27% of pupils in Year 7 and 14% of pupils in Year 10 said that their parents or carers came to school for social events.
Overall, a quarter of pupils in London reported that their parents or carers came to school because they were having problems (28% of pupils in Year 7, 22% of pupils in Year 10); and around a fifth (21% of Year 7 pupils, 22% of Year 10 pupils) because they were in trouble at school.
Places to work and resources to help with school work
Just over 80% of pupils in London said that they had somewhere quiet at home to do their homework. Almost 90% of pupils said that there were books at home (e.g. dictionaries, reference books) for them to use and look things up in.
Overall, around 90% of pupils in London had access to a computer outside of school. A higher proportion of pupils in non-key boroughs than in key boroughs, and in Outer London than in Inner London, reported that they has access to a computer to help them with homework (see Tables 13 and 14).
Table 13. Year 7 – At home I have access to a computer to help me with my homework
Greater London
%
Inner London
%
Outer London
%
Key Boroughs
%
Non-key Boroughs
%
True 87 81 89 78 87
False 12 17 10 19 12
No response 1 2 1 3 1
N 25,276 5845 19,431 1412 23,864
A single response item
Table 14. Year 10 – At home I have access to a computer to help me with my homework
Greater London
%
Inner London
%
Outer London
%
Key Boroughs
%
Non-key Boroughs
%
True 90 85 92 82 91
False 8 12 7 14 8
No response 1 3 1 4 1
N 22,451 5048 17,394 1428 21,014
A single response item
Due to percentages being rounded to the nearest integer, they may not sum to 100
Over 80% of pupils in London and in other metropolitan authorities had access to the internet at home and most had received advice on how to use the internet safely. Around three-quarters of Year 7 pupils in both areas (75% in London, 76% in other metropolitan areas) said that their parents, carers or teachers had advised them about using the internet safely, compared to 57% of pupils in Year 10.
Do you have access at home to the internet?
Across all areas there was a significant increase in the proportion of pupils with access to the internet at home, compared to 2005. Pupils in London were more likely to have access at home than similar pupils in other metropolitan areas.
Female pupils in Year 10 were less likely than other similar male pupils to have access to the internet at home.
Year 7 pupils from a Bangladeshi background were less likely to have access to the internet at home. Year 10 pupils of Indian heritage were more likely to have access at home. Overall, Year 10 pupils with English as an additional language were less likely to have access to the internet compared to otherwise similar pupils who spoke English as their first language.
Do your parents, carers or teachers advise you about using the internet safety?
Female pupils were more likely than male pupils to have received advice form their parents, carers or teachers about using the internet safely.
2.10 Travelling to school
Pupils in London were asked if the school they attended was the nearest school to their home. Less than half of pupils (45%) said that it was.
For most pupils in London and metropolitan authorities, the journey to school took less than half an hour. A slightly higher proportion of pupils in Year 7 than in Year 10 said it took less than 15 minutes to get to school. As shown in Table 15, it took pupils in London longer to get to school than pupils attending schools in metropolitan authorities.
Table 15. How long does it take you to get to school?
London Metropolitan Length of journey:
Year 7 pupils %
Year10 pupils %
Year 7 pupils %
Year 10 pupils %
Less than 15 minutes 40 30 47 42
15 to 30 minutes 35 36 40 43
31 to 45 minutes 11 15 9 11
46 minutes to 1 hour 5 7 3 3
More than 1 hour 2 3 1 1
No response 8 8 1 1
N 25,276 22,451 6784 6454
A single response question
Due to rounding, percentages may not sum to 100
Pupils in London were asked how they usually got to and from school (pupils could indicate more than one method of transport). Most pupils in London normally used public transport for at least part of their journey to school (55%), just under half (47%) said that they walked. Around a third (31%) travelled to school by car. Less than 5% cycled to school.
Pupils attending schools in key boroughs were less likely than pupils in non-key boroughs to walk to school (39% compared to 45% of Year 7 pupils; 39% compared to 49% of pupils in Year 10); and more likely to travel by public transport (62% compared to 54% of pupils in Year 7; 63% compared to 56% of pupils in Year 10).
Pupils in Inner London were also more likely to travel to school by public transport than pupils in Outer London (58% compared to 53% of pupils in Year 7; 61% compared to 55% of pupils in Year 10).
Year 7 pupils in London were also asked if they felt safe travelling to and from school. Most pupils (84%) said that they did.
2.11 Future learning and careers
Almost all Year 10 pupils in London thought that having the opportunity to do work experience was important (62% described it as very important; 27% as quite important). Access to good careers guidance was important to 85% of pupils in Year 10 (51% described it as very important; 34% as quite important).
Just over 80% of Year 7 and Year 10 pupils in London said that they intended to stay on in education after the age of 16, and around 90% of pupils in Year 10 said that they would like to go to university.
Almost all pupils in Year 10 (92%) felt that it was important to have a good range of subject options to choose from (62% described this as very important). Nearly 40% thought it was very important to be able to do work-related courses. Around 80% of pupils in Year 10 thought that there was a good range of courses to choose from after completing their GCSEs.
2.12 Telling other young people about the school
In order to gather more detailed information on pupils’ opinions about the school they attended, all pupils were asked the following question:
What would you say to someone thinking of moving to your school?
Table 16 shows the most frequently mentioned comments from pupils in London and metropolitan schools. When ordered in terms of the most frequently mentioned issues, the ranking of types of comments from pupils in London and in other metropolitan areas was very similar.
The most common response from pupils (regardless of year group or location) was to say something positive about the school and/or to encourage other young people to come to their school. Some examples of pupils’ comments are shown in the text box below.
Year 10 than in Year 7 said they would recommend that other young people chose a different school to come to.
‘It’s hard at first, but it’s a brilliant school if you want to learn. See you there – you’ll fit in without a doubt. There’s almost a community feeling here.’ (Year 10 pupil, London authority)
‘They should come because they would be very happy here.’ (Year 7 pupil, metropolitan authority)
‘It’s a good school and if you are prepared to work hard you can do very well. Good sports facilities and mostly friendly teachers. Nice pupils and a fun atmosphere.’ (Year 10 pupil, London authority)
‘I would say that they should not worry as this school is very welcoming and there are very nice teachers and pupils to help you settle in.’
(Year 7 pupil, London authority)
‘I think that this school is a very good and well-disciplined school. I think anyone who comes here will like it too! I think that the teachers are friendly and there’s a wide range of activities after school, so there are lots of opportunities.’ (Year 7 pupil, London authority)
‘You’ll have to wake up really early if you live a long way from the school. You’ll be tired’. (Year 7 pupil, London).
‘You will fit in straight away. Other people have moved to our school and immediately found friends and been accepted.’
(Year 10 pupil, metropolitan authority)
Table 16. What would you say to someone thinking of moving to your school? London authorities Metropolitan authorities Both
years %
Year 7
%
Year 10
%
Both years %
Year 7
%
Year 10
%
Positive comment about the school in general (e.g. ‘it’s a good school’)
30 36 23 37 45 28
Do come to this school / It would be a good idea to come to this school
16 18 13 20 23 18
You can learn a lot here / You
will get a good education here 10 10 10 7 7 7
Do not come here, choose a
different school 8 5 11 9 4 14
Most of the pupils are
nice/friendly/kind 7 9 5 7 8 5
General comment about the school (e.g. ‘the school is alright’)
5 5 5 7 8 7
I would say it was their decision
/ up to them 4 3 5 5 4 6
If you work hard you will be OK 4 4 5 3 2 4
The school has good /strict
discipline 4 4 4 3 2 3
It might be difficult at first as
you need time to settle in 3 4 2 4 6 3
Most of the teachers are
nice/friendly/kind 3 5 2 4 5 2
If you behave well you will be
OK 3 4 2 3 4 2
Negative comment about the school in general (e.g. ‘the school is horrible’)
3 3 4 3 2 4
Most of the teachers teach well/ there is a high standard of teaching
3 3 3 3 3 2
Pupils get a lot of support/help
with problems 2 2 1 2 2 1
Some of the tea