Deployment and Impact
of Support Staff in Schools
The Impact of Support Staff in Schools
(Results from Strand 2, Wave 2)
Research Report DCSF-RR148
Peter Blatchford, Paul Bassett, Penelope Brown,
Maria Koutsoubou, Clare Martin, Anthony Russell and
Rob Webster with Christine Rubie-Davies
Research Report No
DCSF-RR148
Deployment and Impact of Support Staff
in Schools
The Impact of Support Staff in Schools
(Results from Strand 2, Wave 2)
Peter Blatchford, Paul Bassett, Penelope Brown,
Maria Koutsoubou, Clare Martin, Anthony Russell
and Rob Webster with Christine Rubie-Davies
Institute of Education, University of London
The views expressed in this report are the authors’ and do not necessarily reflect those of the Department for Children, Schools and Families.
Contents
Chapter 1: Introduction... 1
1.1 Introduction to the project ... 1
1.2 Aims of the research... 1
1.3 Impact of support staff on teachers and teaching... 3
1.4 Impact on pupil behaviour, attitudes to learning and academic attainment ... 4
1.5 The Wider Pedagogical Role of support staff: Strand 2 Wave 2 case studies ... 5
Chapter 2: Methodology ... 6
2.1 Research design... 6
2.2 Main Pupil Support Study (MPSS)... 7
2.2.1 Information on pupils ... 7
2.2.2 Amount of support ... 8
2.2.3 Pupil outcomes ... 9
2.2.4 Pupil Positive Approaches to Learning (PAL)... 10
2.2.5 Numerical data on academic attainment ... 10
2.2.6 Statistical methods ... 11
2.3 Teachers’ views on pupil learning and behaviour, teaching, and level of job satisfaction, stress and workload and transfer of tasks to support staff ... 11
2.4 Strand 2 Wave 2 case studies ... 12
2.4.1 Data collection ... 13
Chapter 3: The impact of support staff on teachers and teaching... 17
Key findings ... 17
3.1 Impact of support staff on teachers’ workloads, job satisfaction and levels of stress ... 17
3.1.1 Impact on routine administrative and clerical tasks ... 17
3.1.2 Who now completes the tasks?... 20
3.1.3 Impact on teacher workload ... 20
3.1.4 Impact of support staff on teacher workload: open-ended comments... 22
3.1.5 Impact on teacher job satisfaction ... 24
3.1.6. The impact of support staff on teacher job satisfaction. Answers to open-ended questions ... 25
3.1.7 Impact on levels of teacher stress ... 27
3.1.8 Impact of support staff on levels of teacher stress: open-ended answers... 28
3.1.9 The impact of support staff on teaching ... 30
Chapter 4: The impact of support staff on pupils... 34
Key findings ... 34
4.1 The impact of support staff on pupil learning and behaviour ... 34
4.2 Impact of support staff on pupil positive approaches to learning (PAL)... 37
4.3 The effect of support staff on pupil academic progress ... 42
4.4 Further examination of the effect of support staff on pupil attainment - Wave 2 ... 56
4.4.1 Additional adjustments for change in support... 56
4.4.2 Further analyses allowing for any possible bias in missing data from the study ... 56
Chapter 5: Report on Strand 2 Wave 2 case studies ... 60
Key findings ... 60
Structured Observations... 60
Strand 2 Wave 2 Case Studies ... 60
Analysis of Teacher and TA talk... 60
5.1 Findings from the structured observations... 61
5.2 Strand 2 Wave 2 case study data... 67
5.2.1 Dimension A: Conditions of employment of support staff ... 69
5.2.2 Dimension B: Preparedness of support staff ... 72
5.2.3 Dimension C: Support staff deployment ... 82
5.2.4 Dimension D: Support staff practice ... 94
5.2.5 Dimension E: Conceptualisations of pupil progress in relation to support staff ... 100
5.3 Analysis of transcripts of TA-pupil and teacher-pupil interactions ... 105
Chapter 6: Discussion ... 123
6.1 Effect of support staff on teachers ... 123
6.2 Effect of support staff on teaching ... 125
6.3 Effect of support staff on teaching: systematic observation results ... 125
6.4 The effect of support staff on pupil behaviour and learning... 126
6.5 Impact of support staff on pupil engagement and active interaction with adults: systematic observations ... 127
6.6 Impact of support staff on pupils’ ‘positive approaches to learning’ (PAL) ... 127
6.7 Impact of support staff on pupil attainment... 129
6.8 Benefits for non-supported pupils? ... 130
6.9 Explanations of the findings on pupil academic progress... 131
6.9.1 Pupil explanations ... 131
6.9.2 Support staff characteristics: qualifications and experience... 132
6.9.3 Other possible explanations of relationships between support and pupil educational progress... 132
6.9.4 Preparation of support staff ... 133
6.9.5 Deployment of support staff... 135
6.9.6 Practice of support staff... 136
6.9.7 Summing up explanations for effect on attainment ... 138
6.9.8 Summing up the impact of support staff ... 139
6.9.9 Future research ... 140
Appendices... 142
Appendix 1. Support staff now performing each task previously carried out by teachers (Wave 3)... 142
Appendix 2a. Impact of support staff on teacher workloads by country and school phase. ... 144
Appendix 2b. Impact of support staff on teacher workloads by support staff category... 145
Appendix 3a. Impact of support staff on teacher job satisfaction by country and school phase 146 Appendix 3b. Impact of support staff on teacher job satisfaction by support staff category ... 147
Appendix 4a. Impact of support staff on teacher stress by country and school phase ... 148
Appendix 4b. Impact of support staff on teacher stress by support staff category ... 149
Appendix 5. Coding framework and definitions of categories... 150
Appendix 6. Possible explanations for findings on pupil academic progress ... 155
Chapter 1: Introduction
This study was designed to obtain up to date and reliable data on the deployment and
characteristics of support staff and the impact of support staff on pupil outcomes and teacher workloads. The study covered schools in England and Wales. It involved large scale surveys (Strand 1), followed by a multi-method and multi informant approach (Strand 2). It provided detailed baseline data by which to assess change and progress over time. It sought to
understand the processes in schools which lead to the effective use of support staff. The DISS project was funded by the Department for Children, Schools and Families (DCSF) and Welsh Assembly Government (WAG).
1.1 Introduction to the project
In earlier reports describing the Strand 1 Wave 1 and Wave 2 surveys (Blatchford, Bassett, Brown, Martin, Russell, Webster and Haywood, 2006; Blatchford, Bassett, Brown, Martin, Russell and Webster, 2007a) we detailed the main reasons for the recent growth in the range and number of support staff in schools. In summary, these included the greater freedoms concerning school budgets for heads and governors, arising out of the 1988 Education Reform Act and Local Management of Schools; the delegation of funding for Special Educational Needs (SEN), accompanied by increased provision of learning support assistants for pupils with
statements of special educational needs; the introduction of the national literacy and numeracy strategies; and recent Government commitments to and investment in increased numbers of full-time equivalent support staff (FTE), including teaching assistants.
A major context for policy and resourcing involving support staff in schools was the introduction in January 2003 by the Government, local Government employers and the majority of school workforce unions of the National Agreement: ‘Raising Standards and Tackling Workload’ (DfES, 2003a)1. The National Agreement (NA) set out a number of measures designed to raise pupil standards, tackle teacher workload including a concerted attack on unnecessary paperwork and bureaucracy, and create new support staff roles.
1.2 Aims of the research
Despite the large increase in support staff it is recognised that there were significant gaps in knowledge about many aspects of support staff in schools. There is not space here to provide a review of previous research other than to say that it provides only limited information on the deployment and impact of support staff in schools, and on the processes in schools through which impact is maximised or inhibited. This study was designed to help fill these gaps. The two main aims of the project were:
• To provide an accurate, systematic and representative description of the types of support staff in school, and their characteristics and deployment in schools, and how these change over time; and
• To assess the impact or effect of support staff on teaching and learning and management and administration in schools, and how this changes over time.
11
Although the study was carried out during the period the National Agreement was introduced it was not within the study’s remit to directly address the impact of these reforms, or to assess how far participating schools had completed NA contractual changes or remodelling changes; the focus was on the deployment and impact of support staff.
Strand 1 addressed the first aim and provided comprehensive and reliable information on support staff in schools in England and Wales. It involved three biennial questionnaire surveys - the Main School Questionnaire (MSQ), the Support Staff Questionnaire (SSQ), and the Teacher Questionnaire (TQ) - which aimed to provide a systematic account of basic information on support staff in schools and changes over a key five year period (2003-8). Information collected from Strand 1 addresses characteristics and deployment of support staff, including details of all support staff in schools, numbers and type, age, gender, ethnicity, salary levels, experience, qualifications, turnover, hours and duties, deployment in schools, how they support teaching and learning, and training. Information was also collected to provide a detailed account of staff perceptions of their job satisfaction and conditions of employment. Results from Strand 1 Wave 1 are provided in Blatchford et al. (2006), results from Strand 1 Wave 2 in Blatchford et al.
(2007a) and results from Waves 1-3 together can be found in Blatchford, Bassett, Brown, Martin, Russell and Webster (2009).
A main aim of Strand 2 was to address the second aim, i.e., the impact of support staff. This is one of the most important yet problematic aspects of research in this area. Lee (2002)
concluded that “relatively few studies provided good evidence on which to base conclusions about impact.” There are a number of limitations to previous studies that make it difficult to draw clear conclusions. Evidence is patchy with claims often based on anecdotal and informal
comments. In particular, there are huge challenges for research seeking to measure effects of TAs on pupil outcomes in the context of normal school conditions. One limitation of the analyses of the impact of support staff, conducted as part of the earlier Class Size and Pupil Adult Ratio (CSPAR) KS2 study (Blatchford, Russell, Bassett, Brown, and Martin, 2007b), was that
relationships between TAs and outcomes were examined for the whole class. It was recognised that future research in this area would need to target more precisely the connections between TAs and the specific pupils they support, though this would not be an easy task. One would also need to cover cognitive and non-cognitive areas, that is, address the impact of TAs in terms of pupil learning and attainment, but also in relation to aspects such as confidence, concentration, working independently and the ability to complete assigned work, as well as interactions
between teachers and pupils in the classroom. There is only relatively anecdotal evidence on these dimensions, and so we also wanted to collect systematic evidence in order to provide a more comprehensive and reliable account of the effect of TAs.
In the Strand 2 Wave 1 report (Blatchford, Bassett, Brown, Martin, Russell and Webster, with Babayigit and Haywood, 2008) we addressed deployment and some aspects of impact. We also drew some data from aspects of Strand 1. Deployment was addressed in terms of research tools such as timelogs completed by support staff and data from systematic observations. Impact was addressed in terms of teacher workloads and teacher views on the effect of support staff on their job satisfaction and levels of stress; teacher and support staff interactions with pupils (from systematic observations of individual attention, classroom control, amount of teaching and amount of interaction with teachers); and effects on pupils were addressed in terms of teacher views about effects on their behaviour and learning and effects on teacher ratings of their positive approaches to learning (motivation, engagement, etc.).
also come from Strand 1. The report also seeks to contextualise the results on impact by drawing on the results from the Strand 2 Wave 2 case studies, which provide valuable information on the preparedness, deployment and practice of support staff.
A main focus of Strand 2 of the DISS project was with the impact of classroom based support staff in everyday classrooms. In the DISS classification of different categories of support staff, such staff were called ‘TA equivalent’ staff though, in line with many other studies, the generic term ‘Teaching Assistant’ (TA) is sometimes used here to cover similar classroom based post titles which engage in similar activities. This study is not restricted to pupils with SEN, on School Action etc., but covers all pupils in mainstream classes who receive support.
The study has wide significance in the context of concern with the lack of progress made by some pupils in school. Classroom based support staff may offer huge potential to help teachers and pupils but given that lower attaining pupils are more likely to be given extra support in schools it is vital that this support is well organised and effective.
The research is timely because it comes at a time when changes after the NA have been implemented and when the WAMG (Workforce Agreement Monitoring Group) and other bodies, as well as schools and local authorities (LAs), now need to address policy and practice
regarding the successful deployment of TAs.
In this report we use large scale analyses to address the impact of support staff on two main outcomes:
1. On teachers and teaching i.e. teacher job satisfaction, stress and workloads (based on teacher views); a systematic breakdown of activities passed from teachers to support staff (TQ), and teacher views on effects of support staff on their teaching.
2. On pupils in terms of the effect of support staff on pupil learning and behaviour (from teacher views), positive approaches to learning in terms of confidence, motivation and ability to work independently and complete assigned work (from teacher ratings); and pupils’ academic
attainment in terms of the effect of the amount of support they receive on end of year attainment, controlling for other factors likely to confound this relationship, e.g. prior attainment and SEN status. In this report we report results on effects on attainment from Wave 1 and also from the larger scale replication study in Wave 2.
We also, through case studies as part of Strand 2 Wave 2, provide an interpretive and
grounded analysis of factors relating to support staff deployment and impact in schools, focusing on pupil and / or class-based support staff.
1.3 Impact of support staff on teachers and teaching
Concern about recruitment and retention in the teaching profession was a main reason for the NA and the proposal that support staff should release teachers from routine and clerical tasks so teachers could focus on core teaching tasks. Findings from Waves 1 and 2 of Strand 1
5% said that support staff had decreased their job satisfaction. There was also a positive view on the effect of support staff on teacher stress. Two thirds of teachers said that support staff had led to a decrease in stress.
Some studies also paint a largely positive picture of the impact of support staff on teaching (e.g., Mortimore and Mortimore, with Thomas, Cairns and Taggart, 1992; HMI, 2001; Ofsted, 2002) though for the most part, evidence is based on teachers’ reports. Results from the CSPAR project found that teachers were largely positive about the contribution of TAs in schools
(Blatchford et al., 2007b). This was seen in terms of: increased attention and support for learning (e.g., more one to one attention, support for pupils with SEN and support for teaching of
literacy); increased teaching effectiveness (e.g., in terms of productive group work, productive creative and practical activities, lesson delivery and curriculum coverage); effective classroom management; and effects on children's learning outcomes.
In this report we address effects on teachers and teaching in a more extensive, multi-method and systematic way. We present full results from the three waves of questionnaires returned by teachers and we take the opportunity to summarise results across the three waves. We address the effects of support staff on teacher’s workloads, job satisfaction and levels of stress, and also on the way support staff have affected their teaching. In order to provide as complete a summing up of results on impact as possible, in the discussion we also take on board results from the extensive systematic observation study conducted as part of Strand 2 Wave 1 (Blatchford et al, 2008).
Results on impact on teachers and teaching are presented in Chapter 3.
1.4 Impact on pupil behaviour, attitudes to learning and academic attainment
Effects on teacher workloads, job satisfaction, stress and teaching (by the teacher) can be seen as evidence that support staff have an indirect effect on pupil standards. But the Government have also proposed that support staff should have a direct impact on pupil attainment, through overtly pedagogical input (DfES, 2002). In line with this aim the DISS project has already shown conclusively, across a range of sources of data (e.g., timelogs and systematic observations), that classroom based support staff spend much of their time in a direct pedagogical role,
supporting and interacting with pupils, and this exceeds time assisting the teacher or the school (Blatchford et al., 2007a).
In this report we present results from the Strand 1 Waves 1-3 TQ on teachers’ views on the impact of support staff on pupil behaviour and learning. For completion, we also summarise, in the discussion section, results already published from the Strand 2 Wave 1 systematic
observations (Blatchford et al, 2008), on the effect of TAs on pupils’ classroom behaviour.
When it comes to effects of support staff on pupils’ academic progress and learning, there is little systematic research (Howes, Farrell, Kaplan and Moss, 2003). Evidence from studies that have addressed the effects of TAs on pupil outcomes in a more systematic way, e.g., by a numerical analysis of connections between support staff provision and pupil attainment test scores, are not conclusive. Schlapp, Davidson and Wilson (2003) concluded that they could not say whether a recent Scottish initiative to increase support staff in schools had led to improvement in pupil outcomes. A systematic review (Howes et al, 2003) identified the CSPAR KS1 study (Blatchford, Bassett, Goldstein and Martin, 2003) as one of only a very few studies of sufficiently high quality to warrant inclusion, and this study found no appreciable effect of the presence of TAs in classrooms on pupils’ academic progress in primary schools. As we have seen, the study was limited, however, in only examining effects at the level of the whole class, rather than the
individual supported pupil. Other studies report similar results; for example, Finn, Gerber, Farber and Achilles (2000), on the basis of data from the often-cited Tennessee STAR project, found that there was no compensatory effect of having extra staff in larger (‘regular’) classes, a result similar to that of Reynolds and Muijs (2003). But a main limitation of research in this field, and a key reason for the study reported here, is the lack of rigorous empirical studies of the impact of support staff on pupils. In this report we therefore report on findings from a systematic analysis of the impact of the amount of extra support from TAs on pupils’ academic progress. This was first conducted at Wave 1 of Strand 2 and then again on a larger sample in Strand 2 Wave 2.
Results on impact on pupils are presented in Chapter 4.
1.5 The Wider Pedagogical Role of support staff: Strand 2 Wave 2 case studies
The findings from Strand 1 and Strand 2 Wave 1 suggested the value of more detailed study of what we call the ‘Wider Pedagogical Role’ of support staff. This situates the interactions between support staff and pupils and teachers into a wider context, with particular attention to the support staff involvement in lessons and across the school day. As we shall see, this was approached by careful attention to the preparation of support staff for their classroom role, the nature of
decisions about their deployment and the way deployment works out in reality, and fine-grained detail on the activities and interactions of support staff. A nuanced approach was seen as essential to contextualising and explaining findings on the impact of support staff.
This was approached by extending the Strand 2 Wave 1 case study approach and focusing on classroom based support staff in particular. The resulting case studies included structured observations of teacher and TA activity. Qualitative classroom observations informed semi-structured interviews with school staff. The Strand 2 Wave 2 case studies went still further, in terms of collecting fine-grained data on adult-pupil dialogue that was essential to understanding the quality, rather than the quantity, of support staff-pupil interactions.
Chapter 2: Methodology
As described above, in this report we describe results from Strand 2 Wave 2. Some selected data from Strand 1 Wave 1 are also included and methods are described below.
2.1 Research design
Strand 2 used a multi-method approach, combining quantitative and qualitative methods, to obtain a detailed and integrated account of the deployment and impact of support staff. It combined numerical data on connections with pupil and teacher outcomes, with qualitative, interpretive analysis of processes in schools connected to the effective deployment of support staff.
Strand 2 Wave 1 took place in 2005/06 and had three main components: the first wave of the Main Pupil Support Survey (MPSS), a systematic observation component and a case study component. It focused on pupils in Years 1, 3, 7 and 10. The overall MPSS took place in a sample of 76 schools. Some of the MPSS schools also took part in case study visits, whilst others took part in systematic observation visits. Some schools had both case study and
systematic observation visits. Figure 2.1 describes the numbers of schools in each component.
Figure.2.1 - Number of schools in Strand 2 Wave 1 samples
2.2 Main Pupil Support Study (MPSS)
The main purpose of the MPSS was to address through systematic, quantitative study whether support provided for pupils affected pupil attitudes to learning and attainment, controlling for other possibly confounding factors (such as pupil prior attainment). Owing to the difficulty of dealing with attainment data from special schools, it was decided not to include them in this analysis.
[image:12.612.71.539.214.403.2]Details of year groups and data collection for Wave 1 and 2 are shown in Table 2.1.
Table 2.1 - MPSS sample and data collection: number of pupils (number of schools) per year group
UPN / Pupil Details
SENCO Form (e.g. amount of support)
Teacher Ratings of
Support
Teacher Ratings of
PAL
Start of Year Attainment
End of Year Attainment
Wave 1
Year 1 751 (33) 260 (27) 363 (18) 305 (18) 496 (20) 500 (31) Year 3 693 (22) 227 (28) 285 (19) 193 (19) 470 (23) 579 (33) Year 7 1821 (26) 154 (17) 220 (19) 197 (19) 1701 (30) 934 (21) Year 10 1931 (27) 180 (18) 290 (22) 206 (22) 1772 (32) 515 (22)
Wave 2
Year 2 1586 (51) - 1036 (38) 289 (36) 1261 (44) 1319 (51) Year 6 1513 (47) - 1148 (40) 299 (39) 1317 (42) 1399 (47) Year 9 2573 (15) - 1374 (14) 375 (14) 2258 (14) 2332 (15)
2.2.1 Information on pupils
To ensure that the effect of the level of support on the Positive Approaches to Learning (PAL)2 and attainment scores was correctly evaluated, it was necessary to control for a number of other factors that might influence pupil PAL and attainment. Therefore, data on pupil characteristics at Waves 1 and 2 was obtained through the School Census (formerly PLASC - Pupil Level Annual School Census) supplemented by information from schools. Different analyses controlled for a different combination of variables, and these are described in more detail for each analysis later in the report.
A summary of the characteristics of the pupils in the study is given in Table 2.2. As seen in Table 2.1, there were pupils within the sample for whom some basic information was held, but without a measure of additional support. As only pupils with a measure of additional support were included in the analyses, the figures in Table 2.2 are restricted only to pupils with a measure of support.
2
Table 2.2 - Characteristics of pupils included in the analyses for Waves 1 and 2
Wave 1 Wave 2
Characteristic Year 1 Year 3 Year 7 Year 10 Year 2 Year 6 Year 9
Number 363 285 220 290 1036 1148 1374
Male gender 53% 55% 59% 53% 54% 52% 45%
SEN (*) 31% 31% 40% 49% 23% 23% 22%
EAL(**) - 16% 11% 6% 9% 14% 2%
FSM (***) - 23% 28% 16% 13% 15% 11%
White Ethnicity - 77% 86% 91% 91% 83% 96%
(*) Pupils with any Special Education Needs (School Action, School Action+ or Statement) (**) English as an Additional Language. Information not available for schools in Wales (***) Eligible for Free School Meals
It can be seen that the percentages of pupils with SEN (includes School Action and School Action+) is high for Wave 1, relative to Wave 2, largely because the Wave 1 MPSS was restricted to a sub sample of pupils in each class, around half of whom would have been supported, and therefore with a correspondingly high percentage with SEN. The percentage of pupils with SEN fell by Wave 2 because all pupils in the class were included. Comparison with the national picture (figures from the DCSF, January 20093, and the WAG, 20084) indicates that the percentage of pupils with SEN is higher than the national average (8% for England; 19% for Wales) though the figures are not exactly comparable (e.g., the figure for England does not include pupils with School Action; the figure for Wales includes all statemented and
non-statemented pupils with SEN). In any case, the DISS study is focused on classroom support and so is likely to include more pupils with needs, allocated such support. There were also
differences between year groups in terms of the other characteristics (EAL, FSM and ethnicity) but, as explained below, these (and also SEN) were taken into account when analysing results, e.g. when analysing the relationship between support and academic progress. The percentage of pupils with EAL and FSM were roughly similar to the national figures (13% and 15%), though the DISS sample had more pupils in the white ethnicity group (national figure 81%).
2.2.2 Amount of support
In Wave 1 five different measures of the level of additional support were collected, one general teacher rating of the amount of support and four additional measures from the systematic
observation study, whilst at Wave 2 only the general teacher rating was used. As we show in the results section, the general rating led to the strongest and most clear set of results.
a. Hours support - Teacher ratings (Waves 1 and 2)
The first, main measure was teacher estimates of the amount of support received, expressed as a percentage of time. The actual wording was: ‘Please tick the percentage of time additional support was provided for this pupil in English lessons. This is additional support provided by a member of support staff e.g. TA, LSA, etc., not by yourself or another teacher. The support may
3
DCSF. (2009) Statistical First Release (SFR 08/2009): Schools, pupils, and their characteristics, January 2009 (provisional)
4
be in the class, withdrawn from the class, small group or 1-1’. They were given six categories denoting the amount of support: 0%, 1-10%, 11-25%, 26-50%, 51-75%, and 75+.
In a small number of cases in Wave 1 this information was not available. In order to increase the sample size it was replaced by estimates given by SENCOs (Special Educational Needs
Coordinators) (secondary only), or support staff themselves, of the amount of additional support expressed in hours and minutes for each pupil for mathematics, English, science and Welsh. These were collected at the time of the systematic observation visits. At Wave 2, only the teacher estimate was used, though as we shall see this was the most general and strongest measure.
Due to the relatively small sample size in Wave 1, for the purposes of analysis, three measures of the amount of support were used instead of six. These were a low support (supported 0-10% of time), medium support (11-50%) and high support (over 50% of time supported). Due to the increased sample size at Wave 2, five categories of support were used for the analysis (0%, 1-10%, 11-25%, 26-50%, 51%+).
b) Level of Support - Systematic Observations (Wave 1)
In addition to the main measure, there were four other measures of the amount of additional support received by a pupil, taken from the systematic observation data:
1. Support staff presence: the percentage of time in which a member of support staff was present in the classroom during observations
2. Support staff proximity: when ‘Pupil Supervision’ was either one-to-one or group, and a member of support staff was doing the supervising.
3. Support staff interaction: when the pupil was interacting with an adult and that adult was a member of support staff.
4. Support staff attention: when there was support staff interaction, and in addition the pupil was the focus of the adult’s attention.
It can be seen that these measures of support represent a hierarchy with different levels closer or further away from the pupil. They range from a simple tally of hours of support; through the presence of support staff in the classroom, on a moment by moment basis; through proximity to the pupil in a one to one or small group context; to direct interaction between support staff and pupil; and finally to individual attention toward the pupil.
For each pupil, the percentage of observations in which each of the three outcome measures occurred was used. An examination of the data indicated that the majority of these measures had a highly skewed distribution. Therefore, for the majority of analyses, pupils were divided into two groups, those with high occurrence of each measure, and those with a lower occurrence.
2.2.3 Pupil outcomes
benefits of classroom assistants more in terms of the range of learning experiences provided and effects on pupil motivation, confidence and self esteem, and found less effect on pupil behaviour. In line with what has been said above, however, much research is based on the views of teachers rather than objective measures of pupil outcomes. It seemed to us important to set out a model of the kinds of pupil ‘outcomes’ thought to be connected to support staff, and to then make use of reliable measures of the dimensions identified (see 2.2.4 and 2.2.5). This could then be complemented by more qualitative analysis of the views of teachers, support staff, and pupils.
We made use of a model used in the evaluation of effective group work in classrooms (SPRinG) project, one of the ESRC Teaching and Learning Research Programme Phase 11 projects, (see Blatchford, Galton, Kutnick and Baines, 2005). The SPRinG project was designed with a three component model of expected pupil outcomes. These were, first, learning and attainment outcomes; second, pupils’ motivation and attitudes to work; and third, interactive and dialogic features of classroom engagement and interaction (addressed through systematic observations in Strand 2 Wave 1). To this can be added pupils’ attentiveness in class. In this report we examine support in relation to the first two types of outcomes (classroom engagement and attentiveness were addressed in Blatchford et al., 2008).
2.2.4 Pupil Positive Approaches to Learning (PAL)
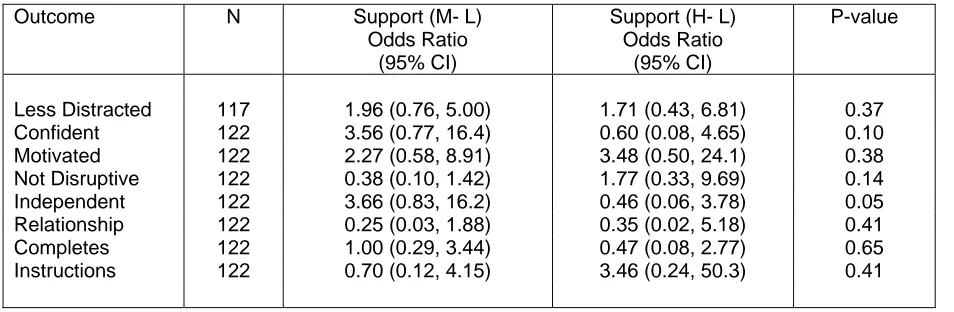
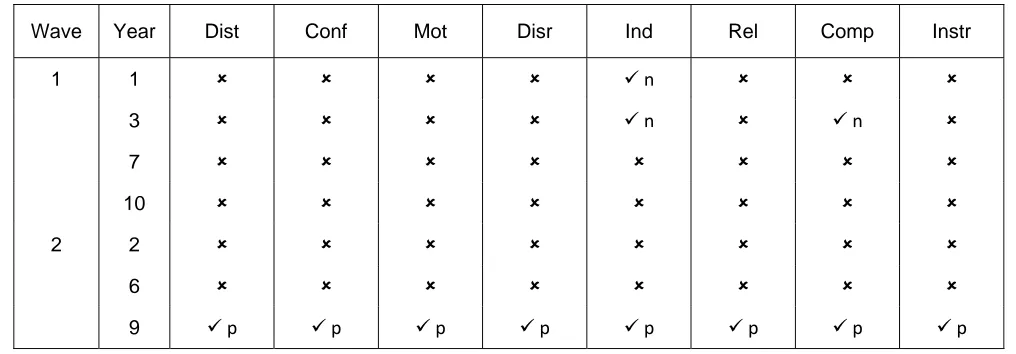
Teacher completed rating scales were developed, based on previous research in the CSPAR and SPRinG projects. Use was made of an amended version of the Pupil Behaviour Rating Scale, as developed in the CSPAR (Blatchford, Edmonds and Martin, 2003). This is a teacher completed instrument that in its most complete version comprised over 50 items rated on a three-point scale ('certainly applies to this child', 'applies sometimes to this child', 'does not apply to this child'). Scores on conceptually and empirically linked items that make up a set of factors were then added. One problem with this instrument was the length of time taken to complete forms for each pupil. For the purposes of the DISS project the form was therefore adapted to produce one item and scale for each dimension. Dimensions were representative of those previously developed, which had proven reliability. There were eight attitudes to learning dimensions: distractibility, task confidence, motivation, disruptiveness, independence,
relationships with other pupils, completion of assigned work, and follows instructions from adults. Teachers were asked after half term in the summer term (i.e., near the end of the school year) to describe change over the year on each of the dimensions in terms of a scale: 1. improved over the year; 2. stayed the same; and 3. deteriorated over the year. More details of the methods and analysis are given in the results section below.
2.2.5 Numerical data on academic attainment
The effect of support staff on pupils’ attainment was assessed in relation to progress over the school year. Progress was assessed by analysing effects on end of year attainment controlling for start of year scores. For Wave 1, start of year attainment scores came from Foundation Stage Profiles (for start of Year 1) or end of previous year Key Stage test scores (commonly called SATs) (for Year 3, 7 and 10). Attainment scores at the end of year came from
assessments already being used in schools and for the most part were teacher rated National Curriculum levels, but for Year 10 were predicted GCSE grades. Throughout this report we use the word ‘attainment’ but it should be noted that a strength of this study is that is was
Wave 2 involved Years 2, 6 and 9. Beginning of each year (baseline) scores came from assessments at the end of the previous school year. Where possible these data came from optional tests, but if they were not available then teacher assessments were used. Again the data collected was in terms of National Curriculum levels which were subsequently converted to a numerical score. Pupil attainment at the end of the school year came from end of year Key Stage tests and took a variety of forms. In Year 2, attainment took the form of National
Curriculum levels, which were reported as a main level and a sublevel (split into three categories A, B and C: e.g. 1C, 2B, etc) for English schools. For Wales, only the main numeric levels were available (e.g. 1, 2), and for Welsh data it was assumed that each pupil took the middle sublevel within each category. The main National Curriculum levels were also used in Year 6, as were fine grade levels which gave a greater distinction between pupils. Raw attainment scores were also analysed in Year 6. End of year attainment in Year 9 took the form of National Curriculum levels for all subjects, and also raw scores for English only.
Using guidelines from the DCSF, National Curriculum levels were converted into a numerical score. One whole level represents 6 points on this numerical scale, whilst a sublevel represents 2 points on this numerical scale. The exception was for Year 10 in Wave 1, where the predicted GCSE scores were also converted to numerical scores, with one point representing one GCSE grade.
2.2.6 Statistical methods
As discussed above, the analyses examined the extent to which the amount of support was related to end of year attainment controlling for factors that might be expected to confound the relationship e.g., prior attainment and SEN status. Multilevel regression models were required due to the hierarchical nature of the data. Two-level models were used with pupils contained within schools.
The effect of support on attitudes to learning and pupil attainment was examined by a
succession of statistical models, the first of which involved no adjustments for other variables, the last of which included controlling for all variables. It is quite likely that the provision of extra support for pupils will be based on their prior attainment and their SEN status and so we
controlled for these in the analysis. As we have said, controlling for prior attainment means that we were effectively looking at relationships with the relative progress in attainment made by pupils, a more useful measure than attainment only. More details are given when results are discussed (4.2 and 4.3).
2.3 Teachers’ views on pupil learning and behaviour, teaching, and level of job
satisfaction, stress and workload and transfer of tasks to support staff
Additional data are presented in this report from several aspects of Strand 1 questionnaires that address the impact of support staff.
At Waves 1 and 2, questionnaires were sent to four teachers in each school who responded to the MSQ (via the contact person appointed by the school). At Wave 3 there was concern at overburdening schools in the MPSS and so the TQ was sent to a random selection of schools omitting those who had indicated that they were interested in taking part in the MPSS. For primary schools, two questionnaires were sent to teachers from each key stage. For secondary schools, questionnaires were sent to two core subject teachers (English (and Welsh for Welsh schools), mathematics or science) and two non-core subject teachers (all other subjects). For special schools, questionnaires were sent to any four teachers. Information on specific teachers working within each school was unknown, so the decision as to exactly which teachers received the questionnaires was made by each individual school. The exact sample varied between the three waves but at each wave the initial sample consisted of around 8,000 questionnaires sent to about 2,000 schools. The response rate declined over the course of the study from 1824 (20%), 1297 (16%) to 970 (12%) at Waves 1, 2 and 3 respectively. The lower response rate at Wave 3 may be partly because schools which had not been sent the MSQ would therefore not be familiar with, or perhaps committed to, the study.
Impact on routine administrative and clerical tasks from TQ
A more detailed method of assessing the impact of support staff on teachers was to see how many of the routine administrative and clerical tasks had been transferred from teachers,
especially given that Phase 1 of the National Agreement required that these tasks be transferred to support staff from September 2003. In the TQ at each wave in Strand 1 teachers were
presented with a list of 265 routine and clerical tasks and asked to say for each task which they still performed themselves, which were performed by other staff, and to also give the post title of the staff member now carrying out the tasks.
2.4 Strand 2 Wave 2 case studies
The case studies added a qualitative element to the DISS project, to complement data from surveys and systematic observations in classrooms. This report presents findings from case study visits carried out in English and Welsh schools as part of Strand 2 Wave 2 (2007/8) (Wave 1 was carried out between June 2005 and July 2006).
The main purpose of the earlier Strand 2 Wave 1 case studies (reported in Blatchford et al, 2008) was to provide an interpretive and grounded analysis of factors relating to support staff deployment and impact in schools. Selected aspects of support staff deployment, classroom learning and school management were defined on the basis of pilot visits, and in relation to main headings from other methods of data collection, and these provided data which was organised around a set of key themes. The case studies focused on the school rather than individual classrooms, and on all support staff in schools, not just those with a direct role in relation to pupil learning. There were 47 schools in all in Strand 2 Wave 1, 21 primary, 14 special and 12
secondary schools in England and Wales. Classroom observations were followed up by nearly 500 interviews with teachers, support staff and a small sample of pupils in these schools.
The design of the Strand 2 Wave 2 case studies was informed by Wave 1 findings and the experience of carrying out this type of research in schools, and was adjusted to provide a more detailed analysis of:
5
The specific number of such tasks varies. Annex 5 to Section 2 of the School Teachers Pay and Conditions
1. The interactions between pupils and the support staff with whom they closely work, in order to better understand how pupils’ errors are dealt with, how much and what kinds of ‘scaffolding’ take place, and how the adults assess pupils’ difficulties and
misunderstandings; and
2. The wider pedagogical role of pupil-based support staff in terms of lesson and curriculum delivery, in order to learn more about their preparedness for, and involvement in, lessons (e.g. communication and feedback between support staff and teachers, and support staff’s pedagogical and subject knowledge).
The main purpose of the case studies was, as in Strand 2 Wave 1, to provide an interpretive and grounded analysis of factors relating to support staff deployment and impact in schools, but this time to focus on pupil and/or class-based support staff in particular roles. These roles were; higher level teaching assistants (HLTAs), teaching assistants (TAs), learning support assistants (LSAs) and classroom assistants (CAs) (referred to collectively as TAs); and support staff who undertook cover supervision (referred to collectively as cover supervisors). In Wave 1 special schools were included; in Wave 2 they were not.
In terms of the data collection carried out in schools, in Wave 2 the systematic observations were replaced by structured observations. These summarised activity within five minute blocks instead of ten-second blocks, and were not pupil-focused, but centred on the actions of adults and the contexts in which they worked. The semi-structured interviews with teachers and TAs allowed for a detailed interrogation of the lesson observations, rather than covering the full range of themes used for Wave 1. Audio recording of adult-pupil interaction was introduced in Wave 2, providing detailed data on the practices of teachers, TAs and cover supervisors.
On the basis of pilot visits, the key issues affecting pupil-based support staff were grouped into five dimensions, covering support staff management and deployment, classroom practice and preparedness. The dimensions performed the function equivalent to that of the ten themes used in Strand 2 Wave 1. They are described in detail in the results section (5.2) below.
The breakdown of participating schools is shown in Table 2.3.
Table 2.3 - Strand 2 Wave 2 Case study sample (schools)
England Wales Total
Primary 7 2 9
Secondary 7 2 9
Total 14 4 18
2.4.1 Data collection
Each case study visit lasted three days and took the form of ‘shadowing’ a member of support staff for a day. In most schools, two per school were shadowed, although in some small primary schools, only one person was followed. Structured observations were carried out on support staff in a variety of contexts, and these were followed up by semi-structured interviews with the teachers and support staff observed, and senior managers. Additionally, where possible, audio recordings of teacher and/or support staff interactions with pupils were made during observed sessions. Some teachers and support staff supplied researchers with documentation related to lesson planning and learning tasks. These sources were also augmented by field notes,
terms of the five dimensions of interest and written up by researchers using an agreed framework.
2.4.1.1 Structured observations
To give a systematic account of support staff at work, each observation period of the shadowing day (e.g. one lesson) was divided into five minute blocks. During each interval, broad and fine level information was recorded about the role of support staff and the context in which they were working (e.g. in or out of class). Additional data on teacher activity, pupil ability (as described by the teacher) and the tasks they undertook were also collected. A category coding system of descriptors and high frequency events was developed.
Summary of key variables
Teacher / support staff activity
• Not working with pupils (listening to teacher teach - inactive; talking to teacher; doing admin/working with resources; marking/assessing pupil work; other)
• Working with pupils (one-to-one; in small / medium / large group; roving; listening to the teacher teach - active; leading whole class; other).
Location of support staff
• In class
• Withdrawal in class (e.g. in classroom, but not part of main whole class activity)
• Withdrawal from class.
Supported task
• Non-differentiated
• Task related or differentiated
• Different task.
In total, there were 1,502 discrete observations, 1,437 of which were made in 140 lessons and sessions, both in and away from mainstream classes (54 in primary; 86 in secondary). Data were collected in eighteen schools (9 primary; 9 secondary). TAs (or equivalent title) were the focus of the majority of observations (98% for primary; 71% for secondary). Thirteen percent of all observations concerned cover supervisors (secondary schools only) and just 4% related to HLTAs6.
6
The research design prioritised observations of support staff working with Years 5 and 10, but as expected, most were shadowed working across the school with various year groups (see Table 2.4). TAs were observed working with Year 5/6 pupils in 62% of all primary observations. For 38% of all secondary observations, TAs were observed supporting pupils in Year 10/11. The majority of observations involving cover supervisors were in Year 10/11 classes (58%).
Table 2.4 - Strand 2 Wave 2 case studies year group x support staff type
Primary Secondary
TA TA Cover Supervisor
Year 1/2 26 4% N/A N/A N/A N/A
Year 3/4 174 29% N/A N/A N/A N/A
Year 5/6 373 62% N/A N/A N/A N/A
Year 7/8/9 N/A N/A 318 55% 72 37%
Year 10/11 N/A N/A 220 38% 113 58%
Other 28 5% 43 7% 9 5%
Total 601 100% 581 100% 194 100%
Codes describing the predominant activity of support staff and teachers over each five minute period were then entered onto an observation pro-forma.
Alongside this, researchers made detailed supporting notes, which not only gave more
information on the conditions and events in each block, but also provided a broader account of each observation period and how they fitted together to form the support staff’s day. These open-ended notes informed the qualitative analysis of the case study data.
2.4.1.2 Interviews
The shadowing days were followed up by semi-structured interviews with the target support staff and at least one teacher in whose class they were observed. This enabled researchers to clarify and probe the typicality of observations and, through the use of a schedule of questions, explore the opinions and attitudes towards support staff deployment, practice, interaction and impact. Researchers were, by and large, able to carry out the interviews as proposed, and where it was not possible to interview a specific individual, schools helpfully arranged suitable alternatives. Interviews with headteachers gathered similar data at the school level. Researchers conducted a total of 95 interviews across 18 schools (see Table 2.5).
Table 2.5 - Strand 2 Wave 2 case studies interviews conducted
Primary Secondary Total
Headteacher / other senior manager 9 10 19
Teacher 14 12 26
TA (or equivalent job title) 14 12 26
HLTA 0 1 1
Cover supervisor N/A 5 5
Administrative support staff 8 10 18
2.4.1.3 Strand 2 Wave 2 case studies audio recordings
In a sub-sample of the schools a total of 130 lesson/session length recordings of teacher and support staff talk were made in 15 schools (8 primary; 7 secondary), 42 of which were made simultaneously in the same classroom (see Table 2.6). The target sample for the recordings were English and mathematics lessons in Years 5 and 10, but researchers made recordings whenever the opportunity arose. As a result, almost three times as many recordings as originally proposed were made, across a range of year groups and subjects, making a substantial data set. Recordings were made of support staff working in different contexts, both in terms of their physical location (e.g. in class, withdrawn within class or withdrawn from class) and the role they took (e.g. supporting a pupil one-to-one and in groups, roving the class or leading a class as part of cover/PPA arrangements).
However, for the purposes of contrasting the interactions of teachers and support staff with pupils, the main analysis was conducted on pairs of teacher to pupil and support staff to pupil talk in the same lessons. In order to make the classroom conditions as similar as possible we also restricted the analysis to English and mathematics and to situations where support staff were in the classroom with the teacher (the structured observations showed that support staff spent most of their time in this way). This resulted in a main sample of 16 lesson length transcriptions of teacher to pupil talk and 16 lesson length transcriptions of support staff to pupils. In addition a sample of 8 sessions led by teaching assistants when out of the classroom were coded in order to see whether their talk differed substantially from that when supporting pupils within the classroom. More details on the coding frame, methods of analysis and inter-rater agreement are presented in the results section (5.3) below.
Table 2.6 - Strand 2 Wave 2 case studies audio recordings made
Primary Secondary Total
Teacher 27 18 45
TA 40 31 71
HLTA 0 3 3
Teacher & TA (simultaneous) (24) (18) (42)
Cover supervisor N/A 11 11
Total 67 63 130
An integrated approach to analysing the roles and practices of pupil-based support staff was used to collate and integrate all the data from the case studies, within which data from multiple sources was described and analysed in terms of the five dimensions of interest. The dimension of interest tables acted as the framework used to organise data for each school, and was
designed to allow comparison of teacher and support staff roles, and the structures and contexts that influenced and shaped practice. Following the same process as for the Strand 2 Wave 1 case studies, material for each dimension was broken down and prevalences calculated using a coding frame developed by two researchers. The dimensions were a descriptive tool for
Chapter 3: The impact of support staff on teachers and teaching
Key findings
• At Wave 1 most routine and clerical tasks were still performed by the teachers but by Wave 2 and 3 there was a major change with most tasks now performed by support staff. Administrative staff were far more likely than any other support staff category to perform tasks previously undertaken by teachers.
• Just over half of teachers at Wave 3 judged that support staff had led to a decrease in their workload mainly because the transfer of routine activities allowed more time for teaching and attending to pupils. In a minority of cases workload had increased because of planning required to prepare support staff.
• Support staff had a positive effect on teachers’ level of job satisfaction. The main reasons given for the impact of support staff on teachers’ job satisfaction were: more of the individual needs of their pupils were being met; pupils’ learning and achievement were enhanced; the personal qualities and skills of the support staff; time available for teaching was increased and the quality improved.
• There was also a positive view on the effect of support staff on teacher stress, largely because of effects on teachers and their teaching, e.g., being able to share their workload.
• The main ways that teachers felt that support staff had affected teaching were through bringing specialist help, allowing more teaching, affecting curriculum / tasks / activities offered, taking on specific pupils, removing administrative and routine tasks, and allowing more time for planning and preparation.
3.1 Impact of support staff on teachers’ workloads, job satisfaction and levels of
stress
3.1.1 Impact on routine administrative and clerical tasks
One method of assessing the impact of support staff on teachers was to see how many of the routine administrative and clerical tasks had been transferred from teachers. In the TQ, teachers were presented with a list of 267 routine and clerical tasks and asked to say for each task which they still performed themselves, which were performed by other staff, and to also give the post title of the staff now carrying out the tasks.
This exercise was conducted for all three waves (see Table 3.1). In Wave 1 it was found that most tasks were still performed by the teachers. At Wave 1 those tasks most likely to be done by the teacher (more than 60% of teachers) were record keeping, filing, classroom display, processing exam results, collating pupil reports, administering work experience, administering examinations, ordering supplies and equipment, stocktaking, cataloguing, preparing equipment and materials, minuting meetings, coordinating and submitting bids, seeking personnel advice, managing pupil data and inputting pupil data. By Wave 2 there was a major change with most tasks not now being performed by teachers. The drop in numbers of teachers now performing these tasks was in many cases very marked, with a number more than halving (see Table 3.1). Only record keeping,
7
classroom displays, administering and invigilating examinations (predominantly at secondary level), and giving personnel advice were still mostly done by teachers (i.e. more than 60% of teachers). The results for Wave 3 showed a picture that was very similar to Wave 2, with a similar proportion of teachers performing each task.
As mentioned in the Strand 1 Wave 1 report (Blatchford et al, 2006), even these results may underestimate the impact of support staff in that tasks may still be performed or directed by teachers, but they may have passed some or most aspects on to support staff. In this sense teachers may still be associated with some tasks such as classroom displays, but through organising them rather than carrying out all the work themselves.
Table 3.1 - Administrative tasks carried out by teachers and support staff
Task Performed by yourself Performed by others
Wave 1
N (%) Wave 2 N (%) Wave 3 N (%) Wave 1 N (%) Wave 2 N (%) Wave 3 N (%)
1 Collecting money 720 (57%) 517 (42%) 439 (49%) 604 (48%) 810 (65%) 545 (61%) 2 Chasing absences 369 (43%) 237 (20%) 202 (23%) 547 (63%) 1013
(85%)
729 (82%)
3 Bulk photocopying 546 (46%) 391 (31%) 294 (32%) 797 (67%) 972 (67%) 716 (78%) 4 Copy typing 314 (58%) 325 (31%) 282 (39%) 264 (49%) 777 (49%) 474 (65%) 5 Producing standard
letters
394 (51%) 364 (30%) 356 (40%) 419 (54%) 938 (54%) 611 (69%)
6 Producing class lists
387 (49%) 322 (27%) 274 (31%) 444 (56%) 963 (79%) 671 (76%)
7 Record keeping 1251 (94%)
1101 (89%)
802 (89%) 148 (11%) 275 (22%) 199 (22%)
8 Filing 734 (69%) 695 (58%) 539 (60%) 456 (43%) 687 (57%) 482 (54%) 9 Classroom display 1195
(83%)
947 (75%) 721 (78%) 543 (38%) 671 (53%) 506 (55%)
10 Analysing attendance data
139 (24%) 122 (11%) 104 (12%) 430 (77%) 1057 (91%)
793 (92%)
11 Processing exam results
527 (71%) 472 (47%) 357 (48%) 267 (36%) 615 (62%) 449 (61%)
12 Collating pupil reports
717 (70%) 668 (56%) 469 (53%) 331 (32%) 593 (50%) 461 (52%)
13 Administering work experience
398 (68%) 392 (41%) 287 (41%) 194 (33%) 592 (62%) 435 (62%)
14 Administering exams
572 (83%) 542 (61%) 377 (59%) 129 (19%) 409 (46%) 304 (47%)
15 Invigilating examinations
658 (87%) 546 (66%) 388 (64%) 145 (19%) 355 (43%) 268 (44%)
16 Admin of teacher cover
230 (50%) 214 (22%) 148 (21%) 248 (53%) 810 (82%) 604 (84%)
17 ICT trouble shooting
290 (42%) 258 (22%) 178 (21%) 445 (65%) 994 (86%) 722 (85%)
18 Commissioning ICT equip.
185 (37%) 168 (16%) 119 (12%) 332 (67%) 937 (89%) 712 (88%)
19 Ordering supplies 846 (76%) 627 (52%) 472 (53%) 382 (34%) 790 (65%) 566 (64%) 20 Stocktaking 417 (61%) 364 (34%) 292 (37%) 303 (44%) 787 (74%) 566 (72%) 21 Maintain equipment 528 (71%) 489 (46%) 383 (48%) 284 (38%) 712 (67%) 534 (67%) 22 Minuting meetings 645 (76%) 491 (46%) 414 (52%) 246 (29%) 653 (62%) 470 (59%) 23 Co-ordinating/
submit bids
461 (76%) 463 (50%) 353 (50%) 141 (24%) 517 (56%) 385 (55%)
24 Giving personnel advice
582 (84%) 566 (62%) 421 (61%) 140 (21%) 452 (49%) 355 (51%)
25 Managing pupil data
717 (78%) 640 (56%) 519 (60%) 275 (32%) 679 (59%) 500 (58%)
3.1.2 Who now completes the tasks?
In the TQ, teachers indicated the post title of those now performing each task previously carried out by the teacher. These data were then classified into the seven support staff categories. Full results are shown in Appendix 1. The results for Wave 3 were almost identical to those for Wave 2 for all tasks.
One result clearly stood out: administrative staff were far more likely than any other support staff category to perform tasks previously undertaken by teachers. Taking a 60% criteria as an indication of where a member can be said to have main responsibility (other than the teacher), administrative staff now performed 13 of the 26 tasks (i.e., collecting money, chasing absences, copy typing, producing standard letters, producing class lists, record keeping, analysing
attendance data, processing exam results, collating pupil reports, administering exams, ordering supplies, managing pupil data, and inputting pupil data). TA equivalent staff at Waves 2 and 3 were said to have taken on classroom displays (this does not necessarily contradict the fact that in Table 3.1 classroom displays are still for the most part undertaken by teachers), technicians have taken on ICT trouble shooting/repairs and commissioning ICT equipment, and other pupil support staff have taken on invigilating examinations. Pupil welfare, facilities and site staff have barely figured in the transfer of tasks from teachers.
3.1.3 Impact on teacher workload
Teachers were also asked to indicate how support staff they worked with in the last week had affected their workload, if at all. Results for Wave 3 are illustrated in Figures 3.1 and 3.2 and full results can be found in Appendix 2. There were few responses in some of the five categories of the scale and so the five point scale was reduced to three points: decrease, no change and increase.
The results showed that support staff had a positive effect on teacher workload. In Wave 3, just over a half of teachers (53%) said this member of support staff had caused a decrease in workload, just over a third (36%) had led to no change in workloads, and just 12% said they had caused an increase. There was a very similar picture at Waves 1 and 2. However, the results varied by support staff category. Administrative staff, technicians, and TA equivalent staff were all responsible for more of a decrease in workload (70%, 56%, and 58% respectively), whilst there was far less impact for either facilities or site staff on workload (7% and 21%). The result concerning administrative staff is in line with results just presented from the list of tasks
transferred to support staff, showing that they reduced teacher workloads.
When all support staff categories were considered together, there were no differences between the three waves. There were also no differences between waves when individual support staff categories were considered separately, though there were some signs (which were just
Figure 3.1 - Impact of support staff on teacher workload (all staff, and by country and school phase) [Wave 3]
Total base figure = 1787 Data from TQ3
Figure 3.2 - Impact of support staff on teacher workload (by support staff category) [Wave 3]
[image:26.612.67.437.392.618.2]3.1.4 Impact of support staff on teacher workload: open-ended comments
Teachers were asked to comment on how support staff (they had worked with in the last week) had affected their workload, if at all. There were 605 teacher responses at Wave 2 and 468 at Wave 3. A similar coding frame was used at both waves. There were many codes and in this report we do not give a detailed breakdown of frequencies of each code but concentrate on the most frequent categories. It was clear from the teachers’ comments in Wave 2 that for many of them the presence of support staff in the classroom and in the school has had a positive impact on their workload. Some of the teachers (4%) merely stated that their workload had decreased, whilst 44% went into much greater detail often listing the tasks that they no longer had to perform or at least could carry out less frequently because the support staff were doing them instead. Such tasks included photocopying, administration, displaying work and dealing with resources. Some teachers (3%) stated that the support staff saved them time by not having to do the work themselves whilst 4% said that it resulted in them being ‘released’ or ‘freed up’ to focus on other areas of their work, particularly teaching and the pupils. For 6% of the teachers the impact of a reduction in workload had other effects as well: for some this was just the ability to do the job, whilst for others it brought about the pleasure of a good working relationship, a reduction in pressure and making the job easier.
Teachers’ comments in Wave 3 suggested that this positive impact had been maintained. The most frequent individual category (26%) related to being relieved of their administrative burden, and another key impact area (13%) reflected the work support staff did with, and for, pupils (e.g. sharing teacher workload during lessons). Nine percent of comments - a greater proportion than in Wave 2 - reflected how support staff helped to ‘free up’ time for core teaching tasks. This is an increase in the proportion of teachers that made similar comments in Wave 2 (around 7%).
Classroom assistant can prepare lesson resources, displays, etc, giving more time for the teacher to plan and teach.
Primary teacher
HLTA expertise and confidence enables me to offer additional support, attend meetings, meet with other professionals.
Primary teacher
In Wave 1, the numbers of support staff creating a large increase in workload were very low, and the reasons why this was were unclear. In Wave 2, 28% of teachers reported that the presence of support staff had affected their workload in a negative way. A quarter of teachers explained that some aspects of their workload had increased as a result of having support staff work for them. Approximately half of this group of teachers stated that the reason was due to the increased amount of planning and preparation which was required in order for the support staff to be able to carry out their work; not only was additional planning needed but some teachers found it necessary to plan in much greater detail than was required for their own teaching. For Wave 3, fewer teachers (21%) reported that aspects of their workload had increased as a result of having support staff work for or with them, a high proportion again cited the same reason. The need to communicate these plans also involved extra time and work for teachers.
I have to provide a planning sheet to show the LSA what the SEN pupil needs to do in literacy and numeracy in addition to my planning for the rest of the class.
Need always to find time to communicate. Need to photocopy plans, etc for LSA and ensure they are detailed enough for her to read and understand.
Primary teacher
Sometimes required to explain (in writing) to support staff things I am explaining in class anyway.
Secondary teacher
If the cleaner does not fulfil her duties, I have to ensure that everything is ready for the children: e.g. bin liner in bin, toilet paper in the toilets.
Special school teacher
It is worth noting that a further 4% of comments reported that the time taken up with this extra work was worthwhile in terms of it helping support staff to work more effectively, especially in relation to supporting pupil learning. This is an increase from Wave 2, where just 1% of comments expressed this sentiment.
There is a significant amount of work involved in managing classroom support - but it is worth the time spent.
Primary teacher
Mainly in preparing documentation to support issues or incidents but helps [pupil welfare support staff] to deal with it.
Secondary teacher
A further 2% of comments in Wave 3 revealed how teachers’ responsibilities for managing and monitoring the work support staff had increased their workload.
I have to train support staff to use ICT with PMLD and SLD8 pupils.
Special school teacher
Not all the teachers in Wave 2 felt that support staff had made a difference to their workload (11%), citing various reasons from always having had support staff in the past, to support staff having tasks and roles which did not impinge on the teacher a great deal. For Wave 3, the proportion of teachers reporting this view was 15%. In Wave 2, some teachers (6%) stated that certain aspects of their workload had increased but this was balanced by a decrease in other areas. This proportion was higher in Wave 3 (10%). Time saved by not having to do clerical tasks was taken up with preparing lesson plans for support staff. Other teachers, however, said that their workload had been balanced out by other paperwork and initiatives not linked to support staff.
Less work in preparation but much more time given to communicating with LSA, planning for LSA and pastoral care of LSA.
Primary teacher
The amount of added paperwork during the last few years means any decrease a teaching assistant could have given has not impacted on workload overall.
Primary teacher
Admin support takes away a lot of tasks but teaching and learning work then expands to fill the gap.
Secondary teacher
8
3.1.5 Impact on teacher job satisfaction
[image:29.612.69.437.210.427.2]Teachers were asked to give information on two different types of support staff that they had worked with in the last week. They were asked to describe how the person had affected their job satisfaction, level of stress and workload. Answers were expressed in terms of a five point scale but to simplify results they were combined into three levels: a decrease, no change, and an increase in their job satisfaction. The results for Wave 3 are presented in graphical form in Figures 3.3 and 3.4 and full results are in Appendix 3.
Figure 3.3 - Impact of support staff on teacher job satisfaction (all staff, and by country and school phase) [Wave 3]
Total base figure = 1798. Data from TQ3
Figure 3.4 - Impact of support staff on teacher job satisfaction (by support staff category) [Wave 3]
The results showed that support staff had an overall positive effect on the job satisfaction of teachers at all three waves. About two thirds of teachers at each wave (68%, 65% and 66% for Waves 1, 2 and 3 respectively) said that this member of support staff had led to a slight or large increase in job satisfaction, and only a small percentage at each wave (7%, 5% and 7% for Waves 1, 2 and 3 respectively) said that the support staff had decreased their job satisfaction.
Different categories of support had a varying impact on teachers’ job satisfaction. At each wave TA equivalent staff and technicians were most likely to be associated with an increase in job satisfaction (78%, 74% and 77% for TA equivalent and 69%, 68% and 63% for technicians), with facilities, site, other pupil support, and administrative staff the least likely to have increased job satisfaction (41%, 35%, 38% and 50% respectively at Wave 3). This was not because they caused a decrease in job satisfaction but because they did not lead to any change in job
satisfaction. That administrative staff did not have a higher effect on teacher job satisfaction is a bit surprising given the way they have taken on many of the teachers’ clerical and routine and tasks. It may have something to do with the fact that administrative staff, whilst doing tasks previously handled by the teacher, do not work physically closely with the teacher, and so the handing over of tasks is less visible.
The results suggested little difference overall in job satisfaction between waves when all support staff were considered together, and individual categories of support staff were considered separately.
3.1.6. The impact of support staff on teacher job satisfaction. Answers to open-ended questions
In the Wave 3 TQ teachers were asked to comment on their chosen rating of job satisfaction. The comments were made by 502 teachers and there was a total of 720 coded responses altogether (teachers could give more than one response). Once again in this report we concentrate on the most frequent categories.
Codes discussed below are the four most popular responses which expressed the view that support staff did have an impact on their job satisfaction. Only 12 (2%) of responses indicated that the chosen support staff had not changed their job satisfaction one way or another. We illustrate these responses with quotes9.
The most common category of responses (81 responses; 11% of responses) described ways in which support staff contributed to meeting the needs of all the pupils in the class, such as through more attention, ensuring that particular pupils were supported and that none were overlooked.
I am pleased to be able to support pupils who are likely to make most progress.
Classroom assistant
Through quality support accompanied by constant communication between myself and the HLTA, I can quickly target work at the correct level to the targeted group.
HLTA
I know that speaking and listening needs are being catered for these children with this extra ‘input’.
Bilingual support assistant
9
In this section we give the category of support staff to which the teacher was referring in the quote.
The second most common category of responses described ways in which teachers felt support staff enhanced pupils’ learning and achievement, such as by meeting lesson objectives and learning at a faster pace. There were 58 responses in this category (8% of responses).
Children who were de-motivated because of regular absence now attend and are making progress.
Attendance officer
To see pupils


![Figure 3.1 - Impact of support staff on teacher workload (all staff, and by country and school phase) [Wave 3]](https://thumb-us.123doks.com/thumbv2/123dok_us/169182.45937/26.612.67.437.392.618/figure-impact-support-staff-teacher-workload-country-school.webp)
![Figure 3.3 - Impact of support staff on teacher job satisfaction (all staff, and by country and school phase) [Wave 3]](https://thumb-us.123doks.com/thumbv2/123dok_us/169182.45937/29.612.69.437.210.427/figure-impact-support-staff-teacher-satisfaction-country-school.webp)
![Figure 3.5 - Impact of support staff on teachers’ level of stress (all staff, and by country and school phase) [Wave 3]](https://thumb-us.123doks.com/thumbv2/123dok_us/169182.45937/32.612.70.436.430.648/figure-impact-support-staff-teachers-stress-country-school.webp)
![Figure 3.6 - Impact of support staff on teachers’ level of stress (by support staff category) [Wave 3]](https://thumb-us.123doks.com/thumbv2/123dok_us/169182.45937/33.612.71.439.88.318/figure-impact-support-staff-teachers-stress-support-category.webp)