Accession number: 20103013102347
Title: System dynamics modeling for green IT strategies: SAP sustainability development case
Authors: Su, Ying1 ;Al-Hakim, Latif2
Author affiliation: 1 Information Quality Lab, Institute of Scientific and Technical Information, Beijing, China
2 Faculty of Business, University of Southern Queensland, Queensland, Australia
Corresponding author: Su, Y. ([email protected])
Source title: International Conference on Challenges in Environmental Science and Computer Engineering, CESCE 2010
Abbreviated source title: Int. Conf. Chall. Environ. Sci. Comput. Eng., CESCE Volume: 2
Monograph title: International Conference on Challenges in Environmental Science and Computer Engineering, CESCE 2010
Issue date: 2010 Publication year: 2010
Pages: 504-507 Article number: 5493359
Language: English ISBN-13: 9780769539720
Document type: Conference article (CA)
Conference name: 2010 International Conference on Challenges in Environmental Science and Computer Engineering, CESCE 2010
Conference date: March 6, 2010 - March 7, 2010 Conference location: Wuhan, China
Conference code: 81205
Sponsor: Intelligent Information Technology Application Res. Assoc.; Asia Pacific Environmental Science Research Center; Engineering Technology Press
Publisher: IEEE Computer Society, 445 Hoes Lane - P.O.Box 1331, Piscataway, NJ 08855-1331, United States
Abstract: The paper seeks to investigate, how system dynamics modeling can be supportive for green IT management. The behavior of the green IT management under study is analyzed through a simulation model based on the principles of the system dynamics methodology. The simulation model can be helpful as an experimental tool, which can be used to evaluate Green IT strategies ("what-if" analysis) using total environmental indicators as measure of strategy effectiveness. SAP's sustainability development solutions further illustrate the applicability of the developed methodology, while providing additional intuitively sound insights. © 2010 IEEE.
Number of references: 8
Main heading: Mathematical models
Controlled terms: Computer simulation - Environmental engineering - Information analysis - Information technology - Strategic planning - Sustainable development - System theory
Uncontrolled terms: Development solutions - Environmental indicators - Green IT - Information quality - Simulation model - Strategic management - System Dynamics - System dynamics modeling Classification code: 921 Mathematics - 912.3 Operations Research - 912.2 Management - 911.2 Industrial
Economics - 903.1 Information Sources and Analysis - 961 Systems Science - 903 Information Science - 731.4 System Stability - 723.5 Computer Applications - 461.1 Biomedical Engineering - 454 Environmental Engineering - 901.4 Impact of Technology
Page 1 of 2
Print Records
on Society
DOI: 10.1109/CESCE.2010.244 Database: Compendex
Compilation and indexing terms, © 2010 Elsevier Inc.
© 2010 Elsevier Inc. All rights reserved.
Page 2 of 2
Print Records
System Dynamics Modeling for Green IT Strategies
SAP Sustainability Development Case
Ying Su
Information Quality Lab
Institute of Scientific and Technical Information Beijing, China
E-mail: [email protected]
Latif Al-Hakim
Faculty of Business, University of Southern Queensland,
Queensland, Australia E-mail: [email protected]
Abstract—The paper seeks to investigate, how system dynamics
modeling can be supportive for green IT management. The behavior of the green IT management under study is analyzed through a simulation model based on the principles of the system dynamics methodology. The simulation model can be helpful as an experimental tool, which can be used to evaluate Green IT strategies ("what-if" analysis) using total environmental indicators as measure of strategy effectiveness. SAP's sustainability development solutions further illustrate the applicability of the developed methodology, while providing additional intuitively sound insights.
Keywords- green IT, system dynamics, performance measurement, strategic management, information quality
I. INTRODUCTION
Just as information technology (IT) has contributed significantly to economic growth and quality of life, IT has an important role to play in creating a green economy. Our world is in the midst of a period of digital transformation where every sector, from health care to energy and from transportation to education, is being fundamentally altered and improved by IT. This period of digital transformation not only entails significant benefits from increases in productivity and quality, but it has the potential to create significant environmental benefits. Other nations are aggressively pursuing green technology including South Korea, United States, Japan and Denmark. If China expects to similarly reap these green benefits, it should look to the advanced countries example as they develop their own national green IT strategy.
By bringing together existing contributions on strategic environmental management and performance measurement systems, the present paper aims to develop Dynamics Models for Green IT Management (DMGITM) using super matrix, cause and effect diagrams, tree diagrams, and the analytical network process.
The paper is divided into six major sections. The first section gives taxonomy of green IT strategies and highlights the critical factors of such strategies for a company's operations policy. The second section specifies quantitative model for a Green IT Management (GITM), while the third seeks how to structure critical factors hierarchically to support managers in the implementation of each green IT strategy. The fourth section describes how to quantify the
effect of the factors on a GITM, and the fifth analyses how the suggested DMGITM can be implemented in practice. The final section draws some conclusions from the suggested approach and indicates future directions for further research.
II. LITERATURE REVIEW
The introduction of a green IT strategy is a very complex issue, since it presents a multi-dimensional impact on performance and often induces a significant modification in management procedures. In the light of these issues, it is important to analyze feasible patterns of strategic environmental behavior, under which conditions these are a sustainable option and the implications on operations management.
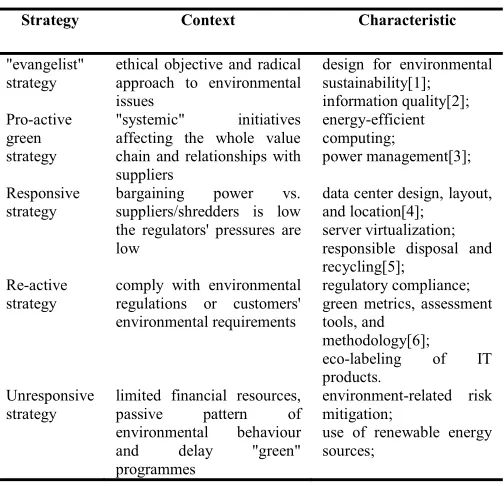
[image:3.612.312.564.424.667.2]In the light of the above issues, we distinguish between (see Tab. 1):
TABLE I. MAIN CHARACTERISTICS OF THE GREEN IT STRATEGIES
Strategy Context Characteristic
"evangelist" strategy
ethical objective and radical approach to environmental issues
design for environmental sustainability[1]; information quality[2]; Pro-active
green strategy
"systemic" initiatives affecting the whole value chain and relationships with suppliers
energy-efficient computing;
power management[3];
Responsive strategy
bargaining power vs. suppliers/shredders is low the regulators' pressures are low
data center design, layout, and location[4];
server virtualization; responsible disposal and recycling[5];
Re-active strategy
comply with environmental regulations or customers' environmental requirements
regulatory compliance; green metrics, assessment tools, and
methodology[6];
eco-labeling of IT products.
Unresponsive
strategy limited financial resources, passive pattern of environmental behaviour and delay "green" programmes
environment-related risk mitigation;
use of renewable energy sources;
to implementation. Strategy implementation has always been discussed as important in system dynamics. However, it is hardly acknowledged that for an effective implementation of results not only organizational decision-makers on top hierarchical levels need to subscribe to new policies and strategies, but also the involvement, motivation and knowledge of organizational members from other levels are necessary and crucial for success. System dynamics models and modeling can also be helpful for this task, not only in actually creating the strategy[8]. This is exactly where this paper is located.
III. SYSTEM DYNAMICS MODELS FOR GREEN IT
MANAGEMENT
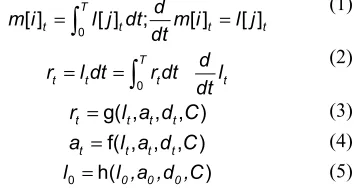
This section is a detailed discussion of the system dynamics modeling, which allows for simple representation of complex Cause-and-Effect Relationships. For the discussion that follows it is important to understand that it is the Levels (or state variables) that define the dynamics of a system. For the mathematically inclined we can introduce this in a more formal way. The following equations show the basic mathematical form of the DMGITM.
=
∫
0 = [ ]t T [ ]t ;d [ ]t [ ]t m i l j dt m i l jdt
(1)
= =
∫
0Tt t t t
d r l dt r dt l
dt
(2)
=g( , , , )
t t t t
r l a d C (3)
=f( , , , )
t t t t
a l a d C (4)
=
0 h(0 0 0 )
l l ,a ,d ,C (5)
In these equations m i[ ]t are measures’ values for
indicators. l j[ ]t are levels (also called accumulations, stocks and states) which change only over time and the values they take on at any time depend on the value they (and other variables) took on at previous times. dtare data (also called exogenous) which have values that change over time but are independent of anything that happens to other variables. at is auxiliary which is computed from Levels, Constants, Data,
and other Auxiliaries. C is the constant, which does not
change with time. g, h, and f are arbitrary, nonlinear, potentially time varying, vector-valued functions. Eq. (1) represents the evolution of the system over time, Eq. (3) the computation of the rates determining that evolution, Eq. (4) the intermediate results necessary to compute the rates, and Eq. (5) the initialization of the system.
IV. RESEARCH OBJECTIVES AND METHODOLOGY The objective of the research adopted under the heading of Dynamics Models for Green IT Management (DMGITM) was to identify tools and techniques that would facilitate:
• Identification of factors affecting Environmental
Performance,
• Identification of the relationship between factors
affecting Environmental Performance,
• Quantification of these relationships on one another,
and on the overall performance of the supply processes, and
• Establishment of 'What if' analysis on process
performance and strategy selection.
[image:4.612.326.548.216.388.2]The six steps of the approach were developed as a result of the DMGITM methodology implementation as depicted in Fig. 1. The details of this approach have been explained through a case study in Section 5.
Identifying strategic performance measures
Describing Supply Processes
Establishing Structure Model
Linkage to IT data Model
Development of control Model Establishing Strategic
Perspectives
Analysis of company business situation Formulation of company strategy, based on the above analysis.
Definition of company objectives in multiple views, including measures, targets, initiatives & tasks.
Describe the supply processes using model of event driven process chains. Using system dynamics model to define the strategic objectives and critical factors. Linkage of DMGITM to IT system enables timely collecting data and tracking of performance.
[image:4.612.92.270.330.424.2]Using simulation technology to forecast Environmental Performance and adjust strategy proactively
Figure. 1 DMGITM Methodology Implementation
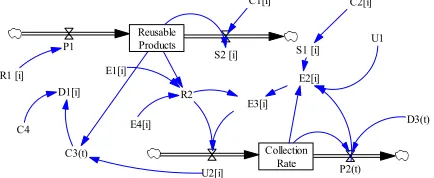
A. Model variables
The Report Parameters in order that they appear in the green IT processes are the following:
• R1[i]: Direct energy consumption [items]. • S1[i]: Indirect energy consumption [items].
• D1[i]: Initiatives to reduce indirect energy
consumption
• E1[i]: Total water withdrawal [items/day]. • E2[i]: Total facilities CO2 emissions [items/day].
• E3[i]: Initiatives to reduce greenhouse gases
[items/day].
Constants, converters are:
• C1[i]: % of employees trained in organization's anti-corruption policies and procedures [items/day]. • C2[i]: % Customer satisfaction [items/day/day].
B. Cause-effect diagram
small italics and the flow variables are written in small plain letters. These variables may be quantitative, such as levels of inventories and capacities, or qualitative, such as failure mechanisms. Reusable Products P1 S2 [i] Collection Rate U2[i] P2(t) R1 [i] D3(t) E2[i] E4[i] U1 S1 [i] C2[i] C1[i] D1[i] C4 C3(t) R2 E3[i] E1[i]
Figure. 2 Cause-effect diagram of the green supplying processes
C. Mathematical formulation
The Equations related to collection green supplying policy are the following:
= DELAYINF( , , 1, )
3 1 1 2
D (t) U a U (6)
(0) = 0
3
C (7)
(t + dt) = (t) + dt ∗ ,
4 4 2
C C R (8)
= DELAYMTR( , 24, 3, 0),
4 2[ ]
C C i (9)
= PULSE( * , 50, ),
1[ ] 4 3 c
C i D C P (10)
= max( * , 0),
2[ ] c 1[ ]
C i K C i (11)
The total profit per period is given from:
= - ,
P R C
T T T (12)
V. ILLUSTRATIVE CASE
SAP is the world's leading provider of business software, offering applications and services that enable companies of all sizes and in more than 25 industries to become best-run businesses. With more than 82,000 customers in over 120 countries, the first SAP Company in China was formally established in 1995. SAP China has set up many branches in Shanghai, Guangzhou, and Dalian. In addition to delivering sustainable business processes through, for example, SAP® Environment, Health, and Safety Management (SAP EHS Management) application brings together four previous products: SAP® Environment, Health & Safety, SAP® Environmental Compliance, SAP® REACH Compliance and Technidata Compliance for Products.
A. Carbon Footprint Reduction Targets
In spite of the fact that SAP’s carbon footprint is usually smaller than that of organizations in other industries with similar revenue, the company is striving for significant reductions. After analyzing its global environmental footprint, SAP announced its commitment to a 51-percent reduction of its total greenhouse gas (GHG) emissions from its year-2007 published baseline levels of 513,000t CO2 by year 2020. This will return SAP to its approximate year-2000
emissions level of 250,000t CO2. SAP initiated its first global GHG inventory in 2008 and will report performance and progress towards the target in its annual sustainability report.
B. Business Travel
[image:5.612.310.564.322.460.2]SAP’s greenhouse gas emissions relate primarily to indirect emissions associated with employee air travel and our European employee car fleet. In Germany, they have taken action this year to decrease their car fleet greenhouse gas emissions by introducing a new standard to reduce average engine performance to European Union (EU) target levels by 2012. SAP also provides subsidized tickets to encourage employees to use public transportation for their commute. In addition, they have invested significantly to upgrade video conferencing facilities, with teleconferencing systems now installed at their global corporate headquarters in Walldorf, Germany; as well as our Paris; Singapore; Newtown Square, Pennsylvania; and Palo Alto, California locations.
TABLE II. MEASURES EXPRESSING ON SAP SUSTAINABILITY ACTIVITIES FOR“GREEN IT”
Classification Measures Description Planned value
Reported measure Economic
Indicators
Idle servers 8 hours 24 hours
Cooling facilities 12 hours 24 hours System Landscape
Optimization
9 hours 2 hours
Environmental Indicators
Water usage 634,251 m³ 807,635 m³
CO2 Metric tons 250,000 406,230
Total business travel CO2 emissions
22 tons 56 tons
Social Indicators
Direct energy consumption
232,000
M.w.h-1 523,000 M.w.h-1
Customer satisfaction 92 89
Total Waste Weight 6,953 tons 10,043 tons
C. Facilities and Energy Management
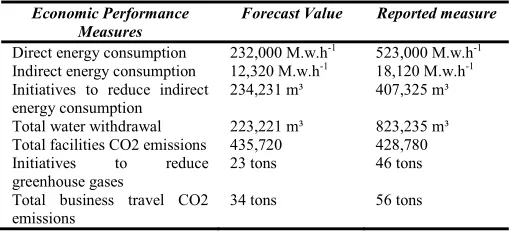
TABLE III. THE ECONOMIC ITEMS AFFECTED BY THE INITIATIVE
Economic Performance Measures
Forecast Value Reported measure
Direct energy consumption 232,000 M.w.h-1 523,000 M.w.h-1
Indirect energy consumption 12,320 M.w.h-1 18,120 M.w.h-1
Initiatives to reduce indirect energy consumption
234,231 m³ 407,325 m³
Total water withdrawal 223,221 m³ 823,235 m³
Total facilities CO2 emissions 435,720 428,780 Initiatives to reduce
greenhouse gases
23 tons 46 tons
Total business travel CO2 emissions
34 tons 56 tons
D. Data Centers
Another considerable portion of their energy consumption (around 40 percent of their total electricity consumption) is due to running data centers that they need in order to run their own operations and to host their customers’ software. Again, they seek to reduce their impact on the environment through innovative approaches: in one of their major data centers in Germany, they introduced a new
technology called “high-density areas.” This new method
of arranging servers reduces the need for air conditioning and thus will decrease related CO2 emissions. Nevertheless, in the near future, they expect the energy use in their data centers and related emissions to increase as their business grows overall and as they especially seek to increase their business with small and midsize companies through their hosted on-demand solutions.
E. Water
SAP’s operations are not water intensive, but, wherever possible, their facilities design and service also make issues into markets and trade. smart use of water. For example, in Walldorf, building run-off water (or grey water) is used for irrigation and toilets. SAP’s total global water usage was 807,635 m³ for 2007.
F. Waste
The total waste weight at SAP globally was 10,043 tons for 2007. They are committed to minimizing waste in our offices, operating facilities, and product packaging. Our current efforts include comprehensive recycling programs for office and catering materials. For example, the energy of leftovers (organic waste) in the Walldorf canteen is recovered in an external fermentation plant. SAP has for some time avoided the use of plastic for their compact disc packing materials, instead using cardboard and paper. When possible, they use paper from certified Forest Stewardship Council sources or recycled paper and packing material.
VI. CONCLUSIONS
The suggested framework is an effective tool for operations managers wishing to design GITMs. The operational guidelines on PMS architecture and the appropriate measurement techniques provide support in devising performance indicators that best suit the intended green IT strategy. An important benefit gained from the DMGITM approach is that the interaction of the factors can be clearly identified and expressed in quantitative terms. This identification will bring us one step forward in understanding the dynamic behavior of factors affecting Environmental Performance.
Moreover, the approach can be used in a "dynamic perspective", i.e. to analyze whether to change the adopted pattern of environmental behavior from a passive/re-active to a pro-active strategic attitude. In operational terms, this implies that a re-active firm has to design a GITM which includes indicators highlighting how the company's economic value may change with the introduction of innovation-based environmental strategies.
ACKNOWLEDGMENT
We would like to thank NNSFC (National Natural Science Foundation of China) for supporting Ying Su with a project (70772021, 70831003) and China Postdoctoral Science Foundation (20060400077).
REFERENCES
[1] C. Chih-Hung, "A Low-Cost Green IT Design and Application of VHSP Based on Virtualization Technology," in Computational Science and Engineering, 2009. CSE '09. International Conference on, 2009, pp. 225-230.
[2] Y. Su, J. Peng, and Z. Jin, "Assuring Information Quality in Sharing Platform for Disaster Management," Journal of Software, vol. 4, pp. 915-924, 2009.
[3] K. Kant, "Toward a Science of Power Management," Computer, vol. 42, pp. 99-101, 2009.
[4] J. S. Aronson, "Making IT a Positive Force in Environmental Change," IT Professional, vol. 10, pp. 43-45, 2008.
[5] R. R. Harmon and N. Auseklis, "Sustainable IT services: Assessing the impact of green computing practices," in Management of Engineering & Technology, 2009. PICMET 2009. Portland International Conference on, 2009, pp. 1707-1717.
[6] N. C. Ciocoiu and C. E. Ciolac, "Automated framework for Green IT classification using software agents," in Computer Science and Information Technology, 2009. ICCSIT 2009. 2nd IEEE International Conference on, 2009, pp. 279-283.
[7] Y. Su and Z. Jin, "System Dynamics Modelling for Strategy Implementation of Service Quality," in The 6th International Conference on Management (ICM 2007), Wuhan, Hubei, China, 2007, pp. 957-962.
[image:6.612.48.303.86.202.2]