Working Paper
Exploring poverty gaps
among children in the UK
Department for Work and Pensions
Working Paper No 103
Exploring poverty gaps among
children in the UK
Karen Gardiner and Martin Evans
© Crown copyright 2011.
You may re-use this information (not including logos) free of charge in any format or medium, under the terms of the Open Government Licence.
To view this licence, visit http://www.nationalarchives.gov.uk/doc/open-government-licence/ or write to the Information Policy Team, The National Archives, Kew, London TW9 4DU, or email: psi@nationalarchives.gsi.gov.uk.
This document/publication is also available on our website at: http://research.dwp.gov.uk/asd/asd5/rrs-index.asp
Any enquiries regarding this document/publication should be sent to us at:
Department for Work and Pensions, Commercial Support and Knowledge Management Team, Upper Ground Floor, Steel City House, West Street, Sheffield S1 2GQ
First published 2011.
ISBN 978 1 908523 12 9
iii
Contents
Contents
Acknowledgements ...v
The Authors ... vi
Abbreviations ... vii
1 Introduction ...1
2 Data and methodology ...4
3 Poverty head counts for UK children ...5
4 Poverty gaps for UK children ... 10
5 Summary and conclusions ... 16
Appendix A Source of information for Figures 3.1 to 3.3 ... 17
Appendix B Source of information for Figures 4.2, 4.4 and 4.5 ... 19
Appendix C Income distribution charts by family/economic status ... 23
Appendix D Income gaps for those above and below the poverty threshold ... 28
List of tables
Table 1
Poverty head count results at the poverty threshold of 60 per cent of median
income before housing costs - for children only by parental economic status
(replicated from 2008/09 HBAI publication Table 4.3 and 4.5) ... 17
Table 2
Poverty head count results at the poverty threshold of 50 per cent of
median income before housing costs – for children only by parental
economic status ... 18
Table 3
Poverty head count results at the poverty threshold of 70 per cent of
median income before housing costs – for children only by parental
economic status ... 18
Table 4a
Poverty gaps for children living in households with incomes above the
poverty threshold of 60 per cent median income, by parental economic
status ... 19
Table 4b
Poverty gaps for children living in households with incomes below the
poverty threshold of 60 per cent of median income, by parental
economic status ... 20
Table 5a
Poverty gaps for children living in households with incomes above the
poverty threshold of 50 per cent median income, by parental economic
status ... 20
iv
Contents
Table 6a
Poverty gaps for children living in households with incomes above
70 per cent of median income, by parental economic status ... 21
Table 6b
Poverty gaps for children living in households with incomes below
70 per cent of median income, by parental economic status ... 22
List of figures
Figure 1.1
How the poverty gaps are calculated ...2
Figure 3.1
Proportion of children living below the 50, 60 and 70 per cent poverty
thresholds by family/economic group ...6
Figure 3.2
Proportion of all children by family/economic groups ...8
Figure 3.3
Proportions of poor children by family/economic group ...9
Figure 4.1
Interpreting the poverty gaps box plots ... 10
Figure 4.2
Poverty gaps for children with incomes below the poverty line (60 per cent
median income before housing costs), by economic status ... 11
Figure 4.3
Income distribution for couple with children, both working, one or more
full time ... 13
Figure 4.4
Poverty gaps for children with incomes below the poverty threshold
(50 per cent median income before housing costs), by economic status ... 14
Figure 4.5
Poverty gaps for children with incomes below the poverty threshold
(70 per cent median income before housing costs), by economic status ... 15
Figure C.1
Lone parent in full-time work ... 23
Figure C.2
Lone parent in part-time work ... 24
Figure C.3
Lone parent not working ... 24
Figure C.4
Couple with children, self employed ... 25
Figure C.5
Couple with children, both working, one or more full-time ... 25
Figure C.6
Couple with children, one in full-time work, one not working ... 26
Figure C.7
Couple with children, one or more in part-time work only ... 26
Figure C.8
Couple with children, both not in work ... 27
Figure D.1 Poverty gaps for children with incomes above and below the poverty
line (60 per cent median income before housing costs), by economic
status (Figure 4.2) ... 29
Figure D.2 Poverty gaps for children with incomes above and below the poverty
threshold (50 per cent median income before housing costs), by
economic status (Figure 4.4) ... 30
v
Acknowledgements
Acknowledgements
vi
The Authors
The Authors
Karen Gardiner is an independent consultant at Karen Gardiner Ltd (Company No. 7183685) and
specialises in economic research and data analysis.
vii
Abbreviations
Abbreviations
DWP Department for Work and Pensions
FRS Family Resources Survey
HBAI Households Below Average Income
HMSO Her Majesty’s Stationery Office
1
Introduction
1 Introduction
The purpose of this paper is to use poverty gap analysis to explore the depth of poverty experienced by children of low-income families in the UK. Measures set out in the Child Poverty Act1 and in the
National Child Poverty Strategy2 are based on poverty headcounts, i.e. you are either below or above
a certain poverty threshold. The most commonly used measure is the 60 per cent relative poverty measure, defined as individuals living in households with incomes below 60 per cent of the median income. The National Strategy, published in April 2011, introduces a new measure on severe poverty, defined as individuals living in households experiencing material deprivation and with incomes below 50 per cent of the median income.
The head count does not distinguish between those with incomes just below the poverty line and those deeper in poverty. Policies which improve incomes for those at the bottom of the income distribution will not lead to a fall in measured income poverty, unless incomes are raised sufficiently to cross the chosen poverty threshold, and yet reducing these families’ depth of poverty is highly likely to improve living standards.
This paper supplements the headcount measures with analysis of the ‘poverty gap’ for UK children. The poverty gap measures ‘How poor are the poor’ i.e. the extent of poverty for those who are below the relative poverty threshold. With this measure, an improvement in incomes for those in poverty which is not sufficient for them to escape poverty, is nevertheless captured as a drop in measured poverty. In practice, for each poor individual we measure the poverty gap by calculating the shortfall in their income from the poverty line, and expressing this as a percentage of the poverty line. For example, if the poverty line was 100 and the income was 25 then the poverty gap would be 75 per cent (100 minus 25 equals 75; 75 divided by 100 is 75 per cent). A poverty gap of 75 per cent can be interpreted as an income that is 75 per cent below the poverty line. Figure 1.1 shows how poverty gaps are calculated.
1
http://www.education.gov.uk/childrenandyoungpeople/families/childpoverty/a0066302/the-child-poverty-act
2 http://www.education.gov.uk/childrenandyoungpeople/strategy/laupdates/a0076802/
2
Introduction
Figure 1.1 How the poverty gaps are calculated
Although the ‘poverty gap’ is well-established in the literature on poverty measurement (see for example, Haughton and Khandker, 20093), it is relatively uncommon to see empirical results for
poverty calculated in this way. The main reason for this is that estimates of the poverty gap are much more sensitive to data quality than other poverty indicators, such as the head count. For example, under-reporting of income in the survey data will affect the poverty gap results. If there is a general issue of under-reporting across all the population groups examined, then this brings in to question the results on the size of the poverty gap, but not necessarily the ‘pattern’ or relative differences between groups. If, however, we suspect systematic bias in the under-reporting of incomes, with this being more prevalent for some groups than for others, then this also undermines the findings for the relative differences in poverty gaps between the groups4.
The other limitation of poverty gap analysis is that it can increase if those poor individuals with incomes close to the poverty line escape poverty: the average poverty gap among those remaining in poverty is now higher. It is, therefore, important that we examine the poverty gap results in conjunction with the head count results – it allows us to assess the size of the group as well as the depth of the poverty among the group.
3 Haughton, J. and Khandker, S.R. (2009) Handbook on Poverty Inequality, World Bank, page 70. 4 There is evidence that under-reporting of income is an issue for the data used in this paper,
which are the Family Resources Survey (FRS) and Households Below Average Income (HBAI) datasets. See for example, Table M.6 of the 2008/09 FRS publication at http://research.dwp. gov.uk/asd/frs/2008_09/index.php?page=intro. 0.0 0.1 0.2 0.3 0.4 0.5
0 50 100 150 200 250 300 350 400 450 500
N um be r o f c hi ld re n (m ill io ns )
£244 pw = 0% poverty gap
60 p er c en t m ed ia n = £2 44 pw
£122 pw = 50% poverty gap
Equivalised household income (in £10 per week bands) £61 pw = 75% poverty gap
Threshold = £244 pw
Difference = £244 - £61 = £183 pw Difference as a % of threshold = 75%
3
Introduction
While the results presented here are not part of the Government’s official monitoring and evaluation of the aim to eliminate child poverty, as expressed in the National Child Poverty Strategy titled: A new Approach to Tackling Child Poverty: Tackling the Causes of Disadvantage and Transforming Families’ Lives, they can contribute to understanding the driving forces behind low incomes, and to the design of effective policies to alleviate poverty. The first National Child Poverty Strategy, published in April 20115, outlines how the Coalition Government intends to improve the life chances
of children and to protect vulnerable families. Looking at poverty gaps can, in addition to other measures, provide a data-driven approach to better understand which children in the UK are likely to be among the poorest and most likely to be in need of support.
4
Data and methodology
2 Data and methodology
The data presented in this paper are based on 2008/09 analyses of the raw data underlying the Government’s official low income statistics, ‘Households Below Average Income’ (HBAI). HBAI reports are based on the Family Resources Survey (FRS), but with a number of important adjustments (see DWP (2010) for details6). To these adjusted HBAI data (supplemented with some
variables from the FRS 2008/09) we apply the HBAI methodology to produce new poverty results, which are consistent with those presented in the HBAI reports7. In particular, we follow the HBAI
report in defining poverty lines of 50 per cent, 60 per cent and 70 per cent of median disposable household income for the UK population. The other key elements of this approach is that income is adjusted for household size and composition, using the modified Organisation for Economic Cooperation and Development (OECD) equivalence scale; results are ‘weighted’ to make them representative of the UK population; and adjustments have been made to the highest incomes using information from the Survey of Personal Incomes8. Also, in common with the HBAI approach,
we assume that all the members of a household benefit equally from total disposable household income and, therefore, that equivalised household income is a suitable proxy for the standard of living of each individual. In addition, all figures in the paper are before housing costs. For more details on definitions and methodology, please refer to the latest HBAI report.
6 Department for Work and Pensions (DWP) (2010) Households Below Average Income: An
analysis of the income distribution 1994/5 – 2008/09 http://research.dwp.gov.uk/asd/index. php?page=hbai_arc
7 Department for Work and Pensions, Households Below Average Income, 1994/95-2008/09. 4th
Edition. Colchester, Essex: UK Data Archive [distributor], July 2010. SN: 5828. Department for Work and Pensions, National Centre for Social Research and Office for National Statistics (Social and Vital Statistics Division), Family Resources Survey, 2008-2009. Colchester, Essex: UK Data Archive [distributor], August 2010. SN: 6523.
We gratefully acknowledge the Department for Work and Pensions, National Centre for Social Research and Office for National Statistics (Social and Vital Statistics Division) for creating and depositing these data, and the UK Data Archive for their distribution. Crown copyright material is reproduced with the kind permission of the Controller of Her Majesty’s Stationery Office (HMSO) and the Queen’s Printer for Scotland. The original data creators, depositors, copyright holders and the UK Data Archive bear no responsibility for the analysis or interpretation of these data.
8 We use the publicly-available ‘end user licence’ version of the HBAI data, which differs in one
5
Poverty head counts for UK children
3 Poverty head counts for UK
children
In order to understand the poverty rates for UK children, we first need to remind ourselves of the results for the whole population to provide some context. The overall poverty rate9 shows us that
18 per cent of all individuals are poor when poverty is defined as incomes below 60 per cent of the median before housing costs (which is the relative poverty measured defined in the Child Poverty Act), and that children are more likely to be poor than the population as a whole – 22 per cent instead of 18 per cent (2008/09).
Head count results for children only based on poverty thresholds of 50 per cent, 60 per cent and 70 per cent of median income are presented Figure 3.1. Parents’ economic status is an important predictor of poverty among children, so the breakdown used in Figure 3.110 is a combination of the
child’s family type and the economic status of the adults in each child’s family.
9 Here we draw on figures provided in Table 3.3 and 3.5 of the 2008/09 HBAI report.
10 Here we replicate information shown in Tables 4.3 and 4.5 of the 2008/09 HBAI report. We use
6
Poverty head counts for UK children
Figure 3.1 Proportion of children living below the 50, 60 and 70 per cent poverty
thresholds by family/economic group
11It demonstrates that, at the 60 per cent poverty threshold, children living in a workless couple family are most likely to live below the poverty line (64 per cent), followed by workless lone parent families (54 per cent) and couple families where one or more are in part-time work (53 per cent). Children least likely to be in poverty are those living in couple families where both are in work (3 per cent). We also see here that the poverty risk for children in couple families varies much more dramatically by economic status than for children in lone parent families. Poverty rates are about four times higher for children in lone parent families when the adult does not work compared to when the adult is in full-time work. For children in couple families this rises to a staggering 20 times higher poverty risk when adults are not working compared to when they both are (with at least one full-time). This means that children in couple families with the most advantageous economic status (all adults working, at least one full–time) fare much better than their counterparts in single parent families (a poverty rate of 3 per cent compared with 12 per cent). In contrast, children in couple
11 Figure 3.1 replicates HBAI poverty head count results (50, 60 and 70 percent of median income
before housing costs) – for children only by family type and economic status. The data used to produce figures 1.1 – 4.5 can be found in tables 1 – 6 in the annex.
0 10 20 30 40 50 60 70 80
Economic status and family type
Percentage of children in poverty (%)
Lone parent in full-time work Lone parent in part-time work Lone parent not working Couple with children, self-employed Couple with children, both working, one or more full-time Couple with children, one in full-time one not working Couple with children, one or more in part-time work Couple with children, both not working 50% median income 60% median income 70% median income
7
Poverty head counts for UK children
families with the worst economic status (both not working) are at greater risk of poverty than the equivalent children in workless lone parent families (64 per cent compared with 54 per cent)12.
To check whether the headcount findings are robust across different poverty thresholds, Figure 3.1 also demonstrates poverty rates at 50 per cent and 70 per cent. As expected, if we vary the poverty threshold the proportion of children in poverty changes, i.e. for a 70 per cent poverty line the proportion of children in poverty increases and for a 50 per cent poverty line it decreases, but the relative differences or ranking of groups is broadly consistent with a 60 per cent poverty line. This is particularly interesting when looking at poverty gaps analysis in Chapter 4, where changes to the poverty line lead to surprising outcomes.
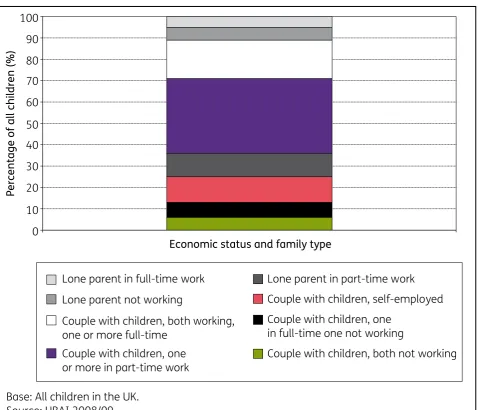
Looking at the proportion of children living in poverty by family type and economic status doesn’t tell us the whole picture as it doesn’t reflect the relative sizes of the groups. For example, the proportion of children living in poverty in a couple family where both are working is relatively very low at 3 per cent (Figure 3.1). However, the relative size of this group is large with 35 per cent of all children living in families where both parents work (Figure 3.2). Children from workless couple families, however, are much more likely to live in poverty at 64 per cent (Figure 3.1), while their relative population size is small, only 5 per cent of all children live in this type of family (Figure 3.2).
12 A possible reason for the disparity between lone parent and couple families mentioned above
8
Poverty head counts for UK children
Figure 3.2 Proportion of all children by family/economic groups
This is important to understand from a policy perspective as policy makers will need to strike a balance between supporting larger groups with relatively lower poverty rates and investing in more targeted interventions that support the relative small groups experiencing the deepest levels of poverty. Figure 3.3, illustrates this by providing the proportions of children living in poverty by group. It demonstrates that among all poor children just under a third live in a workless lone parent family, 16 per cent live in a couple family where one person works full time and 16 per cent live in workless couple families. In contrast, among the population of children living in poverty, only 3 per cent live with a lone parent family who works full time.
0 10 20 30 40 50 60 70 80 90 100
Economic status and family type
Percentage of all children (%)
Lone parent in full-time work Lone parent in part-time work Lone parent not working Couple with children, self-employed Couple with children, both working,
one or more full-time
Couple with children, one in full-time one not working Couple with children, one
or more in part-time work Couple with children, both not working
9
Poverty gaps for UK children
Figure 3.3 Proportions of poor children by family/economic group
13Figure 3.3 demonstrates how the proportions in poverty vary when you change the ‘poverty threshold’ from 50 to 60 to 70 per cent. The most commonly used line is 60 per cent of median income before housing costs, but changing the threshold does give different results and allows us to assess how sensitive the findings are to where the poverty threshold is set. When we use the lower income cut-off of 50 per cent median income, the child poverty rate falls by a half – from 22 per cent to 11 per cent, which tells us that many low-income families have incomes just below the 60 per cent median poverty line. Across the eight economic status groups, we find that measured poverty falls as the threshold is reduced.
Comparing the 70 per cent poverty threshold with the 50 per cent and 60 per cent thresholds demonstrates two things. Firstly, child poverty rates vary considerably more by parents’ work status than by family type and secondly, the risk of poverty for children in couple families varies more dramatically by economic status than for children in lone parent families.
13 Figures 3.1 and 3.3 and Tables 1, 2 and 3 in Appendix A replicate results from Tables 4.3 and
4.5 of the 2008/09 HBAI report. As described for Figure 3.1, two of the ‘child’s economic status’ groups shown there have been combined in our results to avoid small sample sizes.
0 10 20 30 40 50 60 70 80 90 100
Percentage of all children in poverty (%)
Lone parent in full-time work Lone parent in part-time work Lone parent not working Couple with children, self-employed Couple with children, both working,
one or more full-time Couple with children, one in full-time one not working Couple with children, one
or more in part-time work Couple with children, both not working
Base: All children in the UK. Source: HBAI 2008/09.
10
Poverty gaps for UK children
4 Poverty gaps for UK children
[image:18.595.54.533.226.543.2]In this section we explore a different measure of poverty for children – the poverty gap. Rather than focusing on poverty rates, this tells us about the depth of poverty for those whose incomes are below a particular poverty threshold. The poverty gaps are displayed using box plots and Figure 4.1 demonstrates how to interpret these.
Figure 4.1 Interpreting the poverty gaps box plots
The figure includes four summary measures of the poverty gaps – the median, mean, 25th percentile and 75th percentile. Thus we can gain an insight into how average poverty gaps vary across the groups (from the median and mean), and also whether there is a lot of variation between those with the smallest income shortfalls (at the 25th percentile) and those with the largest poverty gaps (at the 75th percentile) for each group. The 0 line at the top is the chosen poverty line. The box represents the distance between the 25th and 75th percentile (the former being nearer to the poverty line) and the line inside the box is the median. The cross represents the mean.
Figure 4.2 presents information on poverty gaps for poor children for a poverty line of 60 per cent median income before housing costs, broken down by the same measure of the family’s economic status used in Chapter 3.
0 5 10 15 20 25 30 35 40 45
1
Poverty line
25th percentile - 25% of children below the poverty line have a poverty gap of 8% or less
Median - 50% of children below the poverty line have a poverty gap of 15% or less
Mean - The mean poverty gap for a child below the
11
Poverty gaps for UK children
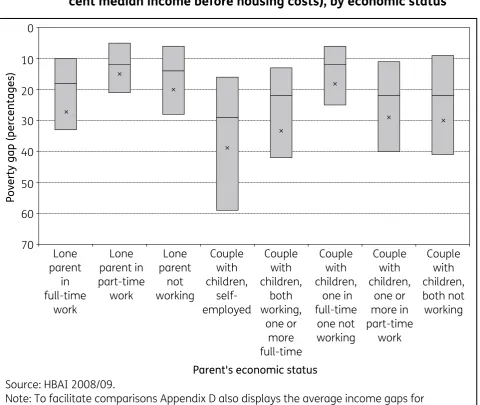
Figure 4.2 Poverty gaps for children with incomes below the poverty line (60 per
cent median income before housing costs), by economic status
The most significant thing to notice is that the results in Figure 4.2 imply a very different picture of poverty from Chapter 3, in terms of which groups do better or worse. In Chapter 3 we saw that the factor which most protected children from being poor was having both parents in work (with at least one full-time). However, when we look at Figure 4.2 this is no longer the case when considering the depth of poverty. The children with the smallest median poverty gap of those below the poverty line come from families with single-earner couples (12 per cent) and lone parent families in part-time work (12 per cent).
Children living furthest below the poverty line, with a median poverty gap of around 25 per cent, include those with self-employed parents (29 per cent), workless couple parents (22 per cent), couple parents where one or more work part time (22 per cent) and couple parents who both work with at least one full time (22 per cent).
Having such relatively large poverty gaps for those below the poverty line, for children where both parents work is surprising and counter intuitive, so we will explore this further.
The large poverty gap among children with self-employed parents can be explained by the difficulties in collecting information about income for the self-employed. A proportion of this
0 10 20 30 40 50 60 70
Parent's economic status
Poverty gap (percentages)
Lone parent in full-time work Lone parent in part-time work Lone parent not working Couple with children, self-employed Couple with children, both working, one or more full-time Couple with children, one in full-time one not working Couple with children, one or more in part-time work Couple with children, both not working
Source: HBAI 2008/09.
12
Poverty gaps for UK children
group are believed to report incomes that do not reflect their living standards and there are also recognised difficulties in obtaining timely and accurate income information from this group. Previous analysis of the level of material deprivation reported by those self-employed and reporting incomes among the lowest 20 per cent of incomes suggests that the link between lower incomes and higher levels of material deprivation is much weaker than it is for the population a whole. This means that income data from surveys is less likely to accurately capture the income of people whose salary fluctuates over time (for example, self-employed).
For those below the poverty line, the large poverty gap experienced by children in couple families where both work, with at least one full-time (22 per cent), is more difficult to explain. There are a range of possible explanations, including data issues similar to those found with the self employed, but also issues around benefit take-up and income distributions. For example, low-income
couple families are less likely to have contact with the benefits system. Take up rates (2008/09) demonstrate that estimated take up rates among couple families is 73 per cent, compared with 95 per cent among lone parent families14. While the benefits system does not guarantee to provide an
income above the poverty line, it does act as a safety net which protects against very low incomes. Although these full-time working families on very low incomes would be highly likely to be eligible for Working Tax Credit if they meet residency requirements, perhaps they are not well-informed and have failed to claim benefits for which they are eligible (thereby slipping through the safety net)15, or
do not wish to engage with the benefits system.
Another explanation relates to the income distribution and size of this group. Figure 4.3
demonstrates the income distribution of children living in working couple families (with at least one full time) is skewed. It shows that the vast majority of working couple families live above the poverty line, and that poor families with children where all parents work (with at least one full time) are a very small group in terms of the number of observations in the raw data (see Appendix A,
Table 1). The relatively small size of this population means that these types of families are unusual or atypical.16
Appendix C, displays the income distributions for the other family/economic groups, and
demonstrates that the size of the population living below the poverty thresholds tends to be higher. For, example, the income distribution of children living in a workless lone parent household shows that the 60 per cent poverty threshold roughly splits the population in half and accounts for a much higher number of observations in the raw data (see Appendix C).
14 See Table 6 in HMRC publication on Child Benefit, Child Tax Credit and Working Tax Credit
Take-up rates, http://www.hmrc.gov.uk/stats/personal-tax-credits/cwtc-take-up2008-09.pdf
15 The non-reporting of benefits and tax credits could be an issue here. Take up rates are lower in
the Family Resources Survey than in administrative data so some families might be receiving Working Tax Credits and not report it.
16 Recent DWP research explored the living standards of low-income families see, for example,
13
Poverty gaps for UK children
Figure 4.3 Income distribution for couple with children, both working, one or
more full time
To explore this further, in Figures 4.4 and 4.5 we recalculate poverty gaps on the basis of two
alternative poverty thresholds (50 per cent and 70 per cent median) to explore whether this has any significant impact on the findings for which groups of poor people experience deeper poverty, as measured by the shortfall in income from the poverty threshold. The key implication of the results in Figures 4.4 and 4.5 is that our findings for which groups of children have the largest poverty gaps depend very much on exactly where we draw the poverty threshold in the income distribution. In particular, we find that children in couple families whose parents both work, with at least one full time, have the lowest median poverty gap when the threshold is defined as 70 per cent median income (see Figure 4.5), in stark contrast with the results from Figure 4.2. Note that their precise ranking among the groups does, however, vary quite a lot depending on whether we look at the mean, median, 25th or 75th percentile.
In Figure 4.4, there are some restrictions on the figures we present, due to the smaller sample sizes which result from lowering the income cut-off to 50 per cent median income. Hence, the poverty gap picture is only partial for those below the poverty line. But the poverty gap calculations we have present a more expected result for children from couple families: poverty is deeper the less engaged parents are with the labour market.
14
Figure 4.4 Poverty gaps for children with incomes below the poverty threshold
(50 per cent median income before housing costs), by economic
status
Poverty gaps for UK children
0 10 20 30 40 50 60 70
Parent's economic status
Poverty gap (percentages)
Lone parent in full-time work Lone parent in part-time work Lone parent not working Couple with children, self-employed Couple with children, both working, one or more full-time Couple with children, one in full-time one not working Couple with children, one or more in part-time work Couple with children, both not working
Source: HBAI 2008/09.
15
Figure 4.5 Poverty gaps for children with incomes below the poverty threshold
(70 per cent median income before housing costs), by economic
status
More generally, the overall ranking of groups according to the median poverty gaps in Figure 4.5 is reasonably consistent with the rankings implied by the head count results in Chapter 3: the groups with the lowest risk of poverty also experience the least severe income shortfalls when poor. This is reassuring as it suggests that a policy focus on those at greatest risk of poverty would also benefit those at risk of the deepest poverty.
0 10 20 30 40 50 60 70
Parent's economic status
Poverty gap (percentages)
Lone parent in full-time work Lone parent in part-time work Lone parent not working Couple with children, self-employed Couple with children, both working, one or more full-time Couple with children, one in full-time one not working Couple with children, one or more in part-time work Couple with children, both not working
Source: HBAI 2008/09.
Note: To facilitate comparisons Appendix D also displays the average income gaps for children living in households with incomes above the poverty thresholds.
16
5 Summary and conclusions
This analysis has presented poverty results for UK children for two key indicators of poverty: the head count, which captures poverty risk; and the poverty gap which represents the severity of poverty among the poor.
We calculate both poverty measures for three different poverty thresholds; 50 per cent, 60 per cent and 70 per cent of median income. We find that the results for the poverty head count are very robust, regardless of the choice of poverty threshold. Parents’ attachment to the labour market appears to be the key factor which protects children against low income.
The message from the poverty gap figures is much less clear cut, with the relative differences between groups for the depth of poverty depending on exactly where in the income distribution the poverty threshold is drawn, and which summary measure of poverty gaps we focus on.
Overall, the main conclusion from this analysis is the importance of looking at different dimensions of poverty, rather than just focusing on the head count measure. As well as asking, ‘Who is poor?’, we should also be interested in ‘How poor are the poor?’. Our initial findings for the depth of poverty among UK children suggest that further detailed work needs to be done to fully understand which factors are linked to the severity of poverty.
17
Appendix A
Source of information for Figures
3.1 to 3.3
[image:25.595.55.546.351.595.2]Figures 3.1 to 3.3 are based on 2008/09 Households Below Average
Income (HBAI) data, UK
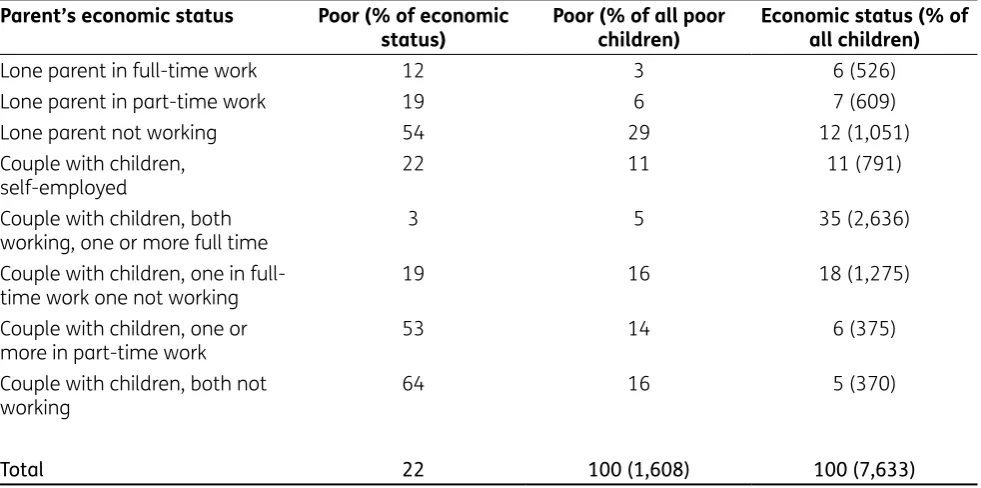
Table 1
Poverty head count results at the poverty threshold of 60 per cent of
median income before housing costs - for children only by parental
economic status (replicated from 2008/09 HBAI publication Table 4.3
and 4.5)
Parent’s economic status Poor (% of economic
status) Poor (% of all poor children) Economic status (% of all children)
Lone parent in full-time work 12 3 6 (526)
Lone parent in part-time work 19 6 7 (609)
Lone parent not working 54 29 12 (1,051)
Couple with children,
self-employed 22 11 11 (791)
Couple with children, both
working, one or more full time 3 5 35 (2,636)
Couple with children, one in
full-time work one not working 19 16 18 (1,275)
Couple with children, one or
more in part-time work 53 14 6 (375)
Couple with children, both not
working 64 16 5 (370)
Total 22 100 (1,608) 100 (7,633)
Samples sizes in brackets are the number of benefit units. A benefit unit is defined as an adult plus any spouse/ partner and dependent children.
18
Table 2
Poverty head count results at the poverty threshold of 50 per cent of
median income before housing costs – for children only by parental
economic status
Parent’s economic status Poor (% of economic
status) Poor (% of all poor children) Economic status (% of all children)
Lone parent in full-time work 7 3 6 (526)
Lone parent in part-time work 7 4 7 (609)
Lone parent not working 23 24 12 (1,051)
Couple with children,
self-employed 16 16 11 (791)
Couple with children, both
working, one or more full time 2 6 35 (2,636)
Couple with children, one in
full-time work one not working 7 11 18 (1,275)
Couple with children, one or
more in part-time work 32 16 6 (375)
Couple with children, both not
working 39 19 5 (370)
Total 11 100 (826) 100 (7,633)
Samples sizes in brackets (number of benefit units).
Table 3
Poverty head count results at the poverty threshold of 70 per cent of
median income before housing costs – for children only by parental
economic status
Parent’s economic status Poor (% of economic
status) Poor (% of all poor children) Economic status (% of all children)
Lone parent in full-time work 20 4 6 (526)
Lone parent in part-time work 35 7 7 (609)
Lone parent not working 73 27 12 (1,051)
Couple with children,
self-employed 32 11 11 (791)
Couple with children, both
working, one or more full time 7 7 35 (2,636)
Couple with children, one in
full-time work one not working 33 19 18 (1,275)
Couple with children, one or
more in part-time work 65 12 6 (375)
Couple with children, both not
working 78 13 5 (370)
Total 32 100 (2,379) 100 (7,633)
Samples sizes in brackets (number of benefit units).
[image:26.595.53.545.489.731.2]19
Appendix B
Source of information for Figures
4.2, 4.4 and 4.5
Figures 4.2, 4.4 and 4.5 are based on 2008/09 Households Below
Average Income (HBAI) data, UK
Table 4a Poverty gaps for children living in households with incomes above
the poverty threshold of 60 per cent median income, by parental
economic status
Parent’s economic status Median poverty gap (%)
Mean poverty gap
(%)
25th percentile poverty gap
(%)
75th percentile poverty gap
(%)
Sample size
Lone parent in full-time work 67 99 34 113 475
Lone parent in part-time work 37 52 21 63 501
Lone parent not working 21 36 8 45 470
Couple with children,
self-employed 78 178 35 160 625
Couple with children, both working, one or more full-time
104 141 61 167 2,566
Couple with children, one in full-time work one not working
59 118 24 116 1,053
Couple with children, one or
more in part-time work 33 73 16 69 194
Couple with children, both not
working 21 33 10 44 142
[image:27.595.52.547.333.585.2]20
Table 4b Poverty gaps for children living in households with incomes below
the poverty threshold of 60 per cent of median income, by parental
economic status
Parent’s economic status Median
poverty gap (%) Mean poverty gap (%) 25th percentile poverty gap (%) 75th percentile poverty gap (%) Sample size
Lone parent in full-time work 18 27 10 33 51
Lone parent in part-time work 12 15 5 21 108
Lone parent not working 14 20 6 28 581
Couple with children,
self-employed 29 39 16 59 167
Couple with children, both
working, one or more full time 22 34 13 42 70
Couple with children, one in full-time work one not working
12 18 6 25 222
Couple with children, one or
more in part-time work 22 29 11 40 181
Couple with children, both not
working 22 30 9 41 228
All poor children 17 26 8 37 1,608
Results based on a sample of less than 100 are shown in italics to indicate that they should be interpreted with caution.
Table 5a Poverty gaps for children living in households with incomes above
the poverty threshold of 50 per cent median income, by parental
economic status
Parent’s economic status Median
poverty gap (%) Mean poverty gap (%) 25th percentile poverty gap (%) 75th percentile poverty gap (%) Sample size
Lone parent in full-time work 98 131 56 152 496
Lone parent in part-time work 58 73 34 90 568
Lone parent not working 26 42 13 51 801
Couple with children,
self-employed 103 218 48 198 668
Couple with children, both
working, one or more full time 144 187 91 219 2,592
Couple with children, one in full-time work one not working
75 143 35 144 1,190
Couple with children, one or
more in part-time work 41 77 15 79 268
Couple with children, both not
working 29 40 12 54 226
[image:28.595.57.546.149.411.2] [image:28.595.55.544.520.769.2]21
Table 5b Poverty gaps for children living in households with incomes below
the poverty threshold of 50 per cent of median income, by parental
economic status
Parent’s economic status Median
poverty gap (%) Mean poverty gap (%) 25th percentile poverty gap (%) 75th percentile poverty gap (%) Sample size
Lone parent in full-time work * * * * 30
Lone parent in part-time work * * * * 41
Lone parent not working 16 26 8 34 250
Couple with children,
self-employed 34 42 14 63 124
Couple with children, both working, one or more full time
* * * * 44
Couple with children, one in full-time work one not working
20 24 7 29 85
Couple with children, one or
more in part-time work 23 30 9 47 107
Couple with children, both not
working 27 32 9 47 145
All poor children 22 31 8 44 826
Results based on a sample of less than 100 are shown in italics to indicate that they should be interpreted with caution. * Results omitted from table where sample sizes below 50.
Table 6a Poverty gaps for children living in households with incomes above 70
per cent of median income, by parental economic status
Parent’s economic status Median
poverty gap (%) Mean poverty gap (%) 25th percentile poverty gap (%) 75th percentile poverty gap (%) Sample size
Lone parent in full-time work 20 25 7 33 87
Lone parent in part-time work 16 18 7 26 216
Lone parent not working 21 26 14 32 774
Couple with children,
self-employed 28 35 11 53 241
Couple with children, both working, one or more full time
13 24 6 33 158
Couple with children, one in full-time work one not working
16 20 8 26 387
Couple with children, one or
more in part-time work 28 33 18 45 230
Couple with children, both
not working 29 34 18 48 286
All poor children 22 27 11 35 2,379
Results based on a sample of less than 100 are shown in italics to indicate that they should be interpreted with caution.
[image:29.595.53.547.147.423.2] [image:29.595.50.545.518.793.2]22
Table 6b Poverty gaps for children living in households with incomes below 70
per cent of median income, by parental economic status
Parent’s economic status Median
poverty gap (%)
Mean poverty gap
(%)
25th percentile poverty gap
(%)
75th percentile poverty gap
(%)
Sample size
Lone parent in full-time work 48 78 22 85 439
Lone parent in part-time work 25 40 12 47 393
Lone parent not working 19 35 7 40 277
Couple with children,
self-employed 66 160 28 139 551
Couple with children, both working, one or more full time
78 111 41 132 2,478
Couple with children, one in full-time work one not working
47 106 20 104 888
Couple with children, one or
more in part-time work 28 68 10 67 145
Couple with children, both
not working 19 28 7 40 84
Results based on a sample of less than 100 are shown in italics to indicate that they should be interpreted with caution.
[image:30.595.54.544.135.393.2]23
Appendix C
Income distribution charts by
family/economic status
The following charts show the income distributions for the different family and economic status’ of all children. If the graph skews to the left this shows that this group is more inclined towards a lower income and if to the right then this shows higher incomes. The frequency is the number of children in families at a particular income level and as some groups are much larger than others these numbers are different on each chart.
[image:31.595.52.545.406.691.2]Income distribution graphs by family type and economic status,
showing 50 per cent, 60 per cent and 70 per cent median income
lines.
Figure C.1 Lone parent in full-time work
24
[image:32.595.52.544.436.745.2]Figure C.2 Lone parent in part-time work
Figure C.3 Lone parent not working
25
Figure C.4 Couple with children, self-employed
Figure C.5 Couple with children, both working, one or more full time
[image:33.595.52.543.458.744.2]26
[image:34.595.52.551.447.742.2]Figure C.6 Couple with children, one in full-time work, one not working
Figure C.7 Couple with children, one or more in part-time work only
27
Figure C.8 Couple with children, both not in work
28
Appendix D
Income gaps for those above
and below the poverty threshold
29
Figure D.1 Poverty gaps for children with incomes above and below the poverty
line (60 per cent median income before housing costs), by economic
status (Figure 4.2)
Income gaps for those above and below the poverty threshold
0 10 20 30 40 50 60 70
Parent's economic status
Poverty gap (percentages)
Lone parent in full-time work Lone parent in part-time work Lone parent not working Couple with children, self-employed Couple with children, both working, one or more full-time Couple with children, one in full-time one not working Couple with children, one or more in part-time work Couple with children, both not working
Source: HBAI 2008/09. 350 300 250 200 150 100 50 0
Parent's economic status
Poverty gap (percentages)
30
Figure D.2 Poverty gaps for children with incomes above and below the poverty
threshold (50 per cent median income before housing costs), by
economic status (Figure 4.4)
Income gaps for those above and below the poverty threshold
0 10 20 30 40 50 60 70
Parent's economic status
Poverty gap (percentages)
Lone parent in full-time work Lone parent in part-time work Lone parent not working Couple with children, self-employed Couple with children, both working, one or more full-time Couple with children, one in full-time one not working Couple with children, one or more in part-time work Couple with children, both not working
Source: HBAI 2008/09.
Parent's economic status
Poverty gap (percentages)
31
Figure D.3 Poverty gaps for children with incomes above and below the poverty
threshold (70 per cent median income before housing costs), by
economic status (Figure 4.5)
Income gaps for those above and below the poverty threshold
0 10 20 30 40 50 60 70
Parent's economic status
Poverty gap (percentages)
Lone parent in full-time work Lone parent in part-time work Lone parent not working Couple with children, self-employed Couple with children, both working, one or more full-time Couple with children, one in full-time one not working Couple with children, one or more in part-time work Couple with children, both not working
Source: HBAI 2008/09. 350 300 250 200 150 100 50 0
Parent's economic status
Poverty gap (percentages)
The purpose of this paper is to use poverty gap analysis to explore the depth of poverty experienced by children of low-income families in the UK.
Measures set out in the Child Poverty Act and in the National Child Poverty Strategy are based on poverty headcounts, i.e. you are either below or above a certain poverty threshold. The most commonly used measure is the 60 per cent relative poverty measure, defined as individuals living in households with incomes below 60 per cent of the median income. The head count does not distinguish between those with incomes just below the poverty line and those deeper in poverty. Policies which improve incomes for those at the bottom of the income distribution will not lead to a fall in measured income poverty, unless incomes are raised sufficiently to cross the chosen poverty threshold, and yet reducing these families’ depth of poverty is highly likely to improve living standards.
This paper supplements the headcount measures with analysis of the ‘poverty gap’ for UK children. The poverty gap measures ‘How poor are the poor’, i.e. the extent of poverty for those who are below the relative poverty threshold. With this measure, an improvement in incomes for those in poverty which is not sufficient for them to escape poverty, is nevertheless captured as a drop in measured poverty.
If you would like to know more about DWP research, please contact: Kate Callow, Commercial Support and Knowledge Management Team, Upper Ground Floor, Steel City House, West Street, Sheffield, S1 2GQ. http://research.dwp.gov.uk/asd/asd5/rrs-index.asp
Published by the
Department for Work and Pensions
August 2011