INTRODUCTION
The threats posed to reef-building corals by global climate change are now widely recognized. Coral bleaching episodes have occurred with increased fre-quency in recent decades, corresponding to major declines in coral populations (Wilkinson 1996, Brown 1997, Gardner et al. 2003). These declines are clearly associated with environmental factors including
ele-vated sea surface temperatures (Glynn & D’Croz 1990) and acidification resulting from increased atmospheric CO2(Hoegh-Guldberg et al. 2007, De’ath et al. 2009). Current climate models predict increasing ocean tem-peratures in the coming decades (IPCC 2007), prompt-ing questions about the future of coral populations and coral reef ecosystems. The potential for adaptation, acclimatization, or range shifting by corals in response to global climate change is therefore a major focus of
© Inter-Research 2009 · www.int-res.com *Email: [email protected]
Genetic variation in responses to a settlement cue
and elevated temperature in the reef-building coral
Acropora millepora
Eli Meyer
1,*, Sarah Davies
2, Shi Wang
1, Bette L. Willis
3, David Abrego
3,
Thomas E. Juenger
1, Mikhail V. Matz
11University of Texas, Austin, 1 University Station C0930, Austin, Texas 78712, USA
2The University of Calgary, Department of Biological Sciences, 2500 University Drive NW, Calgary, Alberta T2N 1N4, Canada
3ARC Centre of Excellence for Coral Reef Studies, and School of Marine and Tropical Biology, James Cook University, Townsville, Queensland 4811, Australia
ABSTRACT: Reef-building corals are threatened by increasing sea surface temperatures resulting from global climate change. Whether corals can adapt to increasing temperatures over the course of generations will depend in part on heritable variation in thermal physiology and dispersal potential, which may serve as the raw material for natural selection. To investigate whether such variation exists in coral populations, and build a framework for identifying the coral-specific genetic factors involved, we performed controlled crosses between 3 genetically distinct colonies of the branching coral Acropora millepora. We compared the families of larvae (which in this species naturally lack symbionts) for several physiological traits, and observed between-family differences in nearly every case. Using larvae cultured at standard and elevated temperatures, we measured the developmental decrease in protein content and the expression of candidate heat response genes. We used an in vivo
assay for mitochondrial enzyme activity to evaluate the metabolic response to temperature changes in individual larvae. We also compared the responsiveness of larvae from different families to a nat-ural settlement cue to gain insights into long-range dispersal potential. Partitioning the components of total phenotypic variance confirmed the existence of additive genetic effects for settlement rates and βγ-crystallin expression, while variance in mitochondrial Q10 and the expression of actin and
Hsp16were driven by non-additive effects. The phenotypic variance observed among the small num-ber of families analyzed here suggests the existence of considerable heritable variation in natural coral populations, which supports the possibility of effective adaptive responses to climate change.
KEYWORDS: Global climate change · Adaptation · Coral reefs · Thermal tolerance
contemporary research in coral biology (Coles & Brown 2003, Precht & Aronson 2004, Berkelmans & van Oppen 2006, Lesser 2007).
A key factor determining the thermal sensitivity of corals, and the potential for any adaptation or acclima-tization, is their symbiotic association with zooxanthel-lae (genus Symbiodinium). These intracellular sym-bionts are directly affected by temperatures just 1 to 2°C above ambient summer sea surface temperatures (Jokiel & Coles 1990). Damage to the symbionts is fol-lowed by pigment loss, death, or expulsion from the host (Warner et al. 1999). Diverse thermal tolerances are observed among genotypes of the symbiotic zoo-xanthellae (Robison & Warner 2006), and this variance has a profound impact on the thermal tolerance of corals associated with particular symbiont types (Rowan 2004, Berkelmans & van Oppen 2006). Despite this historical focus on symbionts, it is increasingly clear that thermal responses of corals are affected by both coral- and symbiont-specific factors (Abrego et al. 2008), and data on both partners in the symbiosis will be required for effective modeling and management of coral populations (Baums 2008, Day et al. 2008, May-nard et al. 2008, Baird et al. 2009).
There are several mechanisms through which the coral host might influence thermal responses, includ-ing photoprotection, removal of reactive oxygen spe-cies, and molecular chaperone activities (Baird et al. 2009). The expression of genes from the coral host has been extensively used as a biomarker system for envi-ronmental stress, providing clear evidence that coral traits are involved in stress responses (Brown et al. 2002, Edge et al. 2005). Baseline variation in the expression of these indicator genes has been shown within populations (Edge et al. 2008), some of which is probably genetically determined. Several other lines of evidence also suggest genetic variation in thermal responses. First, variation in bleaching responses has been reported among different coral taxa (Berkelmans & van Oppen 2006), and also within populations of a particular coral species (Edmunds 1994). Reciprocal transplant experiments have identified locally adapted specialist genotypes (D’Croz & Maté 2004). Finally, the development of nuclear genetic markers for corals has revealed more population structure among corals than previously expected (Baums 2008), confirming the genetic plausibility of local adaptation to environ-mental conditions. Although none of these studies on natural populations have unambiguously demon-strated genetic control of thermal tolerance, together they provide a rationale for experiments aimed at iden-tifying genetic determinants of thermal responses in corals.
One possible scenario for coral populations faced with warming sea surface temperatures is geographic
range shifting, in which corals colonize newly suitable habitats (e.g. at higher latitudes). There is good evi-dence for range shifting by corals over geological time scales (Greenstein & Pandolfi 2008), and some evi-dence of range shifting during the current climate change has begun to emerge (Precht & Aronson 2004). Reef-building corals have larval dispersal phases that can range from days to weeks in duration (Wilson & Harrison 1998), underscoring the importance of under-standing larval responses to environmental stress dur-ing this time period. Differential effects of elevated temperatures on coral embryos and larvae have been found between species and between aposymbiotic and symbiotic larvae (Baird et al. 2006, Negri et al. 2007), but genetic variation in these larval traits within a spe-cies remains unexplored. The responsiveness of larvae to settlement cues is one important factor that can affect dispersal potential (Miller & Mundy 2003), in addition to the distribution of these cues in the envi-ronment and the time required to reach competence. Settlement cues affecting coral larvae have been extensively studied, including the documentation of natural cues (Heyward & Negri 1999), identification of the active compounds (Kitamura et al. 2007), and char-acterization of the roles of biofilms in recruitment (Webster et al. 2004). These studies provide a frame-work for characterizing genetic variation in the responsiveness of coral larvae to settlement cues.
The major aim of the present study was to character-ize the extent of heritable variation in traits that might be adaptively important during climate change. Fami-lies of aposymbiotic larvae produced from controlled crosses were cultured under controlled conditions, avoiding the confounding effects of different thermal histories and symbiont types. Temperature responses were measured at multiple levels of biological organi-zation (gene expression, enzyme activity, and protein content) and compared between replicate cultures for each family. Responses to a known settlement cue were compared among families, revealing differences that might affect dispersal potential. Our findings sug-gest substantial heritable variation in these traits, high-lighting the need for a more complete understanding of the genetic and phenotypic variance that might be under selection in natural populations of corals facing warming sea surface temperatures.
MATERIALS AND METHODS
All colonies were collected within a small area (Nelly Bay) to ensure that the genetic crosses produced corre-sponded to realistic possibilities within natural popula-tions. Colonies were isolated in individual bins filled with 1 µm filtered seawater (FSW) prior to spawning. After spawning, gamete bundles were collected from each colony and gently passed through a 300 µm nylon mesh to separate sperm from eggs. Samples of sperm were collected from each parent colony and preserved in ethanol for genotyping. Parent colonies were later genotyped at 40 microsatellite loci (Wang et al. 2009), confirming that these colonies were genetically dis-tinct. Based on these data, a similarity index was calcu-lated for each comparison between parent colonies (Kosman & Leonard 2005). Following spawning, parent colonies were returned to the reef.
The eggs isolated from each colony were combined separately with sperm from each of the other 2 colonies to produce 6 different larval families (Table 1). Self-fer-tilization occurs at low rates in this species (Willis et al. 1997), and control self-cross trials verified that self-tilization was not detectable in our samples. After fer-tilization, excess sperm were removed by rinsing with FSW on 300 µm mesh, and embryos were stocked into 2 l FSW in plastic culture vessels at 2 ml–1. Three in-dependent cultures were established for each larval family, in each of 2 different temperature-controlled rooms, for a total of 36 culture vessels. One room was set at a standard culturing temperature of 28°C, and the other at an elevated temperature of 32°C. Water temperature was recorded at 10 min intervals using data loggers (Onset Computer), confirming that tem-perature was maintained at within half a degree of tar-get levels (27.7 ± 0.4°C and 31.4 ± 0.5°C, respectively). Culture seawater (FSW) was changed 1 d after fertil-ization to remove unfertilized eggs and cell debris, and at 2 d intervals thereafter. Larvae were sampled from each culture vessel daily and preserved in RNALater (Ambion) for later analysis.
Measurement of protein content.Protein content of individual larvae was measured throughout develop-ment (1 to 5 d post-fertilization) using the Bradford assay (Bradford 1976) with the following minor
modifications. Individual larvae were first rinsed in 150 mM NaCl, then transferred individually into a 96-well PCR plate along with 10 µl of 150 mM NaCl. Larvae were homogenized by adding 28 µl of 1.33 N NaOH and back-pipetting 10 to 20 times, then incu-bated at 60°C for 30 min. Samples were neutralized with 10 µl of 1.67 N HCl and combined with 150 µl of Bradford Reagent (Sigma) in a 96-well flat-bottom plate. Each plate included duplicate dilutions of a stan-dard curve prepared from bovine serum albumin (BSA), ranging from 2 to 15 µg per well. Protein con-tent was calculated based on the absorbance at 595 nm using a SpectraMax M2 plate reader (Molecular Devices) and comparison to the standard curve. Multi-ple individuals (n = 8) were measured from each cul-ture vessel at each developmental time point (1 to 5 d post-fertilization), for 1440 individual measurements in total. The amount of protein lost during development was calculated for each culture vessel as the difference between initial and final contents (1 and 5 d post-fertilization).
In vivomeasurement of mitochondrial metabolism. Mitochondrial metabolism of individual larvae was measured using an in vivotest of mitochondrial dehy-drogenase activity based on the water-soluble tetra-zolium salt WST-1 (Ishiyama et al. 1993). At 5 to 7 d post-fertilization, 25 individual larvae from each of the 32°C culture vessels were assayed individually in a 384-well plate. Larvae were incubated at constant tem-perature in the WST-1-containing cell proliferation reagent (Clontech) diluted 1:10 in FSW. Absorbance at 450 nm was monitored for 2 h using the SpectraMax M2 well plate reader with the temperature maintained at 28°C. Next, the temperature was increased to 32°C and the absorbance monitored for an additional 2 h. For the 28°C data, a slope was calculated for each individual larva by robust regression of absorbance against time using the MASS library in R statistical software (Ven-ables & Ripley 2002). Next, a slope was calculated for the 32°C data from each larva in the same way. Finally, the increase in slope with increasing temperature was used to calculate a standardized measure of temp-erature response (Q10) for each larva as: Q10 = (slope32°/slope28°)(10/ΔT), where ΔT is the change in tem-perature. Altogether, rates were measured in 450 indi-vidual larvae. To satisfy assumptions of linearity, data sets that fit poorly to linear models (R2< 0.5) were ex-cluded. To minimize the impact of methodological arti-facts (e.g. wells containing dead or lysed larvae), the largest and smallest 1% of slopes and Q10values were excluded, along with wells showing negative slopes. The 349 assays that passed these quality filters were used for between-family comparisons of Q10values.
qPCR analysis of gene expression. RNA was ex-tracted from larvae preserved in RNALater using the Egg source Sperm source
Colony A Colony B Colony C
Colony A — BA CA
Colony B AB — CB
[image:3.612.57.289.129.201.2]Colony C AC BC —
Table 1. Crossing design. Names of 6 larval families produced by crossing sperm and eggs from 3 colonies are given as sire×dam. Attempted self-crosses (within colonies) showed
RNAqueous-micro kit (Ambion) as follows: Larvae were sampled at 5 d post-fertilization from all culture vessels in each temperature-controlled room (28 and 32°C) for RNA extraction (n = 36 extractions). RNA was extracted from samples of 8 to 12 larvae per culture vessel according to the manufacturer’s instructions. For each sample, first strand cDNA was prepared from 85 ng of total RNA using SuperScriptII reverse tran-scriptase (Invitrogen) and a modified oligo-dT primer (5’-CGC AGT CGG TAC TTT TTT TTT TTT TV-3’). An aliquot of first strand cDNA equivalent to 0.2 ng RNA was used for each qPCR reaction.
To compare the effects of temperature on gene expres-sion between families, we selected a small heat shock protein gene (Hsp16)previously implicated in tempera-ture stress responses in corals (Downs et al. 2000), and 2 additional genes (actin and βγ-crystallin) based on un-published experiments performed in our laboratory that showed differential expression of these genes in stressed corals. Analysis of qPCR data using the comparative CT method, where CTrefers to the cycle at which the fluo-rescence signal crosses the threshold, requires the use of reference genes for normalizing expression to RNA load-ing (Livak & Schmittgen 2001); we selected 18S rRNA for that purpose on the basis that rRNA is the major compo-nent of total RNA and is therefore a suitable standard for normalizing expression to total RNA. cDNA sequences for these genes were identified by homology searches in annotated sequences from the larval transcriptome (Meyer et al. 2009), and primers were designed for each gene using Primer3 (http://primer3.sourceforge.net/). The primers used for qPCR were: actin-F (5’-GCT CCC CCA ACG ATG AAG AT-3’); actin-R (5’-GAC CCT CCA ATC CAT ACA GAG TAT TT-3’); Hsp16-F (5’-TCC TCC TCT GAG CGT TGT TT-3’); Hsp16-R (5’-CTC ACG GGA ATC AAA CGA GT-3’); βγ-crystallin-F (5’-TTG GAG GAA AGT TTG ACG CT-3’); βγ-crystallin-R (5’-TCA TTG CCG ATG TTC ATT GT-3’); 18S-F (5’-AAT CCT CAG TGG AGG GAG GT-3’); and 18S-R (5’-CAC CAG ACT TGT CCT CCG AT-3’). qPCR was performed in 15 µl volumes with SYBR Green Master Mix (Applied Biosystems) and analyzed using the Applied Biosystems 7300 Real Time PCR System. The specificity of each primer pair was confirmed by gel electrophoresis and melting curve analysis, and dilution series were ana-lyzed to confirm equal amplification efficiencies. Each cDNA sample was assayed in triplicate for each gene, and relative expression calculated using the ddCT method (Livak & Schmittgen 2001).
Evaluating larval response to settlement cue. To quantify the responsiveness of competent larvae to a natural settlement cue, crustose coralline algae (CCA) (Heyward & Negri 1999), samples of 50 to 100 larvae from each culture vessel were transferred into 5 ml of FSW in a 6-well plate. Seven-day-old larvae from
cul-tures grown at 32°C were used for these settlement trials, which were performed at this same temperature. Locally collected samples of CCA were finely ground, then tested for effectiveness on larvae sampled from culture. Preliminary trials with overnight exposure to a strong settlement cue (freshly ground CCA) resulted in 100% settlement, demonstrating that larvae from all families had reached settlement competence. To allow for detection of differences in the settlement response, the cue was weakened by maturation of the ground CCA overnight, followed by several rinses with FSW. A small amount of this diluted cue was distributed to each well, and after 12 h the settled recruits were pho-tographed along with any larvae that remained swim-ming. Settlement success was calculated as the per-cent of larvae that had settled and attached to the plate during the experiment.
Statistical analysis.Phenotypic data for each family were compared by ANOVA using R statistical software (R Development Core Team 2008), with age and tem-perature treated as fixed factors and family as a ran-dom factor. Bartlett’s test was used to test for hetero-scedasticity, and the Kolmogorov-Smirnov test to test for normality. The experimental unit for all compar-isons was the average value per culture vessel. Devel-opmental changes in protein content were analyzed using a 3-way ANOVA with the factors age, tempera-ture, and family. For a conservative estimate of the effects of temperature on protein loss, a series of 2-way ANOVAs of initial and final protein content was con-ducted with the factors age and temperature, and cor-rected for multiple comparisons using the false discov-ery rate procedures of Benjamini & Hochberg (1995). Mitochondrial metabolic Q10 values were log-trans-formed to satisfy normality assumptions, and the aver-age Q10 compared between families using 1-way ANOVA, followed by pairwise comparisons between families using Tukey’s honestly significant difference (HSD) test. Gene expression data (ddCTvalues) were analyzed separately for each of the 3 targeted genes using a 2-way ANOVA with the factors temperature and family. The percent of larvae that settled in response to settlement cue was arcsine square root-transformed, as is standard practice for percentage data (Zar 1984), and compared between families using 1-way ANOVA followed by pairwise comparisons using Tukey’s HSD.
We subsequently applied a diallel model to these data to evaluate the relative contributions of additive genetic variance and other sources to the total pheno-typic variance. For traits measured at a single culture temperature, we explored genetic effects using the standard random effects diallel model:
where μis the grand mean, giand gjare the general combining abilities for the ith and jth parents, respec-tively, sijis the specific combining ability between the
ith and jth parent, rij corresponds to reciprocal cross effects, and eijkis the residual (Griffing 1956, Falconer & Mackay 1996, Lynch & Walsh 1998). Under this framework, differences in general combining abilities (GCA) are attributable to additive genetic variance
(Va= 4 ×GCA), specific combining abilities (SCA) are attributable to non-additive genetic variance (Vd= 4 × SCA), and reciprocal cross effects are attributable to parental environments or sex-linkage. For traits mea-sured at different culture temperatures, we explored genotype × environment interactions using an ex-panded diallel model. Here, we included a fixed factor associated with our temperature manipulation and interactions with genetic terms specified as:
Yijkm = μ+ ti+ gj+ gk+ sjk+ ti*gij+ ti*gik+ ti*sjk+ rjk+ eijkm where μis the grand mean, tiis the temperature treat-ment, gjand gkare the general combining abilities for the jth and kth parents, respectively, sjkis the specific combining ability between the jth and kth parent,
ti*gijand ti*gikindicate treatment by general combin-ing ability interactions, ti*sjkindicates the treatment by specific combining ability interaction, rjk corresponds to reciprocal cross effects, and eijkm is the residual;
mrefers to the unit of replication (culture vessels). In each case, models were fit using restricted maximum likelihood with Proc Mixed in SAS (Littell et al. 1996). Under both frameworks, the significance of compo-nents of variance was evaluated with loglikelihood ratio tests. Initial models included all terms, but we also explored subsequent reduced models depending on lack of support for more complex effects (e.g. recip-rocal effects or treatment interactions). Because no strong evidence for reciprocal effects was found, the results presented are for models with this term re-moved. Finally, we estimated narrow-sense heritability of traits with significant GCA as Va/Vp, where Va= 4 × GCA and Vp= 2 ×GCA + SCA + residual (Falconer & Mackay 1996).
RESULTS
Genetic diversity among parent colonies Genotyping using microsatellite markers confirmed the genetic diversity of the 3 colonies selected for these experiments. Ninety-five percent of markers (n = 38) were polymorphic among these colonies. Allelic diver-sity among colonies was high, with 136 unique alleles detected for these 40 markers (3 unique alleles per marker, on average). Of the unique alleles detected,
most (69%) were found in only one colony, with 19% found in 2 colonies and only 12% shared among all colonies. Similarity indices (the average percentage of shared alleles per locus) were calculated for each pair-wise comparison, revealing substantial genetic differ-ences between parental colonies: 0.41 for A – B, 0.28 for A – C, and 0.34 for B – C. This provides a genetic context for our subsequent comparisons of within- and between-family phenotypic variance.
Effects of family, temperature, and age on protein contents
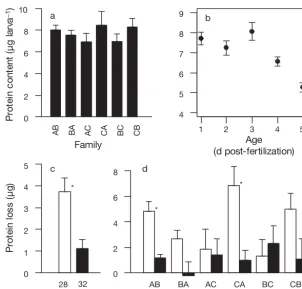
At the earliest developmental stage studied (1 d post-fertilization), no differences were detected in protein content of larvae from the 6 different families
[image:5.612.308.539.597.720.2](F5, 30= 0.74, p=0.6), with an overall mean (± SE) pro-tein content of 7.7 ± 0.3 µg embryo–1 (Fig. 1a). Two general trends in these data are apparent from simple analyses of the single factors of age and temperature. Firstly, the average protein content across families de-clined significantly during development (F4, 20 = 9.0, p=3 × 10– 4), for an overall average decrease of 31% by 5 d post-fertilization (Fig. 1b). Secondly, compari-son of the average protein loss between culture tem-peratures revealed a marginally significant differ-ence, with higher protein loss in larvae grown at 28°C (39%) than in larvae grown at 32°C (13%) (F1, 5= 6.7, p=0.049; Fig. 1c). A complete analysis of the effects of family, temperature, and age on protein content revealed a significant family × temperature × age interaction effect (F20,118 = 1.9, p = 0.02), indicating between-family differences in the effects of tempera-ture on developmental changes in protein content (Table 2). Two families lost significantly more protein at the elevated temperature than at the standard cul-ture temperacul-ture (family AB: F1, 8 = 11, adjusted p =
Source df SS MS F p
Age 4 173.4 43.3 7.6 6.8 ×10– 4*** Temperature 1 6.1 6.1 1.9 0.23 Family 5 74.4 14.9 5.7 9.2 ×10– 5*** Age ×Temperature 4 40.5 10.1 2.1 0.12 Age ×Family 20 114.2 5.7 2.2 4.9 × 10– 3** Temperature ×Family 5 16.5 3.3 1.3 0.28 Age ×Temperature × 20 96.8 4.8 1.9 0.02*
Family
Residuals 118 306.6 2.6
Table 2. Three-way ANOVA table describing the effects of the fixed factors of culture temperature and larval age, and the random factor of family, on the average protein content of individual larvae from each culture vessel. *p < 0.05; **p <
0.03; family CA: F1, 8= 17, adjusted p=0.02). In con-trast, other families (e.g. BC) lost less protein overall during development, and culture temperature did not significantly affect their protein loss (Fig. 1d). A sepa-rate analysis of protein loss using the expanded diallel model revealed a significant effect of temperature
(F1, 3= 7.8, p=0.038), and a SCA ×temperature inter-action effect that would be considered significant at a relaxed threshold of α= 0.1, but not at the α= 0.05 level χ¯2= 2.8, p=0.09).
Family-specific differences in mitochondrial temperature responses
The response of mitochondrial dehydrogenase activ-ity to increased temperatures differed between fami-lies, based on a comparison of average Q10 values
(F5,12 = 6.5, p = 3.9 × 10– 4). Pairwise comparisons revealed several signifi-cant differences between families, in-cluding between half-siblings CA and CB (adjusted p = 0.023). These 2 fami-lies span the range from a ‘typical’ Q10 value of 3.8 ± 0.5 for family CB (similar to the median Q10value across all fam-ilies and culture vessels of 3.1), to an unexpectedly high value of 16.0 ± 0.7 for family CA (Fig. 2a). To illustrate the primary data upon which these Q10 values were based, examples of raw data for individual larvae from families CA and CB are shown in Fig. 2b, each of which closely matches the average values for that family. A separate analysis of mitochondrial Q10 values using the diallel model revealed a sig-nificant SCA effect χ2= 12.8, p=3.5 × 10– 4), demonstrating a non-additive component of phenotypic variance in this trait.
Effects of family and temperature on gene expression
Expression of the 3 genes measured in the present study differed between families and culture temperatures (Fig. 3). Analysis of actin expression by 2-way ANOVA revealed signifi-cant differences between families (family main effect: F5, 24 = 3.4, p = 0.02), and in family-specific responses to temperature (family × temperature interaction effect: F5, 24 = 3.4, p = 0.019). The large variance in these measurements obscured any pair-wise differences between temperatures and families, after adjusting p-values to correct for multiple tests (e.g. for the comparison of actin expression between temperature treatments in family BC, p = 0.043; adjusted p = 0.17). Nevertheless, differential re-sponses between families were clear for certain com-parisons; e.g. actin was down-regulated by 62% at 32°C in family AB, and up-regulated by 282% at 32°C in family BC (Fig. 3a). The other 2 genes assayed showed similar patterns (Fig. 3b,c). Expres-sion of Hsp16differed significantly between families
(F5, 24 = 5.9, p = 0.001), as did expression of βγ -crys-tallin (F5, 24 = 4.3, p = 0.006). Analysis of these gene expression data using the expanded diallel model revealed different patterns for the 3 genes. Expres-sion of βγ-crystallin was significantly affected by 0
2 4 6 8 10
P
rot
ei
n c
ont
ent
(
µ
g
la
rv
a
−
1)
AB BA AC CA BC CB
a
1 2 3 4 5
4 5 6 7 8 9
Age (d post-fertilization) Family
Family (°C)
b
0 1 2 3 4
5 c
P
rot
ei
n l
o
s
s
(
µ
g)
28 *
0 2 4 6
8 d
AB BA AC CA BC CB
*
*
[image:6.612.53.356.80.369.2]32
Fig. 1. Acropora millepora. Protein content of individual embryos and larvae from different families and culture temperatures. Data shown for each family are the means ± SE across culture vessels. (a) Average protein content of the 6 families at 1 d post-fertilization was not significantly different. (b) Developmen-tal decrease in protein content, averaged across families and culture conditions. (c) Developmental decrease in protein content between 1 and 5 d post-fertiliza-tion, expressed as a percent of the Day 1 value, averaged across families. (d) Average developmental protein loss for each of the 6 larval families at each cul-ture temperacul-ture. For (c) and (d), white bars represent larvae grown at 28°C and black bars larvae grown at 32°C; #: significant differences between culture
GCA (χ2= 5.2, p =0.023) and by temperature (F 1, 29= 5.48, p = 0.026), suggesting that variance in βγ -crys-tallin expression includes both environmental and additive genetic components. Actin expression showed a significant SCA × temperature effect (χ2 = 5, p = 0.025), indicating that the effects of tempera-ture on actin expression differed between specific parental combinations (i.e. families). Expression of
Hsp16 showed significant effects of SCA χ2= 16.2, p = 5.7 ×10– 5) and temperature (F
1, 29= 4.87, p = 0.036). Overall, these data indicate that gene expression in coral larvae is affected by both genetic and environ-mental factors, and the relative contributions of these factors differ between genes.
Family-specific differences in responsiveness to settlement cue
Larvae from all families were presented with a known settlement cue, CCA, and the proportion of lar-vae that settled in response to this cue was compared between families. This experiment showed a signifi-cant difference in settlement rates between families
(F5,12= 8.5, p = 1.2 ×10– 3; Fig. 4). Pairwise comparisons between families revealed significantly lower settle-ment success in families AB and BA (~30%) than the ~80% observed in the other 4 families (Tukey’s HSD, adjusted p < 0.05). Analysis of settlement rates using the diallel model revealed a significant effect of GCA (χ2= 8.6, p = 0.0034), suggesting the existence of addi-tive genetic variance for this trait.
AB BA AC CA BC CB
0 5 10 15 20
a
Q10
(m
it
oc
ho
ndr
ial
dehy
dr
ogena
s
e
)
a ab
ab b
a
a
0 50 100 150 200
0.00 0.05 0.10 0.15 0.20 0.25
Time (min) Family
Ab
s450 CB family
Q10: 3.7 b
CA family
[image:7.612.78.264.275.620.2]Q10:16.3
Fig. 2. Acropora millepora. Effects of elevated temperature on mitochondrial enzyme activity in individual larvae. (a) Q10 values (+ SE) calculated for each of the 6 families, averaged across culture vessels. Lowercase letters indicate significant differences between families. (b) Example data illustrating the extremes shown for families CA and CB. The individual larval assay that most closely matched the average for that family was chosen for this example. Abs450 indicates ab-sorbance at 450 nm. Vertical dashed line indicates the time at
which temperature was increased from 28 to 32°C
0 10 20 30 40 50
Ac
ti
n
re
la
ti
v
e
e
x
pr
es
s
ion a
0 10 20 30 40
H
sp16
re
la
ti
v
e
ex
p
res
s
ion b
0 50 100 150 200
C
ryst
a
lli
n
re
la
ti
v
e
ex
pr
es
s
ion
AB BA AC CA BC CB
AB BA AC
Family
CA BC CB
AB BA AC CA BC CB
[image:7.612.320.521.295.660.2]c
Fig. 3. Acropora millepora. Relative expression of candidate thermal stress genes in 5 d old larvae. Data shown represent the means ± SE across culture vessels. White bars represent larvae grown at 28°C and black bars larvae grown at 32°C. Relative expression data are shown for (a) actin, (b) the small
DISCUSSION
Although previous research on variance in tempera-ture stress responses of adult coral colonies has focused largely on the contributions of the zooxanthel-lae symbionts (Buddemeier & Fautin 1993, Berkelmans & van Oppen 2006), it is now widely recognized that both host and symbiont factors will have to be charac-terized for effective modeling of adaptation in response to climate change (Day et al. 2008) and con-servation efforts (Baums 2008). Our findings demon-strate variation in thermal responses associated with genetic differences between corals, building on previ-ous evidence from natural populations that had sug-gested a role for host factors in determining coral ther-mal tolerance (Brown et al. 2002, Baird et al. 2006, Abrego et al. 2008). The present study exploited sev-eral advantages of larval stages (relative to the more widely studied adult colonies) to identify differences in temperature phenotypes. Culturing larvae under con-trolled conditions allows for comparisons between individuals for which the complete thermal histories are known, minimizing the confounding effects of dif-ferences in thermal histories. The simultaneous culture of thousands of larvae allows for phenotypic analysis of large numbers of individuals, at a scale that would be difficult with adult corals. Finally, because larvae of
Acropora milleporalack zooxanthellae symbionts, the observed differences among families are attributable to the coral rather than different symbiont types.
In addition to the experimental advantages of study-ing larvae, there are important biological questions specific to pelagic larval stages in corals. Gametes and early developmental stages of broadcast spawning corals are positively buoyant, possibly reflecting an
adaptation to improve fertilization success by concen-trating gamete bundles at the surface (Babcock et al. 1986). An obvious consequence of this buoyancy is that these stages are subjected to higher seawater temper-atures and higher irradiance at the water surface than those experienced by adult colonies deeper in the water column. Like adult colonies, earlier stages are critically sensitive to temperature; elevated tempera-tures reduce fertilization success, larval motility, and survival during the development of Acropora millepora
and other coral species (Edmunds et al. 2001, Bassim & Sammarco 2003, Negri et al. 2007). One factor that contributes to variance in thermal tolerance among lar-vae is the presence or absence of zooxanthellae sym-bionts, with symbiotic larvae showing lower thermal tolerance than aposymbiotic larvae (Edmunds et al. 2001, Baird et al. 2006, Yakovleva et al. 2009). Al-though the larvae used in the present study were apo-symbiotic, the elevated temperature we used (32°C) is known to result in thermal stress for both the larval stages and adult colonies of A. millepora(Baird & Mar-shall 2002, Negri et al. 2007). In contrast with these expectations, larvae in the present study fared well at elevated temperatures, with no evidence of impaired growth or development. In addition, larvae that were grown at 32°C survived well (60 to 100% survival; data not shown) during subsequent exposure to even higher temperatures (34°C for 48 h). The contrast between our findings and previous studies on larvae of this species might result in part from differential effects of temper-ature on fertilization versus growth, and in part from differences (whether environmentally induced or genetically determined) among the corals used in this and other studies.
Larvae survived and developed normally at both cul-ture temperacul-tures, but the temperacul-ture difference pro-duced measurable changes in physiology, biochemical contents, and gene expression. Despite the limited sta-tistical power associated with analysis of the small number of parental genotypes used in the present study, the differences that we observed between fami-lies (gene expression, mitochondrial enzyme activities, and developmental changes in protein content) were large enough to reach statistical significance. The phe-notypic differences we observed did not always lead to clear biological interpretations. For example, larvae grown at elevated temperatures lost less protein during development than those grown at the standard cultur-ing temperature. This unexpected observation leads to the following speculation: protein balance is deter-mined by the relative rates of synthesis and degrada-tion and, in the absence of exogenous nutrients, cells use free amino acids derived from degraded proteins for new protein synthesis (Mizushima & Klionsky 2007). Both synthesis and degradation rates would be
ex-AB BA AC
Family
CA BC CB
S
e
tt
le
m
e
n
t s
u
cce
ss
(%
)
0 20 40 60 80 100
a a
b
[image:8.612.69.278.83.221.2]b b b
Fig. 4. Acropora millepora. Response to a natural settlement cue (crustose coralline algae; CCA) compared among families of 7 d old larvae grown at 32°C. Settlement success (calcu-lated as the proportion of larvae that had settled after 12 h exposure to the settlement cue) is given as the mean ± SE per-cent for each family. Lowercase letters indicate significant
pected to increase at higher temperatures, but if the ef-fects of temperature on synthesis were greater than the effects on degradation (i.e. a higher Q10value for syn-thesis), this might result in lower protein loss at higher temperatures, as we observed. Regardless of the mechanistic explanation for this pattern, there is no clear basis for associating a particular developmental change in protein content with greater or lesser thermal tolerance, so the observed differences do not predict the fitness of a particular family. Temperature also had a substantial effect on mitochondrial dehydrogenase activity, corresponding to a Q10value of 3.1 (the median value across all families), and this effect differed signif-icantly between families. The effects of temperature on actin expression differed significantly between fami-lies, and the expression of 2 other candidate heat stress genes showed similar patterns that did not reach signif-icance. Overall, temperature responses differed be-tween families, and in some cases showed concordant patterns across traits, as clearly demonstrated by the half-sibling families BC and CA. The effects of culture temperature on developmental protein loss were larger for family CA than for family BC (Fig. 1d). Similarly, lar-vae from family CA showed a higher Q10for mitochon-drial dehydrogenase activity (Fig. 2a). Temperature had a larger effect on mitochondrial dehydrogenase ac-tivity and developmental protein loss for family CA than for family BC. In contrast, the 3 candidate stress response genes were expressed at higher levels overall in family BC, and showed a greater tendency toward up-regulation at elevated temperatures in that family (Fig. 3). It is tempting to speculate that the increased expression of stress response genes in family BC might account for the reduced effects of temperature on other traits in that family, but both the mechanisms that un-derlie this variation and any fitness consequences of that variation fall outside the scope of the present study. Nevertheless, the differential temperature responses reported in the present study provide convincing evi-dence of a genetic component to variation in tempera-ture phenotypes.
In general, the thermal tolerance of larval stages has important implications for the dispersal potential as sea surface temperatures increase, and some of the phenotypic differences we observed suggest possible dispersal consequences. In many non-feeding (lecitho-trophic) larval forms, endogenous protein content serves as a substrate for energy metabolism during development (Jaeckle & Manahan 1989, Vavra & Man-ahan 1999). In this context, the developmental de-creases in protein content observed in the present study can be interpreted as catabolism of protein reserves for energy, and the observed differences in protein loss suggest differential effects of temperature on protein catabolism between families. One important
caveat for this interpretation is that coral larvae con-tain slightly more lipid than protein (Richmond 1987), and this lipid also serves as a metabolic substrate dur-ing development (Harii et al. 2007), so a full energy budget would require data on both protein and lipids. Coral larvae might utilize dissolved nutrients present in seawater, similar to other marine invertebrate larvae (Manahan 1990), which might also affect the observed differences in protein content. Metabolic rates are pro-foundly affected by changes in temperature, and the potential for this to affect dispersal potential in marine larvae is widely appreciated (O’Connor et al. 2007). We measured mitochondrial dehydrogenase activity because this represents an essential component of aer-obic metabolism. Our observation of different temper-ature responses (Q10) among larval families (Fig. 2) suggests that temperature affects the metabolic rates of larvae differently during dispersal, depending on their genetic backgrounds. Interactions between the energetic content and metabolic rates of larvae might also be important, although no significant relationship between these traits was observed within the limited sample of genotypes in the present study.
For marine larvae in general, dispersal potential is correlated with the amount of time spent in the plank-ton (the pelagic larval duration, PLD) (Shanks et al. 2003). Within the constraints of energetic considera-tions like those outlined above, which might impose upper limits for PLD, the responsiveness of coral larvae to natural settlement cues is likely to play an important role in determining PLD (Miller & Mundy 2003). Our findings show clear differences in responsiveness to settlement cues between families (Fig. 4), suggesting that substantial variation in this trait exists among nat-ural cohorts of coral larvae. An important caveat for this interpretation is that exogenous factors also affect the dispersal of marine larvae, including currents, pre-dation, and the availability of suitable habitat (Cowen & Sponaugle 2009). For some coral populations, genetic data and dispersal models have shown that exogenous factors like these limit larval dispersal (Baums et al. 2006), which might reduce the impor-tance of responsiveness to settlement cues for those populations. Nevertheless, the magnitude of the phe-notypic differences observed in the present study sug-gests that genetically determined variation in this trait could be an important determinant of dispersal poten-tial in some populations, with potenpoten-tial implications for range shifts during global climate change.
well-documented declines in coral populations associ-ated with increased sea surface temperature (Glynn & D’Croz 1990, Gardner et al. 2003, Hoegh-Guldberg et al. 2007) and current predictions for continued in-creases (IPCC 2007). Our findings show variance in responses to elevated temperature and settlement cues; this corresponds to total phenotypic variance, which includes both additive and non-additive effects. Partitioning of this variance with the diallel model (Lynch & Walsh 1998) revealed significant additive genetic effects for 2 traits (responsiveness to settle-ment cue and expression of βγ-crystallin), implying the potential for an adaptive response to selection on those traits. Further supporting this conclusion, heritability (h2) estimates for these traits were high: h2= 0.49 for settlement propensity, and h2 = 0.38 for βγ-crystallin expression. In contrast, we observed significant non-additive effects for other traits (mitochondrial Q10and the expression of actin and Hsp16), which might result from dominance or more complex genetic interactions. The contrasting patterns observed for different traits highlight the importance of identifying both the traits that selection might act on and the genetic basis of phenotypic variance in those traits. Overall, our find-ings support the conclusion that additive genetic vari-ance exists within coral populations for several traits that might reasonably be expected to have fitness con-sequences during global climate change. Although our data set is small for estimating variance components or making inferences about population-level heritability, the diallel analysis provides an informative initial screening of genetic variance in corals. Future efforts should include expanded crossing designs to more robustly estimate patterns of genetic variance in nat-ural populations, and comparisons between popula-tions to evaluate the effects of natural selection on this variance in different environments. Direct measure-ments of thermal tolerance would also provide a valu-able addition in future studies.
The phenotypic and genetic variance in our experi-mental material represents a small sample from a sin-gle population, and should be considered in the con-text of the total genetic variation within and between coral populations. We have previously demonstrated high levels of polymorphism among colonies of Acrop-ora millepAcrop-orawithin a reef, averaging 8 to 9 alleles per locus (Wang et al. 2009), in agreement with other stud-ies of genetic diversity in this specstud-ies that used micro-satellite markers (Van Oppen et al. 2006). Analysis of allozymes in an extensive set of samples for this spe-cies has also revealed high levels of genetic diversity both within and between reefs (Smith-Keune & van Oppen 2006), and studies in other coral species have also uncovered substantial genetic diversity within populations (Ayre & Hughes 2000, Underwood 2009,
Wang et al. 2009). The general agreement between these studies with regard to the high genetic diversity within coral populations suggests the possibility that the phenotypic variance we observed might similarly be widespread within natural populations. Further investigations of this subject should include parents from different populations to compare the within- and between-reef components of phenotypic variance.
Genetic and phenotypic diversity are not the only considerations; the potential for corals to adapt will also depend critically on life-history traits and popula-tion dynamics. The importance of effective populapopula-tion size (Ne) for adaptation has been extensively studied (Charlesworth 2009), and the response to selection by natural populations is expected to vary in proportion to
Ne. For broadcast spawning marine invertebrates in general, Ne is frequently orders of magnitude lower than the census size (Palumbi & Wilson 1990, Hedge-cock 1994). Clonal reproduction by reef-building corals can further depress Ne in some populations (Lasker & Coffroth 1999), potentially constraining the rate of adaptation. Another possible constraint is the generation time, which would obviously affect the absolute rate of any adaptive response to selection. Generation times in acroporid corals are generally 3 to 5 yr (Wallace 1999). Current climate models predict that thermal stress bleaching episodes could occur at an annual frequency in 30 to 50 yr (Donner et al. 2005), suggesting that adaptation to warming ocean temper-atures would have to take place within ~10 genera-tions for coral populagenera-tions to persist.
Ultimately, identifying the genetic determinants of thermal tolerance and dispersal potential will require ge-netic approaches like quantitative trait loci mapping or association studies. To make such studies possible, our laboratory is developing genomic resources for Acropora millepora that include genetic markers (Wang et al. 2009), sequencing and annotation of the larval transcrip-tome (Meyer et al. 2009), and a genetic map. In combina-tion with other sequencing efforts underway for corals (Schwarz et al. 2008), as well as their algal symbionts
Symbiodinium(Leggat et al. 2007, Voolstra et al. 2008), these resources should enable the identification of the loci that control expression of temperature response genes in corals. In the long term, this will allow for pop-ulation-level studies of allele frequency and adaptation, leading to a more complete understanding of the fates of coral populations during climate change.
LITERATURE CITED
Abrego D, Ulstrup KE, Willis BL, van Oppen MJH (2008) Species-specific interactions between algal endosym-bionts and coral hosts define their bleaching response to heat and light stress. Proc R Soc Lond B Biol Sci 275: 2273–2282
Ayre DJ, Hughes TP (2000) Genotypic diversity and gene flow in brooding and spawning corals along the Great Barrier Reef, Australia. Evolution 54:1590–1605
Babcock RC, Bull GD, Harrison PL, Heyward AJ, Oliver JK, Wallace CC, Willis BL (1986) Synchronous spawnings of 105 scleractinian coral species on the Great Barrier Reef. Mar Biol 90:379–394
Baird AH, Marshall PA (2002) Mortality, growth and repro-duction in scleractinian corals following bleaching on the Great Barrier Reef. Mar Ecol Prog Ser 237:133–141 Baird AH, Gilmour JP, Kamiki TM, Nonaka M, Pratchett MS,
Yamamoto HH, Yamasaki H (2006) Temperature tolerance of symbiotic and non-symbiotic coral larvae. Proc 10th Int Coral Reef Symp 1:38–42
Baird AH, Bhagooli R, Ralph PJ, Takahashi S (2009) Coral bleaching: the role of the host. Trends Ecol Evol 24:16–20 Bassim K, Sammarco P (2003) Effects of temperature and ammonium on larval development and survivorship in a scleractinian coral (Diploria strigosa). Mar Biol 142: 241–252
Baums IB (2008) A restoration genetics guide for coral reef conservation. Mol Ecol 17:2796–2811
Baums IB, Paris CB, Chérubin LM (2006) A bio-oceano-graphic filter to larval dispersal in a reef-building coral. Limnol Oceanogr 51:1969–1981
Benjamini Y, Hochberg Y (1995) Controlling the false discov-ery rate: a practical and powerful approach to multiple testing. J R Stat Soc B Methodol 57:289–300
Berkelmans R, van Oppen MJ (2006) The role of zooxanthel-lae in the thermal tolerance of corals: a ‘nugget of hope’ for coral reefs in an era of climate change. Proc R Soc Biol Sci Ser B 273:2305–2312
Bradford MM (1976) Rapid and sensitive method for quantita-tion of microgram quantities of protein utilizing the princi-ple of protein-dye binding. Anal Biochem 72:248–254 Brown BE (1997) Coral bleaching: causes and consequences.
Coral Reefs 16:S129–S138
Brown BE, Downs CA, Dunne RP, Gibb SW (2002) Exploring the basis of thermotolerance in the reef coral Goniastrea aspera. Mar Ecol Prog Ser 242:119–129
Buddemeier RW, Fautin DG (1993) Coral bleaching as an adaptive mechanism. BioScience 43:320–326
Charlesworth B (2009) Fundamental concepts in genetics: Effective population size and patterns of molecular evolu-tion and variaevolu-tion. Nat Rev Genet 10:195–205
Coles SL, Brown BE (2003) Coral bleaching: capacity for acclimatization and adaptation. Adv Mar Biol 46:183–223 Cowen RK, Sponaugle S (2009) Larval dispersal and marine
population connectivity. Annu Rev Mar Sci 1:443–466 D’Croz L, Maté JL (2004) Experimental responses to elevated
water temperature in genotypes of the reef coral Pocillo-pora damicornisfrom upwelling and non-upwelling envi-ronments in Panama. Coral Reefs 23:473–483
Day T, Nagel L, van Oppen MJ, Caley MJ (2008) Factors affecting the evolution of bleaching resistance in corals. Am Nat 171:E72–E88
De’ath G, Lough JM, Fabricius KE (2009) Declining coral cal-cification on the Great Barrier Reef. Science 323:116–119 Donner SD, Skirving WJ, Little CM, Oppenheimer M, Hoegh-Guldberg O (2005) Global assessment of coral bleaching
and required rates of adaptation under climate change. Glob Change Biol 11:2251–2265
Downs CA, Mueller E, Phillips S, Fauth JE, Woodley CM (2000) A molecular biomarker system for assessing the health of coral (Montastraea faveolata) during heat stress. Mar Biotechnol 2:533–544
Edge SE, Morgan MB, Gleason DF, Snell TW (2005) Develop-ment of a coral cDNA array to examine gene expression profiles in Montastraea faveolataexposed to environmen-tal stress. Mar Pollut Bull 51:507–523
Edge SE, Morgan MB, Snell TW (2008) Temporal analysis of gene expression in a field population of the Scleractinian coral Montastraea faveolata. J Exp Mar Biol Ecol 355:114–124
Edmunds PJ (1994) Evidence that reef-wide patterns of coral bleaching may be the result of the distribution of bleach-ing-susceptible clones. Mar Biol 121:137–142
Edmunds PJ, Gates RD, Gleason DF (2001) The biology of larvae from the reef coral Porites astreoides, and their response to temperature disturbances. Mar Biol 139: 981–989
Falconer DS, Mackay T (1996) Introduction to quantitative genetics. Longman, Essex
Gardner TA, Cote IM, Gill JA, Grant A, Watkinson AR (2003) Long-term region-wide declines in Caribbean corals. Science 301:958–960
Glynn PW, D’Croz L (1990) Experimental evidence for high temperature stress as the cause of El Niño-coincident coral mortality. Coral Reefs 8:181–191
Greenstein BJ, Pandolfi JM (2008) Escaping the heat: range shifts of reef coral taxa in coastal Western Australia. Glob Change Biol 14:513–528
Griffing B (1956) Concept of general and specific combining ability in relation to diallel crossing systems. Aust J Biol Sci 9:463–493
Harii S, Nadaoka K, Yamamoto M, Iwao K (2007) Temporal changes in settlement, lipid content and lipid composition of larvae of the spawning hermatypic coral Acropora tenuis. Mar Ecol Prog Ser 346:89–96
Hedgecock D (1994) Does variance in reproductive success limit effective population sizes of marine organisms? In: Beaumont AR (ed) Genetics and evolution of aquatic organisms. Chapman & Hall, London
Heyward AJ, Negri AP (1999) Natural inducers for coral larval metamorphosis. Coral Reefs 18:273–279
Hoegh-Guldberg O, Mumby PJ, Hooten AJ, Steneck RS and others (2007) Coral reefs under rapid climate change and ocean acidification. Science 318:1737–1742
IPCC (Intergovernmental Panel on Climate Change) (2007) Climate change 2007: the physical science basis. In: Solomon S, Qin D, Manning M, Chen Z and others (eds) Contribution of Working Group I to the fourth assessment report of the Intergovernmental Panel on Climate Change. Cambridge University Press, Cambridge Ishiyama M, Shiga M, Sasamoto K, Mizoguchi M, He PG
(1993) A new sulfonated tetrazolium salt that produces a highly water-soluble formazan dye. Chem Pharm Bull 41: 1118–1122
Jaeckle WB, Manahan DT (1989) Growth and energy imbal-ance during the development of a lecithotrophic mollus-can larva (Haliotis rufescens). Biol Bull 177:237–246 Jokiel PL, Coles SL (1990) Response of Hawaiian and other
Indo-Pacific reef corals to elevated temperature. Coral Reefs 8:155–162
Kitamura M, Koyama T, Nakano Y, Uemura D (2007) Charac-terization of a natural inducer of coral larval metamorpho-sis. J Exp Mar Biol Ecol 340:96–102
➤
➤
➤
➤
➤
➤
➤
➤
➤
➤
➤
➤
➤
➤
➤
➤
➤
➤
➤
➤ ➤
➤
➤
➤
➤
➤
➤
➤
➤
➤
➤
➤
➤
➤
➤
➤
➤
➤
➤
➤
➤
Kosman E, Leonard KJ (2005) Similarity coefficients for mole-cular markers in studies of genetic relationships between individuals for haploid, diploid, and polyploid species. Mol Ecol 14:415–424
Lasker HR, Coffroth MA (1999) Responses of clonal reef taxa to environmental change. Integr Comp Biol 39:92–103 Leggat W, Hoegh-Guldberg O, Dove S, Yellowlees D (2007)
Analysis of an EST library from the dinoflagellate (Sym-biodinium sp.) symbiont of reef-building corals. J Phycol 43:1010–1021
Lesser MP (2007) Coral reef bleaching and global climate change: Can corals survive the next century? Proc Natl Acad Sci USA 104:5259–5260
Littell RC, Milliken GA, Stroup WW, Wolfinger RD (1996) SAS system for mixed models. SAS Institute, Cary, NC Livak KJ, Schmittgen TD (2001) Analysis of relative gene
expression data using real-time quantitative PCR and the 2(-Delta Delta C(T)) method. Methods 25:402–408 Lynch M, Walsh B (1998) Genetics and analysis of
quantita-tive traits. Sinauer Associates, Sunderland, MA
Manahan DT (1990) Adaptations by invertebrate larvae for nutrient acquisition from seawater. Integr Comp Biol 30: 147–160
Maynard JA, Baird AH, Pratchett MS (2008) Revisiting the Cassandra syndrome: the changing climate of coral reef research. Coral Reefs 27:745–749
Meyer E, Aglyamova G, Wang S, Buchanan-Carter J and others (2009) Sequencing and de novo analysis of a coral larval transcriptome using 454 GS-Flx. BMC Genomics 10: 219
Miller K, Mundy C (2003) Rapid settlement in broadcast spawning corals: implications for larval dispersal. Coral Reefs 22:99–106
Mizushima N, Klionsky DJ (2007) Protein turnover via auto-phagy: implications for metabolism. Annu Rev Nutr 27: 19–40
Negri AP, Marshall PA, Heyward AJ (2007) Differing effects of thermal stress on coral fertilization and early embryoge-nesis in four Indo-Pacific species. Coral Reefs 26:759–763 O’Connor MI, Bruno JF, Gaines SD, Halpern BS, Lester SE, Kinlan BP, Weiss JM (2007) Temperature control of larval dispersal and the implications for marine ecology, evolu-tion, and conservation. Proc Natl Acad Sci USA 104: 1266–1271
Palumbi SR, Wilson AC (1990) Mitochondrial DNA diversity in the sea urchins Strongylocentrotus purpuratusand S. droebachiensis. Evolution 44:403–415
Precht WF, Aronson RB (2004) Climate flickers and range shifts of reef corals. Front Ecol Environ 2:307–314 R Development Core Team (2008) R: a language and
environ-ment for statistical computing. R Foundation for Statistical Computing, Vienna
Richmond RH (1987) Energetics, competence, and long-distance dispersal of planula larvae of the coral Pocillo-pora damicornis. Mar Biol 93:527–533
Robison JD, Warner ME (2006) Differential impacts of pho-toacclimation and thermal stress on the photobiology of four different phylotypes of Symbiodinium(Pyrrhophyta). J Phycol 42:568–579
Rowan R (2004) Coral bleaching: thermal adaptation in reef coral symbionts. Nature 430:742
Schwarz JA, Brokstein PB, Voolstra C, Terry AY and others (2008) Coral life history and symbiosis: functional genomic resources for two reef building Caribbean corals, Acrop-ora palmataand Montastraea faveolata. BMC Genomics 9: 97
Shanks AL, Grantham BA, Carr MH (2003) Propagule disper-sal distance and the size and spacing of marine reserves. Ecol Appl 13:159–169
Smith-Keune C, van Oppen M (2006) Genetic structure of a reef-building coral from thermally distinct environments on the Great Barrier Reef. Coral Reefs 25:493–502 Underwood JN (2009) Genetic diversity and divergence
among coastal and offshore reefs in a hard coral depend on geographic discontinuity and oceanic currents. Evol Appl 2:222–233
Van Oppen MJH, Underwood JN, Muirhead AN, Peplow L (2006) Ten microsatellite loci for the reef-building coral Acropora millepora(Cnidaria, Scleractinia) from the Great Barrier Reef, Australia. Mol Ecol Notes 7:436–438 Vavra J, Manahan DT (1999) Protein metabolism in
lecitho-trophic larvae (Gastropoda: Haliotis rufescens). Biol Bull 196:177–186
Venables WN, Ripley BD (2002) Modern applied statistics with S, 4th edn. Springer, New York
Voolstra CR, Sunagawa S, Schwarz JA, Coffroth MA, Yel-lowlees D, Leggat W, Medina M (2009) Evolutionary analysis of orthologous cDNA sequences from cultured and symbiotic dinoflagellate symbionts of reef-building corals (Dinophyceae: Symbiodinium). Comp Biochem Physiol D 4:67–74
Wallace CC (1999) Staghorn corals of the world: a revision of the coral genus Acropora (Scleractinia; Astrocoeniina; Acroporidae) worldwide, with emphasis on morphology, phylogeny and biogeography. CSIRO Publishing, Mel-bourne
Wang S, Zhang L, Matz M (2009) Microsatellite characteriza-tion and marker development from public EST and WGS databases in the reef-building coral Acropora millepora (Cnidaria, Anthozoa, Scleractinia). J Hered 100:329–337 Warner ME, Fitt WK, Schmidt GW (1999) Damage to Photo-system II in symbiotic dinoflagellates: a determinant of coral bleaching. Proc Natl Acad Sci USA 96:8007–8012 Webster NS, Smith LD, Heyward AJ, Watts JEM, Webb RI,
Blackall LL, Negri AP (2004) Metamorphosis of a sclerac-tinian coral in response to microbial biofilms. Appl Envi-ron Microbiol 70:1213–1221
Wilkinson CR (1996) Global change and coral reefs: impacts on reefs, economies and human cultures. Glob Change Biol 2:547–558
Willis BL, Babcock RC, Harrison PL, Wallace CC (1997) Experimental hybridization and breeding incompatibili-ties within the mating systems of mass spawning reef corals. Coral Reefs 16:S53–S65
Wilson JR, Harrison PL (1998) Settlement-competency peri-ods of larvae of three species of Scleractinian corals. Mar Biol 131:339–345
Yakovleva IM, Baird AH, Yamamoto HH, Bhagooli R, Nonaka M, Hidaka M (2009) Algal symbionts increase oxidative damage and death in coral larvae at high temperatures. Mar Ecol Prog Ser 378:105–112
Zar JH (1984) Biostatistical analysis, Englewood Cliffs, NJ
Editorial responsibility: Tim McClanahan, Mombasa, Kenya
Submitted: February 17, 2009; Accepted: July 8, 2009 Proofs received from author(s): September 22, 2009
➤
➤
➤
➤
➤
➤
➤
➤
➤
➤
➤
➤
➤
➤
➤
➤
➤
➤
➤
➤
➤
➤
➤
➤
➤
➤
➤
➤
➤
➤
➤
➤
➤
➤
➤
➤
➤
➤
➤
➤