Integrating social and biophysical data to develop and evaluate marine protected area planning at a local scale: the 1998 Cairns Area Plan of Management as a case study
302
0
0
Full text
(2) Integrating social and biophysical data to develop and evaluate marine protected area planning at a local scale: the 1998 Cairns Area Plan of Management as a case study.. Thesis Submitted by Barbara Anne Bollard Breen. For the degree of Doctor of Philosophy In the Department of Tropical Environment Studies James Cook University of North Queensland January 2006. i.
(3) ELECTRONIC COPY. I, the undersigned, the author of this work, declare that the electronic copy of this thesis provided to the James Cook University Library, is an accurate copy of the print thesis submitted, within the limits of the technology available.. _______________________________ Signature. _______________ Date.
(4) STATEMENT OF ACCESS. I, the undersigned, the author of this work, understand that James Cook University will make this thesis available for use within the University Library and, via the Australian Digital Thesis Network, for use elsewhere. I understand that, as an unpublished work, a thesis has significant protection under the Copyright Act and I do not wish to place any further restrictions on access to this work.. Barbara Anne Bollard Breen. (Date). ii.
(5) STATEMENT OF SOURCES. I declare that this thesis is my own work and has not been submitted in any form for another degree or diploma at any university or other institution of tertiary education. Information derived from the published or unpublished work of others has been acknowledged in the text and a list of references is given.. Barbara Anne Bollard Breen. (Date). iii.
(6) STATEMENT OF CONTRIBUTION OF OTHERS The research I conducted during this thesis was funded by a grant and a stipend scholarship from the CRC Reef Research Centre Ltd. The Great Barrier Reef Marine Park Authority provided logistical support and advice on the development and implementation of the surveys conducted during this study and eight months of full time work placement during the project. My academic supervisors were Professor Helene Marsh and Dr Scott Shafer. My industry advisor was Mr. Allan Williams. Additional academic advice was given by Dr Steve Sutton, Dr Mark Fenton and Mr. James Innes. Professor Helene Marsh, Dr Mark Morrison, Daniel Breen and Dr Sue Pockett provided editorial assistance. The Great Barrier Reef Marine Park Authority, Australian Institute of Marine Science, Professor Helene Marsh, Professor Howard Choat, Dr Bruce Mapstone and Dr Tony Ayling provided data for the thesis. Daniel Breen, Dr Glen De’ath, and Dr Mike Steele provided statistical advice. NSW Marine Parks Authority and the New Zealand Department of Conservation assisted with computer, printing and binding costs. Declaration of Ethics The research presented and reported in this thesis was conducted within the guidelines for research ethics outlined in the National Statement and Guidelines on Research Practice (1997), the James Cook University Policy on Experimentation Ethics. Standard Practices and Guidelines (2001), and the James Cook University Statement and Guidelines on Research Practice (2001). The proposed research methodology received clearance from the James Cook University Experimentation Ethics Review Committee.. Barbara Anne Bollard Breen. (Date). iv.
(7) ACKNOWLEDGEMENTS I am greatly indebted to my supervisors: Firstly my principal supervisor, Professor Helene Marsh for her belief in me. She has been a constant source of understanding, guidance, patience, strength and motivation. I could never have completed this thesis without her support. I would like to thank Dr. Scott Shafer for his support and guidance during the development, implementation and write-up of this thesis despite his being based overseas. I also owe a very special thank you to Mr. Allan Williams for his ongoing supervision, support and friendship throughout this thesis. I would like to thank the staff and industry members of the CRC Reef Research Centre Ltd for their support both financially and logistically. In particular I would like to thank Chris Crossland, Don Alcock, Siriol Giffney, Giliane Brodie, Vicky Hall, Howard Choat and Mike Burgess. I would like to thank the staff of Reef Biosearch, Quicksilver Connections, and Undersea Explorer for their ongoing support, particularly: Mike Burgess, Andy Dunstan, Phil Laycock, Russ Hoar and Doug Baird. Thanks to those organisations and individuals who provided me with data and/or statistical support for this thesis including: the Australian Institute of Marine Science; Great Barrier Reef Marine Park Authority; CRC Reef Research Centre Ltd.; Professor Howard Choat; Professor Helene Marsh; Dr. Bruce Mapstone; Dr. Tony Ayling; Dr. Hugh Sweatman; Dr. Terry Done; Dr. Glen De’ath, Mike Steele, Daniel Breen, and Natalie Moltschaniskyji. Thanks to the staff who were at the GBRMPA and QDEH during my industry placement, employment and data collection stage of this thesis, particularly: Simon Woodley, Peter McGinnity, Allan Williams, Carol Honchin, Donna Turner, David. v.
(8) Lloyd, Heather Lloyd, Rob McGill, Michael Hartcher, Josh Gibson, Mark Simmons, Margaret Stokes, Jesse Low, Leanne Fernandes and James Innes. Thanks to my fellow students and friends: particularly Nina Morrisette, Daniel Breen, Liz Wilson, Giliane Brodie, Natalie Moltschaniwskyji, Mark Morrison, Melissa Walker, Cathy Sheil, Carolyn Banney, Amanda Douglas, Debbie Suttie, Sue Pockett, Chris Wild, Tracey Dillon and Denise Warren - all of whom have provided me with their emotional, academic and logistical support throughout this thesis. Finally, thank you to my parents and family for their constant love and support. They have guided me through the academic and personal challenges I encountered during the course of this degree. I am especially indebted to my husband, Daniel, who has been a constant source of inspiration, assistance and motivation throughout this project. I dedicate this thesis to him and our two very patient children, Cassie and Jack.. vi.
(9) ABSTRACT Use management in marine protected areas is a complex and often changing process, both because of political and legislative requirements and because of the diversity of user groups. It is therefore essential to have accurate and reliable information to guide development of the most appropriate management instruments within a given area. This thesis explores the challenge for marine protected area managers of making costeffective use of scientific information in planning for reasonable use of the Great Barrier Reef Marine Park. Using the 1998 Cairns Area Plan of Management as a case study, I develop methods for integrating biophysical and social data in the development and evaluation of marine protected area planning. I also provide an analysis of the interaction between human perceptions and the ecological status of the reef resources. The main objectives of this study are: 1. to assess the criteria and methods used by government agencies to allocate resource use in the Great Barrier Reef Region (GBR), at both regional and local scales; 2. to identify ways in which existing information on reef resources can be integrated into a format that is easy to access and use; 3. to develop methods to help managers map the location and types of use; 4. develop methods to assess the relationships between information on marine ecosystems and patterns in human use, perceptions and values; 5. to estimate the effectiveness of the 1998 Cairns Area Plan of Management, from the perspective both of its objectives and of its information base. In order to achieve these objectives, I employ a variety of methods and techniques. First, I conduct an extensive literature review of marine conservation, marine protected areas, the history of the Great Barrier Reef Marine Park and the goals, criteria and vii.
(10) methods used in selection and planning of Marine Protected Areas. I then collate data on planning and management specifically in the Cairns Planning Area. These data are obtained by surveying marine park managers and reviewing existing literature. Results from this survey and review reveal a lack of information on how people perceive the resource they use and what environmental conditions influence their experience and behaviour. Therefore, I conduct a survey of regular reef users in the Cairns Planning Area, with the aim of in collecting such information. Using multivariate and univariate models, I then make comparisons between the human perception of reef resources and scientifically measured indicators of coral reef status. This information is used to assess the ability of humans to perceive and monitor environmental variables. Finally, I demonstrate the use of a decision support system to integrate available biophysical and social information to support use allocation decisions. As a result of this research I arrive at several conclusions. In the literature review chapters, I identify the need for development of clearly defined, applicable and functional objectives and criteria for marine protected areas such as the Great Barrier Reef Marine Park. Such objectives and criteria would assist with transparent and objective decision making regarding the social and economic values of marine resources during the planning and management of a marine protected area. I present a range of decision support modeling methods that are available to assist managers in the systematic use of data and information sources to select marine protected areas and designate varying levels of protection. I recommend the use of several of these methods to examine information from all sources simultaneously, using a systematic process. This integrated approach is demonstrated using the Cairns Area Plan of Management as a case study.. viii.
(11) My survey of regular reef users in the Cairns Planning Area provides information on social conditions, perceptions of reef quality and levels of acceptable use. This type of information should be collected as an integral part of planning and decision making in marine protected areas. Regular reef users are found to be quite capable of describing the environment that they frequent and detecting change over time. The respondents indicate that the reefs in the Cairns Planning Area are of high quality, with offshore reefs receiving higher ratings than inshore reefs. The perceived quality of coral cover and diversity of fish species are the best indicators of overall reef quality. High quality sites are those with excellent coral cover and high diversity of fish species, while low quality sites have low coral cover and limited underwater topography. Over fishing, anchoring and cyclones are perceived to cause the most damage to reefs over time. Overcrowding is an issue at most reefs within the Cairns Planning Area, particularly those near a major port. The number of vessels at a reef location is considered to make more of a visual impact than the number of people, and thus may be a better indicator of social impacts. Using multivariate and univariate models, I compare biological monitoring data with the perceptions of reef quality of regular reef users. Comparisons between the quality variables "coral cover" and "diversity of fish species" suggest higher quality sites have more hard coral, less soft coral and fewer fish species commonly associated with branching corals in back reef locations.. In addition, I demonstrate that scientific. information could be used to predict areas that could be of high quality for marine park users. Using decision support software and other statistical techniques, I demonstrate how marine protected area managers could integrate social and biophysical data to develop ix.
(12) and evaluate marine protected area planning at a local scale. Comparisons between management settings, information from the survey of regular reef users and data from biological monitoring programs indicate that the Cairns Area Plan of Management maintains current levels of use but does not necessarily reflect diversity in abundance of reef biota at different locations. This thesis demonstrates the need for formulation of very clear and specific aims and objectives for a marine protected area, prior to the application of different management tools (e.g. settings). When these aims and objectives are clear, input from scientists is necessary to help identify: (a) exactly what needs to be protected and in what manner (b) specific information requirements needed to meet the objectives. In the case of the Cairns Planning Area, managers could have determined the relative importance of each objective to the overall goal of managing the area. The contribution of various datasets to each objective could then have been determined by scientists. In this way a clear, transparent and flexible decision process for allocating use in the area could have been developed.. x.
(13) TABLE OF CONTENTS Chapter 1. Introduction ................................................................................................. 1 1.1 Background...................................................................................................... 1 1.2 Research problem and questions ................................................................... 5 1.3 Structure of the Thesis .................................................................................... 8 Chapter 2. Conservation, benefits and impacts of marine protected areas ............ 10 2.1 Conservation of marine environments ........................................................ 10 2.2 Marine Protected Areas (MPAs).................................................................. 11 2.2.1 Types of MPA..................................................................................... 12 2.2.1.1 Categories and definitions ..................................................................... 12 2.2.1.2 No take marine reserves ........................................................................ 13 2.2.1.3 Fisheries closures................................................................................... 14 2.2.1.4 Multiple use marine parks ..................................................................... 14. 2.2.2 Benefits of MPAs................................................................................ 14 2.2.2.1 Conservation of biodiversity and ecological processes ......................... 14 2.2.2.2 Commercial fisheries and aquaculture .................................................. 15 2.2.2.3 Scientific research ................................................................................. 15 2.2.2.4 Educational opportunities ...................................................................... 15 2.2.2.5 Tourism and recreation.......................................................................... 16. 2.2.3 Impacts of MPAs ................................................................................ 18 2.3 The Great Barrier Reef Marine Park.......................................................... 20 2.3.1 The Great Barrier Reef Region ........................................................... 20 2.3.2 Establishment of the Great Barrier Reef Marine Park ........................ 21 2.3.3 Legal obligations of the Great Barrier Reef Marine Park Authority .. 22 2.3.3.1 International agreements........................................................................ 22 2.3.3.2 Commonwealth Australia legislation .................................................... 23 2.3.3.2.1 Commonwealth legislation specific to the GBRMP..................... 23 2.3.3.2.2 Regulations in force under the Great Barrier Reef Marine Park Act 1975...................................................................................................... 24 2.3.3.2.3 Commonwealth legislation relevant though not specific to the GBRMP: ..................................................................................................... 24 2.3.3.3 Queensland State legislation.................................................................. 24 2.3.3.3.1 Queensland Legislation relevant to the Great Barrier Reef........ 26. 2.3.4 Planning for use of the Great Barrier Reef Marine Park .................... 26 2.3.4.1 Zoning plans .......................................................................................... 27 2.3.4.2 Area Management Plans........................................................................ 28 2.3.4.3 Permitting and environmental management charge .............................. 29 xi.
(14) 2.4 Summary ........................................................................................................ 30 Chapter 3. Goals, criteria and methods used in marine protected area planning.. 31 3.1 Marine protected area goals, information and decision making .............. 31 3.1.1 Goals and criteria for the Australia / New Zealand National Representative System of MPAs ................................................................. 33 3.1.1.1 Protection of biodiversity and ecosystem viability................................ 35 3.1.1.1.1 Comprehensiveness ..................................................................... 35 3.1.1.1.2 Representativeness ...................................................................... 36 3.1.1.1.3 Adequacy ..................................................................................... 36 3.1.1.2 Managing and providing for human activities....................................... 38. 3.1.2 Goals and criteria of the Great Barrier Reef Marine Park .................. 40 3.2 Methods to assess biological diversity in marine protected areas............. 42 3.2.1 Surrogates of biological diversity ....................................................... 42 3.2.2 Mapping biological diversity. ............................................................. 44 3.2.2.1 Mapping of physical features. ............................................................... 44 3.2.2.2 Biological surveys sampling organism distribution and abundance...... 45 3.2.2.3 Modeling of distributions from biological data and physical or spatial predictors ........................................................................................................... 45 3.2.2.4 “Delphic” consensus of experts............................................................. 46 3.2.2.5 Summary of marine classification and mapping methods used in Australia. ........................................................................................................... 46. 3.3 Methods to assess social benefits from MPAs............................................. 48 3.3.1 Economic valuation of MPAs............................................................. 49 3.3.2 Carrying capacity ................................................................................ 50 3.3.3 Recreation opportunity spectrum (ROS) ............................................ 53 3.3.4 Limits of Acceptable Change (LAC).................................................. 56 3.4 Integrated Protected Area Planning Frameworks and Tools ................... 60 3.4.1 Geographic Information Systems. ...................................................... 61 3.4.2 Decision support ................................................................................. 64 3.4.2.1 Hierarchical Multiple Criteria models. .................................................. 64 3.4.2.2 Complementarity, irreplaceability and reserve selection algorithms..... 65. 3.4.3 Adaptive management ........................................................................ 68 3.5 Summary ........................................................................................................ 69 Chapter 4. Information for marine protected area planning in the Great Barrier Reef Marine Park.......................................................................................................... 70 4.1 Introduction ................................................................................................... 70 4.2 Interviews with managers on information use in marine park planning. 72. xii.
(15) 4.2.1 Results of the survey of managers ...................................................... 73 4.3 The Natural Environment of the Cairns Sector of the Marine Park ....... 77 4.3.1 General ecological description of area................................................ 77 4.3.2 Corals and Associated Biota ............................................................... 79 4.3.2.1 Australian Institute of Marine Science (AIMS)..................................... 80 4.3.2.2 Mapstone, Ayling and Choat (1995) ..................................................... 83. 4.3.3 Marine animals and their habitats (including dugong, turtles and whales) ......................................................................................................... 85 4.3.3.1 Dugong .................................................................................................. 85 4.3.3.2 Turtles:................................................................................................... 86 4.3.3.3 Cetaceans............................................................................................... 88 4.3.3.4 Marsh, Breen and Preen (1994)............................................................. 89. 4.3.4 Seabirds............................................................................................... 90 4.4 Physical Variables ......................................................................................... 91 4.5 Social Conditions in the Cairns Sector of the Marine Park ...................... 92 4.5.1 Patterns of Human Use in the Cairns Sector of the GBRMP ............. 94 4.5.1.1 Cultural and Heritage Use: .................................................................... 94 4.5.1.2 Tourism Use .......................................................................................... 95 4.5.1.2.1 Data Returns Database ............................................................... 95 4.5.1.2.2 Permit Database.......................................................................... 96 4.5.1.3 Recreational Use.................................................................................... 98 4.5.1.4 Commercial Fishing Use: ...................................................................... 98 4.5.1.5 Research Use ......................................................................................... 99. 4.6 Summary ...................................................................................................... 100 Chapter 5. Perception of Reef Resources in the Cairns Sector of the Great Barrier Reef Marine Park........................................................................................................ 102 5.1 Introduction ................................................................................................. 102 5.1.1 Theoretical framework...................................................................... 103 5.1.2 Aims of the survey ............................................................................ 106 5.2 Survey methods............................................................................................ 106 5.2.1 Study Area ........................................................................................ 106 5.2.2 Participants........................................................................................ 107 5.2.3 Survey design.................................................................................... 108 5.2.4 Limitations ........................................................................................ 110 5.2.5 Analyses............................................................................................ 110 5.2.6 Comparison between levels of tourism use and perception of crowding .................................................................................................................... 112 5.2.6.1 Analysis ............................................................................................... 112. xiii.
(16) 5.3 Results........................................................................................................... 113 5.3.1 Responses.......................................................................................... 113 5.3.2 Attributes of Stakeholders: ............................................................... 114 5.3.3 Environmental Perception and Indicators of Reef Quality ............... 118 5.3.3.1 Perceptions of Reef Quality:................................................................ 118 5.3.3.2 Indicators of reef quality...................................................................... 121 5.3.3.3 Indicators of Overall Reef Quality ...................................................... 128 5.3.3.4 Perception of impacts from human use: .............................................. 131 5.3.3.5 Indicators of resource damage............................................................. 134 5.3.3.6 Perception of Social Conditions .......................................................... 142. 5.3.4 Comparisons between levels of tourism use and the perception of crowding .................................................................................................... 144 5.4 Discussion ..................................................................................................... 146 5.4.1 Attributes of Survey Respondents .................................................... 148 5.4.2 Environmental Perception and Indicators of Reef Quality ............... 151 5.4.2.1 The perceived quality of reef resources............................................... 151 5.4.2.2 Indicators of overall reef quality ......................................................... 153 5.4.2.3 The perception of damage to coral reef assemblages .......................... 154. 5.4.3 The Perception of Social Conditions ................................................ 158 5.5 Conclusions .................................................................................................. 161 5.5.1 Attributes of the stakeholders: .......................................................... 161 5.5.2 Inventory of environmental perceptions ........................................... 162 5.5.3 Biophysical indicators....................................................................... 163 5.5.4 Inventory of social conditions........................................................... 163 5.5.5 Provision of data to compare between perceptions and ecological status of the resource.................................................................................. 164 Chapter 6. Indicators of Reef Quality in the Cairns Sector of the Great Barrier Reef Marine Park........................................................................................................ 165 6.1 Introduction:................................................................................................ 165 6.2 Methods:....................................................................................................... 169 6.2.1 Perception of overall reef quality...................................................... 169 6.2.2 Selection of ecological indicator variables ....................................... 170 6.2.3 Comparison between monitoring data and reef quality variables..... 171 6.2.3.1 Monitoring data: .................................................................................. 171 6.2.3.1.1 Data collected by the Australian Institute of Marine Science (AIMS) (Chapter 4, Section 4.3.2.1):........................................................ 171 6.2.3.1.2 Data collected by Mapstone et al. (1995).................................. 171 6.2.3.2 Analyses .............................................................................................. 172 xiv.
(17) 6.2.4 Limitations ........................................................................................ 173 6.3 Results: ......................................................................................................... 174 6.3.1 AIMS coral cover vs perception of ecological indicators................. 174 6.3.2 Mapstone et al. (1995) data vs perception of ecological indicators . 175 6.3.2.1 Benthic organisms ............................................................................... 175 6.3.2.2 Fish species.......................................................................................... 177. 6.4 Discussion:.................................................................................................... 189 6.4.1 Validity of reef quality data collected by regular reef users ............. 189 6.4.2 Using local knowledge for rapid assessment of reef resources ........ 191 6.4.3 Implications for GBRMP and MPAs................................................ 192 6.5 Conclusion.................................................................................................... 194 Chapter 7. The allocation of resource use in the Cairns Sector of the Great Barrier Reef Marine Park........................................................................................................ 195 7.1 Introduction:................................................................................................ 195 7.2 Methods ........................................................................................................ 198 7.2.1 Management settings and perceived resource value in the Cairns Planning Area............................................................................................. 198 7.2.2 Analysis............................................................................................. 199 7.2.3 Evaluating Management settings using multiple criteria decision trees .................................................................................................................... 200 7.2.4 Limitations of these analyses ............................................................ 205 7.3 Results........................................................................................................... 206 7.3.1 Management settings and perceived resource value in the Cairns Planning Area............................................................................................. 206 7.3.1.1 Is there a relationship between the management settings and the primary activity of respondents to the survey? ............................................................. 206 7.3.1.2 Is there a relationship between the proposed management settings and the variables describing reef quality? .............................................................. 208 7.3.1.3 Is there a relationship between management settings, frequency of damage and perceived levels of crowding at reef sites?.................................. 212. 7.3.2 Management settings and biological monitoring data in the Cairns Planning Area............................................................................................. 216 7.3.3 Evaluating management settings using Multiple Criteria Decision trees .................................................................................................................... 217 7.4 Discussion ..................................................................................................... 223 7.4.1 Management settings and perceived resource value in the Cairns Planning Area............................................................................................. 223 7.4.1.1 Activities of Reef users and Management Settings ............................. 223 7.4.1.2 Quality of Reefs and Management Settings ........................................ 224. xv.
(18) 7.4.2 Evaluating management settings using Multiple Criteria Decision trees .................................................................................................................... 226 7.4.3 Implications for GBRMP and MPAs................................................ 228 7.5 Conclusion.................................................................................................... 229 Chapter 8. General Discussion and Conclusion....................................................... 230 8.1 Introduction ................................................................................................. 230 8.2 Main findings ............................................................................................... 233 8.3 Implications for the GBRMPA: ................................................................. 239 8.4 Implications for the other MPAs: .............................................................. 240 8.5 Future Research Directions........................................................................ 241 References:. 245. Appendix 1: Maps of the Cairns Sector Appendix 2: Survey of reef managers Appendix 3: Survey of natural resource use. xvi.
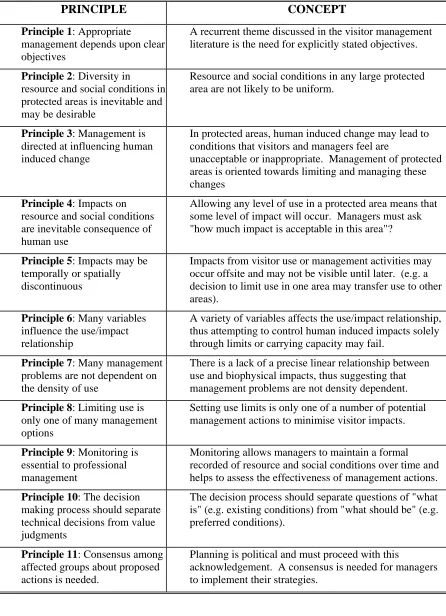
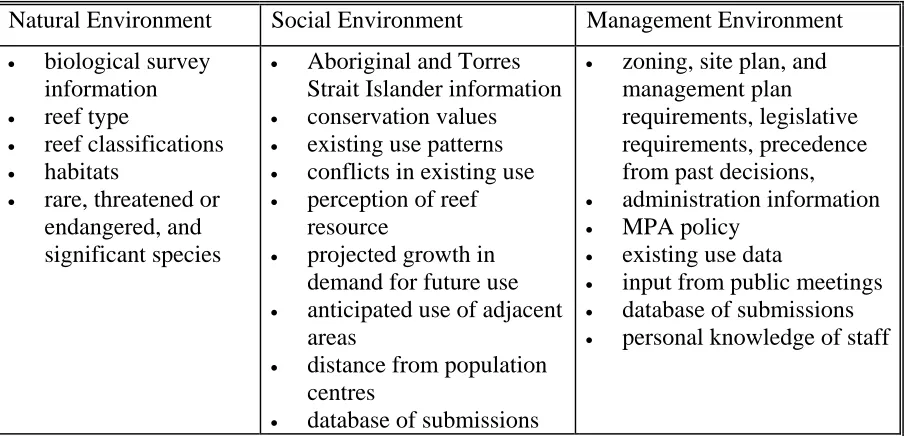
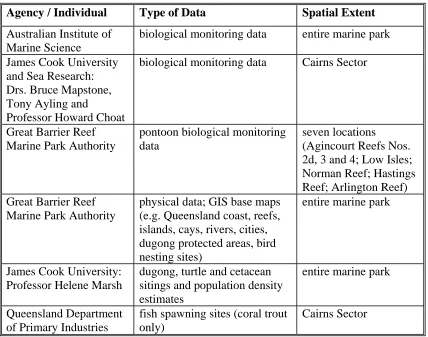
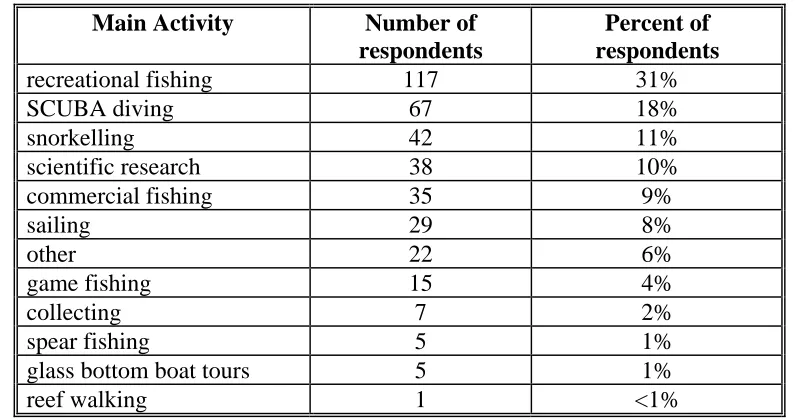
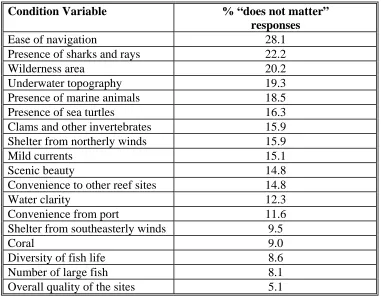
(19) LIST OF TABLES: Table 3.1: First two levels of management objectives of the Great Barrier Reef Marine Park as detailed by Fernandes (1999). The sub objectives contribute to achieving the main objectives. ........................................................................................................................... 41 Table 3.2: Principles upon which the Limit of Acceptable Use Planning System is based. Summarised from McCool (1996). ..................................................................................... 58 Table 4.1: Summary of comments made by the 22 managers regarding the types of decisions they make, how long the decision took and the scale of information required to support these decisions in each area of management expertise. ...................................................... 74 Table 4.2: Summary of information requirements for decision making regarding use allocation. ............................................................................................................................................. 75 Table 4.3: List of data and agencies who provided information for this thesis .......................... 79 Table 5.1: Number and percent of responses for each main activity. ....................................... 115 Table 5.2: Percent of responses indicating that a particular condition variable "does not matter" to the quality of a reef site................................................................................................. 119 Table 5.3: Percent of responses indicating that a particular condition variable "does not matter" to the quality of a reef site for respondents who participate in the top seven activities as indicated in Table 5.1........................................................................................................ 120 Table 5.4: Factor analysis of perceived reef quality based on the level of influence of each variable on perceived quality of the respondents' most frequently used reef sites in the Cairns Sector of the Great Barrier Reef Marine Park. Mean scores for each variable were calculated over 1143 responses to questions using a seven point scale to rate each variable, where 1 = very poor, 4 = average and 7 = outstanding. Factor Domains were Ecological Landscape, Megafauna, Convenience and Shelter. Domain Mean values were calculated across variables in each domain. (n = 1143 responses).................................................... 122 Table 5.5: Overall percentage of responses indicating that a respondent had "no opinion" regarding the frequency of impact from a particular variable to a reef site. ..................... 132 Table 5.6: Percent of responses indicating that a respondent had "no opinion" regarding the frequency of impact from a particular variable to a reef site for respondents who participate in the top seven activities as indicated in Table 5.1. ......................................................... 133 Table 5.7: Factor analysis of the impact to reef quality based on the frequency of damaging changes to the quality of the respondents' most frequently used reef sites in the Cairns Sector of the GBRMP. Mean scores were calculated using a seven point scale where 1=never, 4=sometimes and 7=constantly. Domain Mean values for Factor domains were calculated across items in that domain based on the seven point response scale. (n=1143) ........................................................................................................................................... 134. xvii.
(20) Table 5.8: Respondents perceptions of the social conditions at their reef sites ........................ 144 Table 5.9: Bivariate correlation analyses using Spearman’s Rho comparing the survey respondents mean perception of crowding per reef (7 survey questions) and the sum total of tourism visitations per reef from 1 July 1995 to 30 June 1996. (N=63) ...................... 145 Table 6.1: Comparisons between the mean AIMS variables "live coral" and “dead coral” (ranks of 0 = no coral to 5 = 76-100% coral cover) and the mean survey respondents’ perception of total “coral”, “diversity of fish species” and “overall quality” (ranks of 1 = very poor to 7= outstanding) at 50 back reef locations using nonparametric correlation analyses (Spearman’s Rho). (n = 50).............................................................................................. 174 Table 6.2: Comparisons between the Mapstone et al. (1995) mean benthic data and the survey respondents mean perception of “coral”, “diversity of fish species” and “overall quality” at back reef locations, using the nonparametric Spearman's Rho correlation analyses. Correlation Coefficient provided for each set of variables. N=39 reefs. .......................... 176 Table 6.3: Comparisons between the Mapstone et al., (1995) mean benthic data and the survey respondents mean perception of “coral”, “diversity of fish species” and “overall quality” at FRONT reefs, using the nonparametric Spearman's Rho correlation analyses. Correlation Coefficient provided for each set of variables. n = 39 reefs ............................................. 177 Table 6.4: Comparisons between the Mapstone et al. (1995) fish data (mostly pooled to genus with some predominant species analysed) and the survey respondents’ perception of coral, diversity of fish species and overall quality at BACK reef locations, using the nonparametric Spearman's Rho correlation analyses. Correlation Coefficient provided for each set of variables. n=39 ................................................................................................ 178 Table 6.5: Comparisons between the Mapstone et al., (1995) fish data (mostly pooled to genus with some predominant species analysed) and the survey respondents’ perception of coral, diversity of fish species and overall quality at FRONT reef locations using the nonparametric Spearman's Rho correlation analyses. Correlation Coefficient provided for each set of variables. (n = 38) ........................................................................................... 179 Table 6.6: Results of the Canonical Correlation Analysis between the main groups of benthic and fish species from Mapstone et al. (1995) and the survey respondents’ perception of “coral”, “fish diversity” and “overall quality” for back reef locations. ............................ 180 Table 7.1: Available biological and social datasets and their relative importance as defined by the management objectives in the Plan. The weighting for the three main objectives (ECOLOGY, CULTURE and USE) sum to 100%. The sub criteria within each objective are weighted according to their contribution to the overall weight of its objective. ......... 204 Table 7.2: Multivariate analysis of variance (MANOVA) results comparing management settings with ratings for perceived quality of reef sites in the Cairns Sector of the Great Barrier Reef Marine Park. ................................................................................................. 208 xviii.
(21) Table7.3: Multivariate analysis of variance (MANOVA) results comparing management settings (low, moderate and intensive) with ratings for “perceived damage" for reef sites in the Cairns Sector of the Great Barrier Reef Marine Park. ................................................ 212 Table 7.4: Pearson's Chi-Square analyses comparing management settings with ratings for perceived levels of crowding at reef sites in the Cairns Sector of the Great Barrier Reef Marine Park....................................................................................................................... 216 Table 7.5:Multivariate analysis of variance (MANOVA) results comparing management settings (low, moderate and intensive) with biological monitoring data for reefs in the Cairns Sector of the Great Barrier Reef Marine Park. ...................................................... 217 Table 7.6: Univariate analysis of variance and multiple comparisons to test the difference between management settings and decision scores derived using the Simple Multiattribute Rating Technique. Analysis of Variance testing that there is no difference between settings and decision scores............................................................................................................ 222 Table 7.7: Univariate analysis of variance and multiple comparisons to test the difference between management settings and decision scores derived using the Simple Multiattribute Rating Technique. Post Hoc Multiple Comparisons using the Bonferroni Test. Based on observed means. ................................................................................................................ 222. xix.
(22) LIST OF FIGURES: Figure 1.1: The Cairns Planning Area within the Cairns Sector of the Great Barrier Reef Marine Park (GBRMPA 1998).......................................................................................................... 6 Figure 3.1: Total economic value of an environmental asset (The World Bank 1994) .............. 49 Figure 3.2: The Limits of Acceptable Change Planning System (Stankey et al. 1985).............. 60 Figure 5.1: Perceptual Event in the Human Environment - An ecological affordance model of leisure affordances (from Pierskalla and Lee 1998).......................................................... 105 Figure 5.2: Response rates for different methods of survey administration. Black bars indicate the number of surveys handed out at a given venue and light grey bars indicate the number of surveys returned (percentage of returns is given). ........................................................ 114 Figure 5.3 : Correspondence analysis of the main activity of survey respondents categorized by reef. Colours of reefs and interreefal areas on the map of the Cairns Sector correspond with colours in each quadrant of the plot of the first two dimensions of the correspondence analysis. For example, recreational fishers and commercial collectors described the same reefs, these areas are coloured in red on the map and in the correspondence analysis plot. ........................................................................................................................................... 117 Figure 5.4: Map of the mean factor scores for the ecological landscape dimension of reefs and interreefal areas in the Cairns Sector from the principal component factor analysis of the 17 quality variables. Factor scores were classified into four categories in Arc View using the quantile classification method. On the maps, reefs coloured in red had higher factor scores as indicated in the legend. These scores correspond to higher ratings in the survey (above average to outstanding) for the groups of variables in the ecological landscape dimension. ........................................................................................................................................... 124 Figure 5.5: Map of the mean factor scores for the megafauna dimension of reefs and interreefal areas in the Cairns Sector from the principal component factor analysis of the 17 quality variables. Factor scores were classified into four categories in Arc View using the quantile classification method. On the maps, reefs coloured in red had higher factor scores as indicated in the legend. These scores correspond to higher ratings in the survey (above average to outstanding) for the groups of variables in the megafauna dimension. ........... 125 Figure 5.6: Map of the mean factor scores for the convenience dimension of reefs and interreefal areas in the Cairns Sector from the principal component factor analysis of the 17 quality variables. Factor scores were classified into four categories in Arc View using the quantile classification method. On the maps, reefs coloured in red had higher factor scores as indicated in the legend. These scores correspond to higher ratings in the survey (above average to outstanding) for the groups of variables in the convenience dimension.......... 126. xx.
(23) Figure 5.7: Map of the mean factor scores for the shelter dimension of reefs and interreefal areas in the Cairns Sector from the principal component factor analysis of the 17 quality variables. Factor scores were classified into four categories in Arc View using the quantile classification method. On the maps, reefs coloured in red had higher factor scores as indicated in the legend. These scores correspond to higher ratings in the survey (above average to outstanding) for the groups of variables in the shelter dimension. .................. 127 Figure 5.8: Regression tree analysis of the overall quality of reef sites. The explanatory variables were coral (coral), diversity of fish species (fish.spp) and underwater topography (topo). Each of the splits is labeled with the variable name and the values that determine the split. For each of the terminal nodes the distribution of observed values of overall quality is shown in a histogram. Each node is labeled with the mean rating and number of observations in the groups (in brackets)............................................................................ 130 Figure 5.9: Map of the mean factor scores for the human impact dimension of reefs and interreefal areas in the Cairns Sector from the principal component factor analysis of the 12 damage variables. Factor scores were classified into four categories in Arc View using the quantile classification method. On the maps, reefs coloured in red had higher factor scores as indicated in the legend. These scores correspond to higher ratings in the survey (some to constant damage) for the groups of variables in the human impact dimension. ........... 137 Figure 5.10: Map of the mean factor scores for the tourism impacts dimension of reefs and interreefal areas in the Cairns Sector from the principal component factor analysis of the 12 damage variables. Factor scores were classified into four categories in Arc View using the quantile classification method. On the maps, reefs coloured in red had higher factor scores as indicated in the legend. These scores correspond to higher ratings in the survey (some to constant damage) for the groups of variables in the tourism impacts dimension. ........ 138 Figure 5.11: Map of the mean factor scores for the natural impacts dimension of reefs and interreefal areas in the Cairns Sector from the principal component factor analysis of the 12 damage variables. Factor scores were classified into four categories in Arc View using the quantile classification method. On the maps, reefs coloured in red had higher factor scores as indicated in the legend. These scores correspond to higher ratings in the survey for the groups of variables in the natural impacts dimension. ...................................................... 139 Figure 5.12: Map of the mean factor scores for the vessel impacts dimension of reefs and interreefal areas in the Cairns Sector from the principal component factor analysis of the 12 damage variables. Factor scores were classified into four categories in Arc View using the quantile classification method. On the maps, reefs coloured in red had higher factor scores as indicated in the legend. These scores correspond to higher ratings in the survey for the groups of variables in the vessel impacts dimension. ....................................................... 140. xxi.
(24) Figure 5.13: Map of the mean factor scores for the fishing impacts dimension of reefs and interreefal areas in the Cairns Sector from the principal component factor analysis of the 12 damage variables. Factor scores were classified into four categories in Arc View using the quantile classification method. On the maps, reefs coloured in red had higher factor scores as indicated in the legend. These scores correspond to higher ratings in the survey for the groups of variables in the fishing impacts dimension. ...................................................... 141 Figure 6.1: Scatterplot of the first root of the Mapstone et al. (1995) canonical variates explained by the survey respondents’ perception of coral, fish diversity and overall quality of the same reef sites. The canonical variates in the first root were chosen to correlate maximally with each other. ............................................................................................... 180 Figure 6.2 Bubble plot of the reef sites and survey respondents’ perception of coral (ranks of 1 = very poor to 7= outstanding; the mean rank determines the size of the bubble) in the space defined by the first two canonical variates of the Mapstone et al. (1995) data set. 182 Figure 6.3: Bubble plot of the reef sites and survey respondents’ perception of diversity of fish species (ranks of 1 = very poor to 7= outstanding; the mean rank determines the size of the bubble) in the space defined by the first two canonical variates of Mapstone et al. (1995). ........................................................................................................................................... 183 Figure 6.4: Bubble plot of the reef sites and survey respondents’ perception of overall quality (ranks of 1 = very poor to 7= outstanding; the mean rank determines the size of the bubble) in the space defined by the first two canonical variates of the Mapstone et al. (1995) data set. ..................................................................................................................................... 184 Figure 6.5: Bubble plot of the reef sites and percent cover of soft coral (percentage cover determines the size of the bubble) in the space defined by the first two canonical variates of the Mapstone et al. (1995) data set. .................................................................................. 185 Figure 6.6: Bubble plot of the reef sites and percent cover of hard coral (percentage cover determines the size of the bubble) in the space defined by the first two canonical variates of the Mapstone et al. (1995) data set. .................................................................................. 186 Figure 6.7: Bubble plot of the reef sites and percent cover of Zebrasoma scopas (number of fish determines the size of the bubble) in the space defined by the first two canonical variates of the Mapstone et al. (1995) data set. .................................................................................. 187 Figure 6.8: Bubble plot of the reef sites and percent cover of Plectroglyphidodon lacrymatus (number of fish determines the size of the bubble) in the space defined by the first two canonical variates of the Mapstone et al. (1995) data set. ................................................ 188 Figure 7.1: Correspondence analysis of primary activity by management setting from the Plan. Correspondence analysis describes the relationships between two variables (primary activity displayed as green open squares and management setting displayed as red filled squares) in a low-dimensional space, while simultaneously describing the relationships xxii.
(25) between the categories for each variable. For each activity type (note: activity name is shortened for displaying on the graph) and management setting, the distances between points in the plot reflects the relationships between these variables, with similar activities and management settings plotted close to each other. ...................................................... 207 Figure 7.2. Canonical discriminant scores for mean social “quality” variables labelled by reef and coloured by the management “Setting” assigned in the Plan. Centroids for each management setting (Low, Moderate and Intensive) indicated by large coloured symbols. Data for individual survey responses were averaged for each reef before analysis. The locations of all reefs are shown in Appendix 1. ................................................................ 210 Figure 7.3. Canonical structure showing correlations between the social “quality variables measured and the first two canononical variates superimposed on Figure 7.2. The locations of all reefs are shown in Appendix 1. ............................................................................... 211 Figure 7.4 Canonical descriminant scores for mean "damage" variables from the social survey labelled by reef and coloured by the management "Setting" assigned in the Plan. Centroids for each management setting (Low, Moderate and Intensive) indicated by large coloured symbols. Data for individual survey responses were averaged for each reef before analysis. The locations of all reefs are shown in Appendix 1.......................................................... 214 Figure 7.5 Canonical structure showing correlations between the "damage" variables from the survey and the two canonical variates superimposed on Figure 7.4. The locations of all reefs are shown in Appendix 1.......................................................................................... 215 Figure 7.6: Multiple Criteria Decision model for the overall goal of reef conservation in the Cairns Planning Area. Values to the left of the criteria and sub-criteria are cumulative weights and values to the left of reefs are the decision scores calculated from the relative weights and data scores for those locations. The coloured background is used to clarify the different levels in the decision tree. .................................................................................. 219 Figure 7.7: Graph of the decision scores for reefs in the Cairns Planning Area. The decision score for a reef was calculated as the sum of all ratings of the reef against the lowest criterion, weighted by the importance of that criterion to the decision. Those reefs with higher decision scores (e.g. West Hope Island, East Hope Island, etc.) are more aligned with higher priority criteria and may require more protection. The reefs with decision scores highlighted in blue have a Low Use setting, those in yellow have a Moderate Use setting while those in red have an Intensive Use setting................................................... 220 Figure 7.8: Mean Decision Score (± SD) for Cairns Planning Area reefs in each of the management settings (Low Use, Moderate Use and Intensive Use). ................................ 221. xxiii.
(26) Chapter 1. Introduction 1.1 Background "Coral reefs around the world are being damaged or destroyed at an increasing rate. The estimates in the Status of Coral Reefs of the World: 2002 report that 27% of the world’s reefs have been effectively lost, including 16% which were severely damaged during the massive El Nino and La Nina climate changes of 1998. Another 14% are predicted to be destroyed in 2 to 10 years, and a further 18% in 10 to 30 years unless effective management of these valuable resources is implemented soon." (Global Coral Reef Monitoring Network 2003, http://www.gcrmn.org/). While much of the damage to coral reefs that has occurred in the last decade may be due to climate change, there is evidence that introduction of good local management practices can slow or even reverse adverse changes (Wolanski and De’ath 2005). The Status of Coral Reefs of the World: 2002 report notes that about half of the 16% of reefs damaged in 1998 are showing encouraging recovery, with the best recovery in well managed or isolated reefs (Wilkinson 2002). It is widely believed that establishment of Marine Protected Areas (MPAs)1 is important in conserving coral reefs and other important ecosystems (National Center for Ecological Analysis and Synthesis 2001). In 1988, the World Conservation Union (IUCN) recommended that the development of an international system of marine protected areas should be an integral component of marine conservation and management throughout the world. In Australia, the National Representative System of Marine Protected Areas forms a part of a national strategy for marine conservation and management (ANZECC TFMPA1998b).. 1. marine protected area: any area of land and/or sea especially dedicated to the protection and maintenance of biological diversity, and of natural and associated cultural resources, and managed through legal or effective means. (ANZECC TFMPA 1998 a, b; IUCN 1994).. 1.
(27) This strategy aims to establish a national system of MPAs which contains comprehensive1, adequate2 and representative3 samples of Australia's marine ecosystems. The Great Barrier Reef Marine Park (GBRMP) off Australia's East Coast is arguably the ‘jewel in the crown’ of Australia’s National Representative System of Marine Protected Areas. It is the world's largest marine protected area, stretching 2,300 km along the north east coast of Australia and 100-300 km offshore, covering a total of 344,400 km2 (GRBMPA 2005a). It includes some of the richest and most complex ecosystems on earth (GBRMPA 2005a). Because of its international importance, it has been listed as a World Heritage Area (GBRMPA 1981). The Australian Commonwealth government agency responsible for the conservation and management of the GBRMP is the Great Barrier Reef Marine Park Authority (GBRMPA). The GBRMPA pioneered the multiple use marine protected area concept, which has served as a model for management of marine parks throughout the world (Kenchington 1990, Whitehouse 1993). The objectives for the management of the GBRMP are aligned with the IUCN objectives for marine protected areas. The goal of the GBRMP is: "to provide for protection, wise use, understanding and enjoyment of the Great Barrier Reef World Heritage Area in perpetuity" (Kenchington 1990).. 1. comprehensive: the NRSMPA will include the full range of ecosystems recognised at an appropriate scale within and across each bioregion (ANZECC TFMPA 1998a,b) 2 adequate: the NRSMPA will have the required level of reservation to ensure the ecological viability and integrity of populations, species and communities (ANZECC TFMPA 1998a,b). 3 representative: those marine areas that are selected for inclusion in MPAs should reasonably reflect the biotic diversity of the marine ecosystems from which they derive (ANZECC TFMPA 1998a,b).. 2.
(28) Through legislation and international obligations, the GBRMPA was charged with the responsibility of protecting and maintaining the marine environment while allowing for sustainable use (Chapter 2, Section 2.5.1). However, our understanding of how much use is sustainable and compatible with the protection of the natural resource is limited (Lawrence et al. 2002).. As a result, the GBRMPA is required to implement a. conservative or precautionary approach to managing use of the marine park (Environment and Biodiversity Conservation Act, C’wlth 1999). Zoning and management plans were developed by the Authority as spatial planning mechanisms to manage use of the GBRMP. Zoning Plans are statutory documents that set out the conditions of use and access in different sections of the GBRMP on a regional spatial scale. Zoning establishes the overall framework for the conservation and regulation of use of a region and is the umbrella under which other management mechanisms are deployed (Lawrence et al. 2002). From 1996, the GBRMPA’s approach to zoning began to incorporate strategies to apply the National Representative System of Marine Protected Areas (NRSMPA) strategy within the GBRMP. This process was subsequently became known as the GBRMPA Representative Areas Program. The aim was to zone the entire marine park simultaneously in an integrated plan, using bioregions identified through a scientific process as a basis for selecting suitable representative areas (Bowen and Bowen 2002, GBRMPA 2005a, Fernandes et al. 2005). In June 2003, the draft zoning plan for the entire marine park was released for public comment. In May 2004, the Australian National Parliament passed the final revised zoning plan. This plan is now the primary instrument for planning and conservation in the GBRMP at a broad spatial scale (GBRMPA 2004).. 3.
(29) Management plans complement zoning plans by addressing issues and areas on a more localised scale. Management plans can be updated more rapidly than zoning plans (because changes are not required to be laid before parliament for consideration) and allow for a more flexible and adaptive management approach to address site-specific issues. In the GBRMP, management plans are statutory documents which may be developed for areas, species or ecological communities that are considered threatened. The objectives of Management Plans are considered in Chapter 2. Management plans were first developed for the Cairns and the Whitsundays Areas in the marine park, because these are the parts of the GBRMP that experience the greatest pressures from human use. Both plans designate levels of access to specific locations in terms of settings. Locations are designated as low, moderate or intensive use settings depending on the number of vessels allowed at that location. In essence, these plans specify formal estimates of acceptable use at each site (Lawrence et al. 2002). Use management at this localised scale is a complex process because of political and legislative requirements and the diversity of user groups. It is therefore essential to have accurate, reliable and easily updateable information to inform decisions for appropriate levels of use and to guide the development of management instruments for a given area. This thesis focuses on the challenge of using social and biophysical information to plan for reasonable use of the marine park through the use of Area Management Plans, using the 1998 Cairns Area Plan of Management as a case study. The Cairns Area was chosen as the case study because it was (and is) the area of highest use in the GBRMP and thus experienced the most impact from human pressures. When I began work on the thesis, the GBRMPA was seeking public comment on the proposed management plan for the area and I was asked to assist in this process. The information gathered during this thesis fed into the Representative Areas Programme and the rezoning of the Cairns. 4.
(30) to Cooktown Management Area, but was most relevant to the development of the Cairns Area Plan of Management. 1.2 Research problem and questions The Cairns Sector of the marine park extends from offshore Mission Beach in the south to just north of Lizard Island and covers approximately 3,600,000 hectares (Figure 1.1). It was declared a section of the Great Barrier Reef Marine Park on 19 November 1981. The first zoning plan for the section was completed by November 1983 and the second such plan was completed by November 1992. The 2003 zoning plan identifies the Cairns Sector as the Cairns to Cooktown Management Area and has maintained the Section Boundary (GBRMPA 2004). The area contains 160 reefs, 54 islands and 32 cays (Ivanovici 1984). Most locations are within close proximity to major ports and the Cairns International Airport and are easily accessed by a rapidly growing tourism industry and increasing resident population. There is a wide diversity of use of the Cairns Sector, ranging from scientific research to traditional hunting to commercial fishing and tourism. In the late 1990s, there was concern that the growing demand for access to the area would soon surpass the number of available sites (Honchin 1996) and therefore threaten the values of the area. The 1992 zoning plan for the Cairns Sector was not adequate to address the management issues and use conflicts at an appropriate planning scale. The resultant planning deficit was of great concern to managers and reef users. Therefore, even though the overall GBMP zoning plan was in the process of being updated via the RAP, a separate Area Management Plan was developed for the Cairns Planning Area in 1998 (Figure 1.1). The Cairns Planning Area in this management plan was smaller than the Cairns Sector, as it was not considered urgent to develop management instruments for the low use area offshore of Cooktown (GBRMPA Planning Staff, personal communication 1996). It is 5.
(31) this 1998 version of the Cairns Area Management Plan that is used as the case study in this thesis. This plan has recently been revised as a result of the recent rezoning of the entire Marine Park. Although the revised plan was not part of my case study, I consider it further in Chapter 8.. Figure 1.1: The Cairns Planning Area within the Cairns Sector of the Great Barrier Reef Marine Park (GBRMPA 1998). 6.
(32) In order to allow for reasonable use of an area, it is important for managers to consider the types and levels of use and the settings they wish to maintain. Consequently it is important to understand how people perceive the resource they use and what environmental conditions influence their experience and behaviour (Shafer et al. 1998). If people using the Cairns Sector of the marine park receive different types and amounts of benefit from different components of the resource (Driver and Brown 1978, Driver et al. 1987), then there is justification for designating spatial areas of resource use that best meet their requirements. Although several researchers have described use patterns in the GBRMP (e.g. Shafer et al. 1998, Green et al. 1999, Inglis et al. 1999), most studies have concentrated on one particular user group at one or a few locations. Also, while there is general acceptance of the importance of social and cultural impacts of marine tourism on the GBRMP, there have been only a few studies that explore the relationship between ecological impacts and social and cultural impacts (Green et al. 1999, Shafer and Inglis 2000, Harriott 2002). This thesis integrates biophysical and social data and provides an analysis of the interaction between human perceptions and the ecological status of the reef resources.. In addition, it explores the challenge for managers to make cost-. effective use of scientific information. The social data for this thesis were collected at the same time as the GBRMPA was developing the 1998 Cairns Area Plan of Management. My results therefore provided an opportunity to evaluate the planning process, the use of biophysical and social information and the mechanisms by which use of the Area is managed. In order to achieve my goal of integrating biophysical and social data to evaluate and improve marine protected area planning, my thesis had the following objectives:. 7.
(33) 1. to assess the criteria and methods used by government agencies to allocate resource use in the Great Barrier Reef Region (GBRR) at regional and local scales; 2. to identify ways in which existing information on reef resources can be integrated into a format that is easy to access and use; 3. to develop methods to help managers map the locations of various types of use; 4. to develop methods to assess the relationships between information on marine ecosystems and patterns in human use, perceptions and values;. 5. to apply a decision support system to review the site-based management settings in the 1998 Cairns Area Plan of Management from the perspective of the plan’s objectives and information base. 1.3 Structure of the Thesis In Chapter 2, I present the results of a review of marine conservation, marine protected areas and the historical context of the GBRMP. In Chapter 3, I review the goals, criteria and methods used in MPA selection and planning. In Chapter 4 I conduct a review of information available for planning and management of coral reefs, using the Cairns Sector of the GBRMP as a case study. In Chapter 5, I report the results of my survey of regular reef users. I conducted this survey because the reviews reported in Chapters 2 to 4 showed that, while there was a considerable amount of information available describing the physical and biological conditions within the area, there was limited information on the social conditions. In order to understand how various user groups perceive, value and experience the natural 8.
(34) and social environment in the Cairns Sector, I conducted a survey that aimed to: (1) identify issues of concern in the Cairns Sector; (2) describe attributes of stakeholder groups who regularly use the area; (3) identify physical, biological and social indicators of resource and social conditions in the area, inventory social conditions and perceptions of the resource; and (4) provide data necessary to make comparisons between social perceptions and ecological status of the reef resources. In Chapter 6, I use multivariate and univariate models to make comparisons between the human perception of reef resources reported in Chapter 5 and scientifically measured indicators of coral reef status. This information is used to assess the ability of humans to perceive and monitor environmental variables. In Chapter 7, I demonstrate the use of a decision support system which integrates available biophysical and social information to support use allocation decisions. In Chapter 8, I summarise the results of the thesis and identify opportunities for further research.. 9.
(35) Chapter 2. Conservation, benefits and impacts of marine protected areas This chapter discusses the importance of marine conservation and the development of marine protected areas. It reviews the types of MPAs that have been developed around the world and describes some of the benefits and impacts of marine protection. In addition, this chapter identifies the need for development of clearly defined, applicable and functional objectives for MPAs. 2.1 Conservation of marine environments There is wide acceptance that marine ecosystems worldwide are being degraded by increasing human use (Wilkinson 2002). Impacts from activities such as over fishing, pollution, introduction of pests, coastal agriculture and development have affected marine biodiversity in most areas, particularly along heavily populated coasts but also in more remote areas and offshore. Marine biodiversity can be defined as “the variability among living organisms from all sources, including …. terrestrial, marine and other aquatic ecosystems and the ecological complexes of which they are a part; this includes diversity within species, between species and of ecosystems” (IUCN 1994).. There are many benefits associated with protecting marine biodiversity. The three major categories of benefits identified by Day and Roff (2000) include: 1. Loss of diversity generally weakens entire natural systems and could make marine ecosystems more susceptible to natural and artificial disturbance. 2. Biological diversity represents one of our greatest resources and many of the materials and organisms found in the marine environment could provide new. 10.
(36) sources of food, fibre, medicine, energy and scientific and industrial innovations. 3. Humans benefit from natural areas and depend on healthy ecosystems for air, water, food and socio-economic values. 2.2 Marine Protected Areas (MPAs) Marine protected areas (MPAs) are increasingly being used as a major tool for conserving marine biodiversity, protecting marine habitats and ensuring the sustainability of harvest fisheries (Kelleher et al. 1995, Creese and Breen 2003, Lubchenco et al. 2003). MPAs can be defined as: “Any area of intertidal or sub tidal terrain, together with its overlying water and associated flora, fauna, historical and cultural features, which has been reserved by law or other effective means to protect part or all of the enclosed environment.” (Resolution 17.38 of the IUCN 1988, reaffirmed in Resolution 19.46 1994).. The effectiveness of MPAs in protecting biodiversity varies according to their size, degree of protection, activities that are restricted, compliance, MPA designation and whether the designation restricts polluting activities that occur outside the MPA but which threaten life within the MPA (Day and Roff 2000, Halpern 2000, Creese and Breen 2003). There are two main types of management structure for MPAs. In the “park model”, a federal or state conservation agency declares certain areas out of bounds for some or all activities (e.g. designates no take or sanctuary areas) and takes responsibility for policing these restrictions. In the “community based model”, local coastal communities assume many of the responsibilities for implementing, monitoring and enforcing the rules protecting their marine areas (Christie et al. 2002).. 11.
(37) 2.2.1 Types of MPA. 2.2.1.1 Categories and definitions. There are many categories of marine protected areas available to government and nongovernmental agencies throughout the world. As a result of the variety of definitions and objectives, numerous terms have been used to describe various types of MPAs throughout the world. These terms include marine park, marine reserve, fisheries reserve, closed area, marine sanctuary, marine or coastal protected area, nature reserve, ecological reserve, replenishment reserve, coastal preserve, area of conservation concern, sensitive area, biosphere reserve, no-take area, coastal park, national marine park, marine conservation area and marine wilderness area (Agardy et al. 2003). However, the World Conservation Union (IUCN) has recommended the use of the following seven protected area management categories (IUCN 1994, 2000), each of which has different primary objectives: “Ia Strict Nature Reserve: Protected Area managed mainly for science. This is an area of land and/or sea possessing some outstanding or representative ecosystems, geological or physiological features and/or species, available mainly for scientific research and/or environmental monitoring. Ib Wilderness Area: Protected Area managed mainly for wilderness protection. This is a large area of unmodified or slightly modified land and/or sea, retaining its natural character and influence, without permanent or significant habitation, which is protected and managed so as to preserve its natural condition. II National Park: Protected Area managed mainly for ecosystem conservation and recreation. Natural area of land and/or sea, designated to protect the ecological integrity of one or more ecosystems for this and future generations; exclude exploitation or occupation inimical to the purpose of designation of the area; and provide a foundation for spiritual, scientific, educational, recreational and visitor opportunities, all of which must be environmentally and culturally compatible. III Natural Monument: Protected Area managed for conservation of specific natural features. This is an area containing one or more specific natural or nature/cultural feature which is of outstanding value because of its inherent rarity, representative or aesthetic qualities or cultural significance. IV Habitat/Species Management Area: Protected Area managed mainly for conservation through management intervention. This is an area of land and/or sea subject to active intervention for management purposes so as to ensure the maintenance of habitats and/or to meet the requirements of specific species.. 12.
Figure


+7


Outline
Benefits of MPAs
Legal obligations of the Great Barrier Reef Marine Park Authority
Planning for use of the Great Barrier Reef Marine Park
Mapping biological diversity
Carrying capacity
Limits of Acceptable Change (LAC)
Decision support
Marine animals and their habitats (including dugong, turtles and
Indicators of Overall Reef Quality
Conclusions
Related documents
Here we performed spectral domain optical coherence tomography (OCT) in Ppt1 -/- and ceroid lipofuscinosis neuronal 3 deficient ( Cln3 -/- ) mice, which are models of infantile
Christ speaking on the law of murder said: But I say unto you, That whosoever is angry with his brother_________ shall be in danger of the judgment: and?. whosoever shall say to
Controversy of angiotensin receptor blockers (ARBs) and angiotensin converting enzyme inhibitors (ACEIs) prescription for hypertension patients in coronavirus disease 2019
Facebook mobile apps built with HTML5 (including native apps) Facebook promotes HTML5 for mobile and social apps. Nearly 50% of 800 million users access Facebook
Growth kinetics of ChimeriVax-DEN1 virus (with or without the E204 mutation) in HepG2 hepatoma cells. Both the Chi- meriVax-DEN1 and parent wt DEN1 viruses grew slower and
In particular, both developed and developing nations alike have sought to attract investment by multinational companies in high level service operations.. Increasingly these
A Study on Bipolar Affective Disorder Subjects under Remission: Quality of Sleep and Quality of Life
1 Cases 28 Male Single Nil Graduate Semiskilled Full time Lower Middle Tamil Hindu Semi-Urban Self Nil No No 2 Cases 59 Male Married Nil High Semiskilled Part time Upper Lower
As illustrated in Fig. 1 a, b, qRT-PCR results demonstrated that miR-22 expression was dramatically lower and sirt1 mRNA was markedly higher in breast cancer cell lines MCF-7 and
