Use of an Aptitude Test in
University Entrance: A Validity
Study
Catherine Kirkup Rebecca Wheater Jo Morrison Ben Durbin Marco Pomati
Acknowledgements
The project team for this report consisted of:
Project director:
Chris Whetton
Researchers:
Catherine Kirkup and Rebecca Wheater
Project Administration Assistant:
Margaret Parfitt
Statistics Research and Analysis Group:
Jo Morrison, Ben Durbin and Marco Pomati
The NFER also gratefully acknowledges the advice given by members of the project steering group and the assistance of the College Board and Educational Testing Services for providing and scoring the SAT Reasoning TestTM.
This project is co-funded by the Department for Business, Innovation and Skills, the Sutton Trust, the National Foundation for Educational Research and the College Board.
Any opinions, findings and conclusions or recommendations expressed in this material are those of the author(s) and do not necessarily reflect the views of the Department for Business, Innovation and Skills, the Sutton Trust or the College Board.
Contents
1 Executive summary 4
1.1 Introduction 4
1.2 Key findings 4
1.3 Other findings 5
1.4 Implications for policy and practice 5
1.5 Structure of the report 6
2 Introduction 7
2.1 Background 7
2.2 The SAT Reasoning TestTM 10
2.3 Objectives of the study 11
3 Relationships between SAT® scores and degree outcomes 12
3.1 Degree classification 12
3.2 Exploring the relationships between attainment measures and degree outcomes 14
3.3 Findings published in previous reports 35
3.4 Summary of section 3 38
4 Disadvantaged students 39
4.1 Measures of disadvantage 39
4.2 Analysis of interactions between measures of disadvantage & degree outcomes 40
4.3 Findings published in previous reports 41
4.4 Summary of section 4 44
5 High-achieving A level students 45
5.1 High-achieving students in selective universities 47
5.2 Findings published in previous reports 49
5.3 Summary of section 5 50
6 Questionnaire findings 51
6.1 Relationships between degree outcomes and survey responses 51
6.2 Findings published in previous reports 52
7 Discussion 56
7.1 General discussion of the results relating to the SAT® 56
7.2 Attainment and degree outcomes 57
7.3 Contextual data and degree outcomes 59
7.4 Conclusion 61
Appendix 1: Methodology 66
A1.1 Participation 66
A1.2 Data matching 66
A1.3 Surveys 67
Appendix 2: Student samples and background characteristics 69
A2.1Overview of the main sample 69
A2.2 Background characteristics of each destination sub-sample 72
A2.3 Attainment scores 73
Executive summary
1.1
Introduction
In 2005, the National Foundation for Educational Research (NFER) was commissioned to evaluate the potential value of using an aptitude test (the SAT Reasoning TestTM) as an additional tool in the selection of candidates for admission to higher education (HE). This five-year study was co-funded by the Department for Business, Innovation, and Skills (BIS), the NFER, the Sutton Trust and the College Board. This report presents findings from the final phase of the project, relating the prior attainment and SAT® scores of participating students who graduated in 2006 to their degree outcomes. It also summarises findings from the study as a whole, and cross references where appropriate to the various interim reports.
1.2
Key findings
The primary aim of the study was to examine whether the addition of the SAT® alongside A levels is better able to predict HE participation and outcomes than A levels alone.
Of the prior attainment measures, average1 A level points score is the best predictor of HE participation and degree class, followed by average GCSE points score. The inclusion of GCSE information adds usefully to the predictive power of A levels.
In the absence of other data, the SAT® has some predictive power but it does not add any additional information, over and above that of GCSEs and A levels (or GCSEs alone), at a significantly useful level.
Two other issues to be addressed in the study were: whether the SAT® can identify economically or educationally disadvantaged students with the potential to benefit from HE whose ability is not adequately reflected in their A level results; whether the SAT® can distinguish helpfully between the most able applicants who get straight A grades at A level.
There is no evidence that the SAT® provides sufficient information to identify students with the potential to benefit from higher education whose ability is not adequately reflected in their prior attainment.
1The average points score for A levels was based on the QCDA system in which an A level grade A is equivalent to
The SAT® does not distinguish helpfully between the most able applicants who get three or more A grades at A level. The SAT® Reading and Writing components do add some predictive power for some classes of degree at highly selective universities2, but add very little beyond the information provided by prior attainment, in particular prior attainment at GCSE.
1.3
Other findings
In addition to the key findings relating to the use of the SAT®, other findings about the relationships between prior attainment and HE participation and outcomes emerged from an analysis of the data.
The relationship between degree performance, prior attainment and the type of school attended suggests that on average students from comprehensive schools are likely to achieve higher degree classifications than students with similar attainment from grammar and independent schools.
Having controlled for prior attainment, gender was not a significant predictor of degree outcome, e.g. male students were neither more likely nor less likely to do better at university than female students with the same prior attainment. In this sample, ethnicity was also not a significant predictor of degree class, although in a recent much larger study ethnicity differences were found to be statistically significant (HEFCE, 2010a).
In an earlier phase of the research it was found that girls are more likely to be in HE than boys with similar attainment, yet girls tend to enter courses with lower entry requirements than would be expected from their prior attainment compared with boys.
1.4
Implications for policy and practice
The findings from this research support the following issues in relation to admission to HE:
For applicants who already have A level and GCSE attainment data, the SAT® would not provide any additional information that would be useful for predicting degree outcomes.
The use of data about the educational context in which students have obtained their qualifications, particularly the type of school attended, should be encouraged when comparing the attainment of HE candidates.
The importance of A level performance in predicting HE outcomes suggests that, due to some inequalities in the reliability of predicted grades, a post-qualification system may be more equitable and useful in assisting in the selection of candidates.
In assessing candidates for HE, average performance in both GCSE and A level examinations is more important than the total points accumulated.
Other means of differentiating between high ability HE applicants may need to be used (use of UMS3 marks) but the validity of this approach should be investigated.
See section 7 for a fuller discussion of these issues.
1.5
Structure of the report
Section 2 provides the background to the research and the aims of the study. The key findings are described in more detail in sections 3 to 6 and the report concludes with a discussion of the findings and the implications for policy and practice in section 7. The methodologies employed, a full description of the representation of the sample and further technical data (the outputs of the various analyses referred to in the report) are presented in appendices 1 to 4.
3 In the current system, A levels are graded from A* to E. The raw marks in individual papers are converted to
2 Introduction
In 2005, the NFER was commissioned to evaluate the potential value of using an aptitude test as an additional tool in the selection of candidates for admission to higher education (HE). For the purposes of the study, the SAT Reasoning TestTM (also known as the SAT®) was chosen because an earlier pilot (McDonald et al., 2001), using an earlier version of this test, had found it to be an appropriate test to use with UK students and to have some potential for such a purpose. This five-year study was co-funded by the Department for Education and Skills (now the Department for Business, Innovation, and Skills), the National Foundation for Educational Research (NFER), the Sutton Trust and the College Board.
This report presents findings from the final phase of the project, relating prior attainment and SAT® scores to degree outcomes for a group of participating students who graduated in 2009. It also summarises findings from the study as a whole, with cross references where appropriate to the various interim reports.
2.1
Background
Most UK applicants to higher education (HE) are selected on the basis of their attainment at the end of compulsory education and their predicted or actual attainment in post-compulsory education, For these students, A levels remain the most frequently taken academic qualifications and are the basis on which the vast majority of candidates apply for university admission.
increases in the proportions of young people from disadvantaged areas entering HE and a narrowing of the gap between the most advantaged and least advantaged areas. However, the gap in participation rates between the most and least disadvantaged students remains significant. There are also some concerns about fair access to the most selective universities (OFFA, 2010).
Offers of HE places are usually made primarily on the basis of prior attainment and predicted A level examination results. The Schwartz report expressed a concern that although ‘prior educational attainment remains the best single indicator of success at undergraduate level’ (p. 5), the information used to assess university applicants might not be equally reliable. In other words, it was generally recognised that, for some students, their true potential might not be reflected in their examination results due to social or educational disadvantages.
A related issue was that of access to highly selective courses and higher education institutions. As the demand for university places generally exceeds the supply, HE institutions must make choices between similarly highly qualified individuals. Prior to the introduction of the new top A level grade, the A*, this was proving to be extremely difficult for some HE admissions departments, with an increasingly large number of candidates achieving A grades at A level. In response to this, a number of HE institutions had introduced supplementary admissions tests or assessments for courses where the competition for places was particularly fierce.
The Schwartz group recommended that assessment methods used within the admissions system should be reliable and valid. Among its wider recommendations the Schwartz report encouraged the commissioning of research to evaluate the ability of aptitude tests to assess the potential for higher education:
Admissions policies and procedures should be informed and guided by current research and good practice. Where possible, universities and colleges using quantifiable measures should use tests and approaches that have already been shown to predict undergraduate success. Where existing tests are unsuited to a course’s entry requirements, institutions may develop alternatives, but should be able to demonstrate that their methods are relevant, reliable and valid. (Admissions to Higher Education Steering Group,2004,p. 8)
can vary according to the type of HE institution and the area of study (Peers and Johnston, 1994). However, there was insufficient recent evidence regarding the predictive validity of a general admissions or aptitude test within the UK context.
In the United States there is no national curriculum and there are no nationally recognised academic qualifications equivalent to GCSEs or A levels. Admission to colleges is on the basis of school grades (the high school grade point average) plus one or more college entrance tests, the most common of which are the SAT® and the ACT® test4. High school grades are considered a ‘soft’ measure because grading standards can vary widely from school to school and from state to state, hence the need for a standardised admissions test. The SAT Reasoning TestTM (previously known as the Scholastic Assessment Test) is therefore taken by high school students to provide information for colleges alongside their high school grade point average and SAT® results are used by universities to help compare students from different parts of the US. In a review of studies examining the ability of the SAT® to predict a number of measures of success in college (including graduation), the combination of high school records and SAT® scores were consistently the best pre-admission predictors (Burton and Ramist, 2001). As might be expected, several studies showed that post-admission data (such as first year grades) predicted graduation better than pre-admission measures because the predictors are closer in time to the criterion of interest. However, despite the problems inherent in establishing predictive validity, in particular range restriction and unreliability of grading standards, unadjusted studies showed moderate correlations between SAT® scores and graduation ranging from 0.27 to 0.33 (i.e. higher SAT® scores were generally associated with higher graduation outcomes).
More recently, the College Board (Mattern et al., 2008) reported on a study conducted examining the validity of the SAT® using a nationally representative sample of first-year college students who had been admitted with the revised version of the test (the same one used in this study). The correlations between high school grade point average (HSGPA) and first year college grade point average (FYGPA), corrected for restriction of range, were 0.54 for female students and 0.52 for male students. Correlations between the SAT® and FYGPA ranged from 0.52 to 0.58 for females and 0.44 to 0.50 for males. Combining the three sections of the SAT® with HSGPA resulted in multiple correlations of 0.65 and 0.59 respectively.
In Sweden, both school grades and scores on the Swedish Scholastic Aptitude Test (SweSAT) are used to select students for admission to higher education. For each course of study between a third and two-thirds of the places available are assigned on the basis of grades, and the rest on the basis of SweSAT scores. Taking the SweSAT is entirely voluntary, and it may be taken any number of times, with the highest achieved score being used. Gustafsson (2003) reported that grades have better predictive validity than tests but that tests can contribute to prediction when there are differences in the quality of education or when grades suffer from lack of comparability.
The principal study underpinning this current research was the pilot comparison of A levels with SAT® scores conducted by NFER for The Sutton Trust in 2000 (McDonald
et al., 2001) using a previous version of the SAT®. This small study revealed that the SAT® was only modestly associated with A level grades, suggesting that they were assessing somewhat distinct constructs. Analysis of item level data showed that the SAT® functioned similarly for English and American students and found little evidence of bias in the SAT® items. A further perceived advantage was that, as the results of the SAT® were provided as a scaled score (at that time with a range of 400-1600), it would allow greater discrimination between students than A level grades. On the basis of this pilot, it was considered worthwhile to carry out further research to investigate what potentially useful information the SAT® might provide to HE admission departments.
2.2
The SAT Reasoning Test
TMThe content of the SAT® was revised in 2005 and it was this most recent version that was used in this study. It comprises three main components: Critical Reading, Mathematics and Writing. In the US the administration of the SAT® is split into ten separately timed sections, with a total test time, excluding breaks, of three hours and forty-five minutes.
mechanical aspects of writing (e.g. recognising errors in sentence structure and grammar) and a 25 minute essay on an assigned topic.
In the current study, no changes were made to any of the questions but one section was removed (a section of new trial items which do not contribute to the US students’ scores) giving a total of nine sections and an overall test time of three hours and twenty minutes. Both in the McDonald study (McDonald et al., 2001) and in the current study, the results indicated that the individual SAT® items functioned in an appropriate way for use with English students.
2.3
Objectives of the study
The primary aim of the study was to examine whether the addition of the SAT® alongside A levels is better able to predict HE participation and outcomes than A levels alone. Two specific issues were also to be addressed, namely:
Can the SAT® identify students with the potential to benefit from higher education whose ability is not adequately reflected in their A level results because of their (economically or educationally) disadvantaged circumstances?
Can the SAT® distinguish helpfully between the most able applicants who get straight A grades at A level?
Interim reports were published in 2007 and 2009 (Kirkup et al., 2007, 2009). In the 2007 report the analysis of the attainment data focused on the broad relationships between SAT® scores and total scores at A level and GCSE. It also presented information from two student surveys. The 2009 report focussed on three issues: further exploration of the relationships between SAT® scores and attainment in particular individual A level subjects; analysis of the 2006 entry data, using UCAS5 data and combined HESA6and ILR7 data; statistical modelling of the background data of students to create more sensitive measures of economic and educational disadvantage. A further brief report (Kirkup et al., 2010) updated the findings from the analysis of the destination data to include students who entered higher education in 2007 and reported on a survey of participating students and young people carried out in December 2008.
3 Relationships between SAT®
scores and degree outcomes
The primary aim of the study was to examine whether the addition of the SAT® alongside A levels is better able to predict HE participation and outcomes than A levels alone. Relationships between SAT® scores and participation in HE were described in the 2009 and 2010 reports and are summarised in section 3.3. Relationships between degree class and measures of prior attainment, including the SAT®, are reported below.
Over 9000 students participated initially in the current study and took the SAT® in autumn 2005. Of this original group, just over 8000 participants were matched to their A level results in 2006. A total of 2754 participating students entered HE in 2006 on three-year degrees and graduated in 2009 and a further group of approximately 3800 participants were still studying within HE. The background characteristics of the various sub-samples are broadly similar. (See appendices 1 and 2 for a full description of the methodology and the representation of the various sub-samples.)
3.1
Degree classification
The degree classification outcomes for the 2754 students who graduated in 2009 are shown in Table 3.1 together with a comparison of classification outcomes nationally.
Table 3.1 - Degree classification outcomes for the 2009 graduate sample
Graduate sample National
Class of degree Frequency Per
cent
Per cent
First class honours 326 11.8 11.1
Upper second class honours (2:1) 1613 58.6 55.1
Lower second class honours (2:2) 714 25.9 29.3
Third class honours 73 2.7 3.3
Other (pass, unclassified honours, ordinary, degree without honours etc.)
28 1.0 1.2
Total 2754 100.0 100.0
Compared with a nationally representative population of graduates, matched by age, entry, length of course and number of years of study, the graduate sample has a slightly higher proportion of first class and upper-second class degrees. This is not unexpected given that the overall prior attainment of the main study sample was higher than a comparable national population8.
Having established the degree outcomes for the graduate sample, the main issue to be examined was whether the SAT® added to the predictive power of A levels and GCSEs.
The first step in the analysis was to carry out some simple descriptive statistics looking at the relationships between the various prior attainment measures and the class of degree obtained. For this and subsequent analyses, third class degrees and below (other degrees such as ordinary degrees, unclassified degrees, etc) were grouped together because of the relatively small numbers of these in the sample. In order to calculate these simple correlations, the degree classes were treated as interval data on a simple scale using 1 for a third class degree, 2 for a 2:2 degree, 3 for a 2:1 degree and 4 for first-class honours. (For the more complex analyses the degree classes were more accurately considered as ordinal data - see section 3.2 below.) All the correlations were positive and statistically significant.
Significant correlations with degree class (in order of size) were:
average9A level points score (0.38)
average KS4 (GCSE) points score (0.36)
total A level points score (0.34)
total KS4 points score (0.28)
mean SAT® score (0.26) – the average of the scaled scores for the three separate SAT® components
SAT® Writing score (0.26)
SAT® Reading score (0.24)
SAT® Maths score (0.18)
attainment of the main study sample was higher than the national sample of such students – see sample description in appendix 2.) Correlations are also generally weaker when there is a longer time interval between the predictors and the criterion. The highest correlations were between class of degree and average point scores for both A levels and GCSEs. The correlation between degree and average GCSE performance is somewhat surprising. It might be expected that degree outcome would correlate much more highly with A level examinations, which were taken two years closer to the degree outcome and which probably reflect a closer connection with the subject area of the degree studied. The GCSE correlation suggests a significant association between degree class and a student’s overall breadth of study and attainment and therefore an important role for GCSEs in predicting performance in HE (see also section 3.2.2).
3.2
Exploring the relationships between attainment measures and
degree outcomes
A number of regression analyses were then carried out in order to look simultaneously at the relationships between the main attainment and background variables and to identify which of these can predict degree outcomes. It was decided to use ordered categorical models, specifically multilevel ordered categorical models, which model the statistical probability of being in a particular category (e.g. having a first class degree). The reasons for using multilevel ordered categorical models for this type of analysis and an explanation of how to interpret the outcomes are given below.
A multilevelmodel is one which takes into account the hierarchical structure of data; in this case students are clustered within universities. It might be expected that on average students will be more similar to other students at the same university than they are to students at other universities. Multilevel modelling allows this to be taken into account, and provides more accurate estimates of coefficients and their standard errors (hence ensuring that we can correctly determine whether an effect is statistically significant or not).
Ordered refers to the fact that the outcomes of interest (degree results) can be placed in a definite order or rank. A first is better than a 2:1, which is better than a 2:2, and so forth. This differentiates it from unordered data, for example favourite colour.
Interpreting outputs: When categorical data is used in modelling, this is done by making comparisons between the different categories, for example comparing boys to girls. This is simple when there are only two categories, and requires only one equation. However, in our case there are four categories, with an order, which for each model requires three separate equations predicting:
1. the probability of achieving a third / other degree rather than a 2:2 or higher (OE1)
2. the probability of achieving a 2:2 or lower rather than a first or a 2:1 (OE2) 3. the probability of achieving a 2:1 or lower rather than a first (OE3).
Note that in each case these models consider the probability of achieving a given outcome, versus that of achieving a better outcome. This means that a positive coefficient relates to higher chances of the inferior outcome, and a negative coefficient relates to a lower chance of the inferior outcome. This can be confusing, and so although the findings are the same, the Original Equations (OE1, OE2 and OE3) have been reversed in the main report for ease of interpretation.10 The outputs from the models are presented in full in appendix 3.
The reversed equations can be expressed as follows:
1. the probability of achieving a 2:2 or higher rather than a third / other degree (E1) 2. the probability of achieving a first or a 2:1 rather than a 2:2 or lower (E2)
3. the probability of achieving a first rather than a 2:1 or lower (E3).
Common versus separate coefficients: In an ordered categorical model it is possible
to include variables as either ‘common’ or ‘separate’ across the three equations. By including them as common it is assumed that the impact of that variable on the chances of improved degree outcomes is the same at all levels (chances of a first, 2:1, 2:2 or third); separate coefficients enable the impact to vary between equations. Having a common coefficient is desirable as interpretation is easier. Variables were initially included separately across all three equations, but where the resulting coefficients were sufficiently similar the model was updated to include just one common coefficient, for example the grammar and independent school variables.
Goodness of fit: In a linear regression model, the R2 statistic is calculated as a
scores, SAT® scores, etc.) However, for categorical models it is not possible to calculate an R2 statistic (intuitively, the difficulty becomes clear when one considers what could be meant by the ‘proportion of variation in outcomes’ for a categorical outcome). Instead a pseudo-R2 such as McFadden’s R2 is used which, whilst being calculated in a very different manner to the normal R2, is analogous to it, in that it is a measure of the goodness of fit of the model. McFadden’s R2 is expressed as values between zero and one (higher values indicating a more robust model and a better set of predictors); however it cannot be interpreted as the proportion of variation explained by the model. A rule of thumb is that values between 0.2 and 0.4 indicate a very good model fit11. Note that because of its reference to a base model12, values should only be compared across models that share a common base (i.e. they include the same set of students). For example, this means that values should not be compared between the Maths and non-Maths subject models in Table 3.2 (models 6 and 7 respectively).
So, taking as an example the coefficients for SAT® ‘English’ from Model 1 in Table 3.2, these are positive and significant for all three equations. This means that a higher SAT® ‘English’ score is associated with a higher degree outcome, regardless of what degree you would otherwise be expected to have achieved. The coefficients for Maths SAT®, on the other hand, suggest that Maths SAT® has no impact on the chances of
achieving a third versus higher (ns = non significant); however it points to a lower chance of achieving a 2:1 or higher (versus a 2:2 or lower), and a higher chance of achieving a first (versus a 2.1 or lower). So, a high Maths SAT® score is associated with a higher chance of achieving a high or low degree outcome (a first or a 2:2/third) as opposed to a 2:1. The impact of attending a grammar school or an independent school on degree outcome was similar across all three equations and therefore these were included as common coefficients. In all of the models, attending an FE college had no impact on the chances of achieving a 2:1 or higher (versus a 2:2 or lower), or a first (versus a 2.1 or lower) so it was removed from those equations. In some models
attending an FE college had an impact on the chances of achieving a third versus higher and it was therefore included as a separate variable in the first equation of each model. (In this model the impact is non-significant.)
The outcomes from the first set of models are summarised in Table 3.2. The outputs from further models, focussing on disadvantaged students and able students, are described in sections 4 and 5 respectively. Detailed statistical outputs for the models are given in appendix 3.
In some initial explorations of the data, it became apparent that it was not helpful to combine the scores from the three components of the SAT®. The relationships between the Reading and Writing components and degree classes were very similar, i.e. they were generally predicting similar outcomes; but there was a different relationship between SAT® Maths scores and degree classification. For most analyses, a combined SAT® ‘English’ variable was created (from the mean of the Reading and Writing scores) with the SAT® Maths score entered as a separate variable. In other models all three components (Maths, Reading and Writing) were entered separately.
rules to avoid double counting qualifications13. AS levels were not the focus of the study and were not included separately in the analyses. Due to differences in the timing of some AS module examinations and opportunities to re-sit AS modules in year 13, no attempt was made to predict degree outcomes from qualifications achieved at the end of year 12.
13
All graduates
Model 1 Model 2 Model 3 Model 4 Model 5
Model 6 Maths subjects14 Model 7 Non-maths Constant –
equation 1 3.489 3.928 3.849 3.767 3.767 3.100 4.131
Constant –
equation 2 1.043 1.280 1.259 1.240 1.214 0.977 1.337
Constant –
equation 3 -2.091 -2.164 -2.090 -2.074 -2.120 -1.572 -2.231
E1 E2 E3 E1 E2 E3 E1 E2 E3 E1 E2 E3 E1 E2 E3 E1 E2 E3 E1 E2 E3
Average A level points (30)
+ + +
Total A level
points (30) + + + + + + + + + + + +
Average KS4
points (6) + + + + + + + + + + + + ns + + + + +
SAT® ‘English’ (mean Reading and Writing) score (10)
+ + + ns ns ns ns + ns ns + ns ns + ns ns ns ns ns + ns
SAT® Maths
score (10) ns – + ns – + ns – + ns – + ns – + ns ns ns ns – ns
Prior attainment of university cohort
(UNIdiff )
ns + ns – – – – ns – ns ns – – ns – – ns – ns ns –
Grammar school attended
ns – – – – – –
Independent school attended
ns – – – – ns –
FE college
attended ns - – ns – – ns
Sex ns ns ns ns ns ns ns
Asian ns Black ns Chinese ns Sex / ethnicity interactions ns Number of
cases 2754 2754 2754 2754 2754 419 2335
Goodness of fit
(McFadden’s R2)15
[image:21.595.35.561.83.687.2]The findings from this analysis (models 1 – 7) are summarised below.
Findings relating to the SAT®:
Of the prior attainment measures, effect sizes revealed that average A level performance had the strongest association with degree outcome, followed by average GCSE point score. The inclusion of GCSE information adds usefully to the predictive power of A levels.
In the absence of other data, the SAT® had some predictive power but it did not add any additional information, over and above that of GCSEs and A levels (or GCSEs alone), at a significantly useful level. This remained the case when the graduate sample was divided into students studying ‘maths’16 subjects and students studying ‘non-maths’ subjects (models 6 and 7 in Table 3.2).
Other findings:
Students who had attended grammar schools or independent schools were less likely to achieve as high a degree classification as might have be expected from their prior attainment, i.e. they were likely to achieve a lower class of degree than students from comprehensive schools with similar prior attainment.
Students who had attended FE colleges were more likely to achieve a third class honours degree than students from comprehensive schools with similar prior attainment.
Students at highly selective universities are likely to achieve a lower level of degree than students at less selective universities with similar A level and GCSE attainment. (‘Selectivity’ was measured by means of the UNIdiff value -the percentage of students at a university with A level grades ABB or AAC or above – the higher the value the more ‘selective’ the university.)
Having controlled for prior attainment, gender was not a significant predictor of degree outcome, e.g. male students were neither more likely nor less likely to do better at university than female students with the same prior attainment. In this sample, ethnicity was also not a significant predictor of degree class, although in a recent much larger study ethnicity differences were found to be statistically significant (HEFCE, 2010a).
3.2.1 Predicting degree outcomes from A level performance
[image:23.595.76.529.207.513.2]Table 3.3 shows the size of the coefficients from models 2 and 3 in Table 3.2, which model the impact of including average A level points scores and total A level points scores respectively.
Table 3.3 - Multilevel ordered categorical regression of degree classification comparing average and
total A level points scores
Model 2 Model 3
E1 E2 E3 E1 E2 E3
Constant 3.928 1.280 -2.164 3.849 1.259 -2.090
Average A level points (30) 0.747 0.601 0.791
Total A level points (30) 0.089 0.068 0.042
Average KS4 points (6) 0.594 0.754 0.639 0.673 0.832 0.914
SAT® ‘English’ (mean Reading and
Writing) score (10)
-0.001 0.014 -0.005 -0.003 0.018 0.004
SAT® Maths score (10) -0.009 -0.025 0.020 -0.018 -0.030 0.015
Prior attainment of university cohort
(UNIdiff )
-1.872 -0.582 -1.718 -1.292 -0.235 -1.156
Grammar school attended -0.415 -0.491
Independent school attended -0.734 -0.514
FE college attended -0.745 -0.798
Number of cases 2754 2754 Goodness of fit (McFadden’s R2) 0.74 0.64
Notes:
Significant coefficients are emboldened
E1 = equation 1 (the probability of achieving 2:2 or higher rather than a third / other degree) E2 = equation 2 (the probability of achieving a first or a 2:1 rather than a 2:2 or lower) E3 = equation 3 (the probability of achieving a first rather than a 2:1 or lower)
of the UNIdiff variable appears particularly large because it represents the difference between a university with a UNIdiff value of 0 per cent (no students with A level grades ABB or AAC or above) and a university with a UNIdiff value of 100 per cent (all students with A level grades ABB or AAC or above). In reality most students will be at universities nearer to the average figure for the sample.
The McFadden's R2is the goodness of fit measure and shows how well the model fits the data. The values for models 2 and 3 are 0.74 and 0.64 respectively. As all the other variables in these two models are the same and they are based on the same students, this suggests that average A level points score is a slightly more useful predictor of degree class than total A level points score. By comparison with these two models, when SAT® scores are used instead of A levels and GCSEs to predict degree class (model 1 in Table 3.2) the McFadden's R2 is only 0.12, indicating a much weaker set of predictors. Models were also run using GCSE and A levels separately (without SAT® scores) and the McFadden's R2values were 0.37 (A level average performance + UNIdiff + school type) and 0.49 (GCSE average performance + UNIdiff + school type). A fuller explanation of McFadden's R2and the values for all the models quoted in this report are given in appendix 4.
As mentioned previously, most models included a total A level points score variable because this was initially felt to be the most appropriate measure of A level performance. When the goodness of fit of each model was calculated, it was found that average A level point score was a slightly more useful predictor of degree class than total A level point score. However, the similarities in the McFadden's R2values for these two models show that there is not a great difference between using total or average A level points scores to predict degree class, and it was therefore not considered necessary to re-run the models that had included the total A level points score variable.
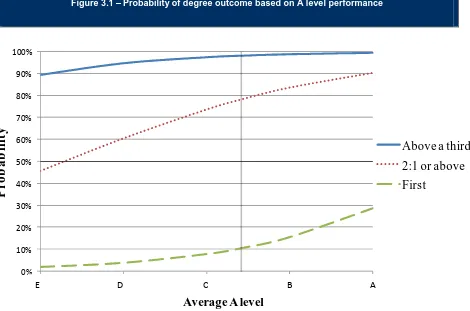
Figure 3.1 – Probability of degree outcome based on A level performance
Figure 3.1 demonstrates the significant relationship between average A level performance and the eventual class of degree obtained. The probability of obtaining an upper second or first class degree increases from a probability of about 46 per cent for students with an average E grade to 90 per cent for students with an average of an A grade. The probability of achieving a first class degree increases from 15 percent for students with an average B grade to 28 per cent for students with an average of an A grade at A level.
There was no significant difference between male and female students or between students from different ethnic groups once prior attainment had been taken into account. This is presumably because any differences (in this sample) are already reflected within their GCSE and A level results.
0% 10% 20% 30% 40% 50% 60% 70% 80% 90% 100%
150 180 210 240 270
P
ro
b
a
b
il
it
y
Average A level
Above a third
2:1 or above First
3.2.2 Predicting degree outcomes from GCSE performance
[image:26.595.72.561.184.547.2]The relationships between degree outcome and A level performance and between degree outcome and GCSE performance are very similar as illustrated in Figure 3.2. These probabilities are based on model 2 from Table 3.2.
Figure 3.2 - Probability of degree outcome based on GCSE performance
0% 10% 20% 30% 40% 50% 60% 70% 80% 90% 100%
40 46 52 58
P
r
o
b
a
b
il
it
y
Average Key Stage 4
Above a third
2:1 or above
First
C B A A*
As can be seen from the figure above, the probability of getting a first class honours degree rather than a 2:1 or below is around five per cent for student with an average of a grade C at GCSE. The probability of achieving first class honours increases to eight percent with an average grade B, 14 per cent with an average grade A and 24 per cent with an average grade A*. There were 322 students in the graduate sample whose GCSE points average was 55 or higher and, therefore, half or more of their GCSE grades were A* (including 52 students with all A* grades - an average 58 points). At the lower end of the model, there were 403 students with an average of grade C at GCSE, rounded to the nearest grade (i.e. an average GCSE points score between 37 and 43). The remaining 1973 students were between these two
3.2.3 Predicting degree outcomes from SAT® performance
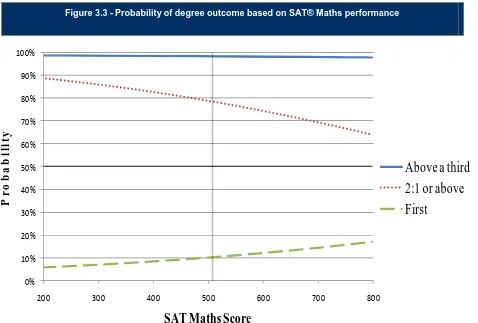
The relationship between degree classification and SAT® scores was not straightforward, in particular the relationship between degree class and the Maths SAT® component scores. High Maths SAT® scores were associated with a higher chance of getting a first,but also a higher chance of getting a 2:2 or less (see Figure 3.3). In other words the highest scores were not always associated with the highest degree classes. When both A level and GCSE performance were excluded (see model 1 in Table 3.2) ‘English’ SAT® scores (the average of the SAT® Reading and Writing scores) had some predictive power across all degree classes. However, when both A level and GCSE performance were included (model 3), high ‘English’ SAT® scores were associated only with a higher chance of getting a 2:1 or higher rather than a 2:2 or less. In the model using average A level points score (model 2) the ‘English’ SAT® scores were not significant. Excluding A level scores from the model (see model 4) did not affect the Maths SAT® coefficients. The coefficients for the ‘English’ SAT® became slightly larger (i.e. it became a slightly better predictor), but still only the 2:2 or less coefficient was significant.
Figure 3.3 - Probability of degree outcome based on SAT® Maths performance
0% 10% 20% 30% 40% 50% 60% 70% 80% 90% 100%
200 300 400 500 600 700 800
P
r
o
b
a
b
il
it
y
SAT Maths Score
Above a third
2:1 or above
First
As can be seen in Figure 3.3, the probability of a student getting a first class honours increases as the Maths SAT® score increases. However, the probability of getting an upper second or above actually decreases (i.e. there is an increased probability of achieving a 2:2 or below). So a student with a Maths SAT® score of 500 has a probability of about 78 per cent of getting a 2:1 or above and around an 11 per cent probability of achieving a first. A student with a much higher Maths SAT® score of 700 has a probability of about 15 per cent of getting a first but the probability of getting a 2:1 or above drops to around 69 per cent. The reasons for this are unclear. The Maths SAT® has no impact on the chances of achieving a third versus higher; the coefficient was not significant.
decisions on the most relevant SAT® components score(s) for the subject of study. It was felt useful therefore to explore the potential utility of the SAT® at a very broad maths / non-maths subject level, by splitting the sample into these two groups.) It was not possible to explore the predictive power of the SAT® at a more specific level because the number of students in some subject groups was too small. However, as can be seen from models 6 and 7 in Table 3.3, which included students taking ‘maths-related’ and ‘non-maths’ degrees respectively, the majority of the SAT® coefficients were again non-significant.
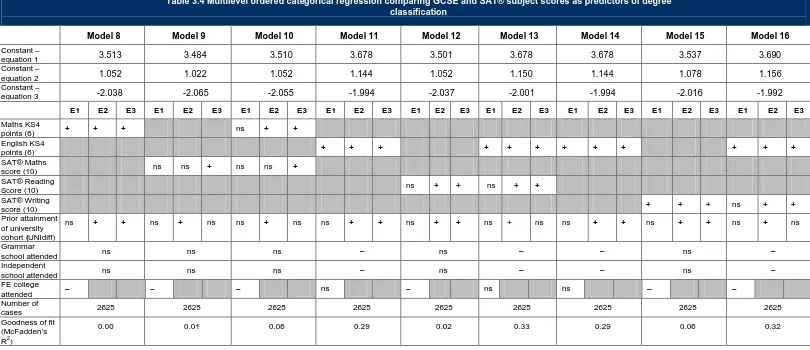
3.2.4 Predicting degree outcomes from specific GCSE or SAT® scores
In exploring the utility of the SAT® for predicting degree outcomes, there was some concern that it was inappropriate to compare SAT® scores reflecting attainment in Reading, Writing and Maths only with average GCSE performance, which reflects attainment over a much larger range of subjects. Models predicting degree outcomes from performance in either GCSE mathematics or GCSE English were therefore compared with models based on performance in the relevant SAT® components (Reading, Writing or Maths). In all of these models, average GCSE points score and total / average A level points score were excluded. A summary of the results is shown in Table 3.4 and the detailed outputs from each model are presented in appendix 3. By comparing effect sizes, GCSE mathematics scores and GCSE English scores were found to be better predictors of degree class than SAT® Maths, SAT® Reading or SAT® Writing scores.
Higher GCSE maths scores were associated with higher degree outcomes, i.e. the higher the GCSE grade the higher the class of degree (model 8). Higher Maths SAT® scores were associated with a higher chance of getting a first class degree only (model 9).
Higher GCSE English scores were associated with higher degree outcomes (model 11). Higher Reading SAT® scores were associated with a higher chance of getting a 2:1 or higher and of getting a first (model 12).
comprehensive schools with the same prior attainment. However, students from grammar schools and independent schools were likely to do less well at university than students from comprehensive schools with the same prior GCSE English attainment (model 11).
The difference in the significance of school type in the models for maths GCSE and English GCSE could suggest school type has differential impact on the GCSE grades that students obtain in these subjects. This could possibly be linked to entry policies for examinations (e.g. tiered papers) and / or examination preparation. Grammar schools and independent schools were not significant in the models predicting degree class based on SAT® performance alone, possibly because there was no preparation for the SAT® and therefore no link between SAT® scores and school type.
The possibility that the type of school attended has more impact on grades achieved in GCSE English than grades achieved in GCSE mathematics has little significance in relation to admissions to HE, given that it relates to two GCSE subjects only. It also emerges from a relatively small study, the primary focus of which was the SAT®. However, it may be something that could be investigated further as part of a wider exploration of the use of contextual data.
Constant –
equation 1 3.513 3.484 3.510 3.678 3.501 3.678 3.678 3.537 3.690
Constant –
equation 2 1.052 1.022 1.052 1.144 1.052 1.150 1.144 1.078 1.156
Constant –
equation 3 -2.038 -2.065 -2.055 -1.994 -2.037 -2.001 -1.994 -2.016 -1.992
E1 E2 E3 E1 E2 E3 E1 E2 E3 E1 E2 E3 E1 E2 E3 E1 E2 E3 E1 E2 E3 E1 E2 E3 E1 E2 E3
Maths KS4
points (6) + + + ns + +
English KS4
points (6) + + + + + + + + + + + +
SAT® Maths
score (10) ns ns + ns ns +
SAT® Reading
Score (10) ns + + ns + +
SAT® Writing
score (10) + + + ns + +
Prior attainment of university cohort(UNIdiff)
ns + + ns + ns ns + ns ns + + ns + + ns + ns ns + + ns + + ns + ns
Grammar
school attended ns ns ns – ns – – ns –
Independent
school attended ns ns ns – ns – – ns –
FE college
attended – – – ns – ns ns – –
Number of
cases 2625 2625 2625 2625 2625 2625 2625 2625 2625
Goodness of fit
[image:31.842.12.822.102.452.2]high percentage of students with A level grades ABB or AAC or above (a high UNIdiff value) - were less likely to achieve as high a class of degree as students from less selective universities with similar attainment.
[image:32.595.77.559.231.589.2]Figure 3.4 illustrates impact of the UNIdiff measure on the probability of degree outcomes, based on model 2 from Table 3.2.
Figure 3.4 Probability of degree outcome based on the UNIdiff value
0% 10% 20% 30% 40% 50% 60% 70% 80% 90% 100%
0 10 20 30 40 50 60 70 80 90
P
r
o
b
a
b
il
it
y
University difficulty (%)
Above a third
2:1 or above
First
Percentage of firstdegreefull-time students with AAC, ABB or above
Using the UNIdiff measure is only one way of defining selective universities and it was considered prudent to explore this finding in a different way. This was done by running two regression analyses: comparing students at universities in the Russell Group18 with students from other universities and comparing students at the Sutton Trust ‘Top 30’19 universities versus other universities. Both of these analyses gave very similar results; for a student of average attainment it was slightly easier to achieve a higher degree (e.g. a first versus lower) in the ‘non-selective’ university group than in the highly selective group. As these were less sophisticated analyses than the multilevel ordered categorical regression models, they are not reported further.
Other potential difficulties in the interpretation of this particular finding had to be overcome. Firstly, there were uneven numbers of students studying within the different broad subject areas and differences between subject areas in the difficulty of obtaining specific degree classes (e.g. first class degrees) could not be reflected in the model because of the small numbers of students in some groups. In order to discover if the UNIdiff finding was common to all subject areas, separate logistic regression models, predicting the probability of getting a first versus any other class of degree, were run for students in each broad area of study (biological sciences, historical and philosophical studies, etc). All of the significant subject results showed an association in the same direction as the graduate sample as a whole. In other words, when the broad subject areas of study were taken into account, it was still harder for students with the same prior attainment to get a first at a university with a high UNIdiff value.
A second difficulty was that the graduate sample included relatively large numbers of students from independent and grammar schools who, in comparison with comprehensive students, had achieved degrees lower than would have been expected from their prior attainment (see 3.2.6 below). Although school type was taken into account in the modelling of the data, it was considered important to ensure that the strength of the UNIdiff finding was not overstated. A further model was therefore run excluding students who had attended either independent schools or grammar schools. In this model the UNIdiff coefficients are similar, and remain significant for equations 1 and 3. This indicates that, for a student of average attainment either from a comprehensive school or an FE college, it is more difficult to obtain a first class honours degree from a highly selective university (i.e. a university
with a high UNIdiff value) than a less selective one. Also, that a student is more likely to get a third class degree, rather than a 2:2 or higher, at a highly selective university than a student with similar attainment at a less selective one.
In almost all subject areas (14 out of 17), the Sutton Trust ‘Top 30’ universities actually gave out proportionally more first class degrees within our sample than the ‘other’ universities, so the UNIdiff finding is not simply due to fewer firsts being awarded at these highly selective universities. It suggests that due to the large number of very able students competing for first class honours, it is more difficult to obtain this classification in highly selective universities than in less selective institutions. Although this finding goes beyond the objectives of the study it emerged as a by-product of the main analysis and as such has been reported. To what extent students are already aware of this when applying to universities is unclear and whether they are nevertheless prepared to join such highly competitive environments due to the ‘market value’ of the degrees they obtain when they graduate.
3.2.6 Type of school or college attended
Figure 3.5 Probability of degree outcome by school type (based on model 2 from Table 3.2)
comprehensive student with grades BBB is likely to perform as well at university as an independent or grammar school student with grades ABB or AAB.
One perceived potential complication with this finding was the extent to which students from the various types of schools were disproportionately distributed in the highly selective universities. Students from independent schools and grammar schools tended on average to attend universities with UNIDiff values that were significantly higher than those attended by students from comprehensive schools or FE colleges. (The mean UNIdiff values by school type were 55 per cent, 42 per cent, 25 per cent and 30 per cent respectively.). However the model includes both the UNIDiff variable and school types meaning that there is still a significant difference attributable to school type over and above what is accounted for by the selectiveness of the university (UNIDiff). In other words, although independent and grammar school students disproportionately go to more selective universities they still perform less well than their peers. In one of the models reported later (section 5.1 and model 19 in appendix 3), students from the most highly selective universities (the Sutton Trust Top 30) were excluded, yet the grammar school and independent school coefficients were still significant. In other words students from independent and grammar schools are performing below expectations in other universities, not just the highly selective ones.
3.3
Findings published in previous reports
In the initial phase of the research, relationships between the SAT® and other attainment measures were explored.
Relationships between the SAT® and other attainment measures
(Kirkup et al., 2007)
The mean SAT® scores of the study sample were very similar to US mean scores and individual items functioned in a similar way in comparable samples of UK and US students.
The correlation between A level scores and SAT® scores was 0.64 (i.e. high A level scores were generally associated with high scores on the SAT®).
SAT® scores and total A level points related in similar ways to a number of educational and socio-economic factors (type of institution attended, ethnicity, eligibility for free school meals, etc), i.e. some groups performed less well across a range of attainment measures.
Female students had higher total GCSE and A level point scores and achieved significantly higher scores on the SAT® Writing component than male students. Male students performed significantly better on the SAT® Mathematics component and on the SAT® as a whole.
More detailed analyses examined the relationships between the components of the SAT® and specific A level subjects.
Relationships between the SAT® and A level subjects
(Kirkupet al., 2009)
The relationships between the SAT® components and A level subjects were not all the same. SAT® Maths was more strongly related to A level grades in predominately science based subjects whereas Critical Reading and Writing were more closely related to subjects such as History and English A levels.
The mean SAT® scores associated with particular grades of A levels were at different levels for different subjects. (For example, the mean SAT® Maths score of students obtaining an A or B grade in Physics was over 600, whereas for Geography it was around 500.) This could be seen as reflecting a difference in the difficulty of different A level subjects.
Students studying A level mathematics achieved significantly higher SAT® Maths scores compared with those students not studying A level mathematics. This increase was similar for male and female students. The increase in SAT® Reading and Writing scores for students studying English at A level (compared with those not taking English) was somewhat greater for male students than for female students.
A subsequent analysis phase explored the relationships between the various attainment measures (including the SAT®) and participation in HE. The minimum entry points requirement for each HE course was obtained (wherever possible) in order to evaluate whether students had obtained places on courses commensurate with their prior attainment. These relationships were first explored using 2006 HE entry data only and were subsequently updated using combined 2006 and 2007 entry data (to include gap year students, deferred entrants, etc).
Relationships between attainment and HE participation
(Kirkupet al., 2010)
Performance at A level was the strongest predictor of participation in HE and of obtaining a place on a ‘prestigious’ course with high entry point requirements. Prior attainment at GCSE and SAT® scores were also significant. For students with similar A level and GCSE attainment and similar background characteristics, but different SAT® scores, those with higher SAT® scores were more likely to be in HE. Relationships between HE destinations and students’ background characteristics were as follows:
Comparing participants in the studywith similar prior attainment:
Girls were more likely to be in HE than boys.
Asian and Black participants were more likely to be in HE and Chinese participants less likely to be in HE compared with White participants.
Participants with English as an additional language (EAL) were more likely to be in HE than those with English as a first language.
Within HE, girls tended to enter courses with lower entry requirements than would be expected compared with boys.
Asian students and EAL students tended to enter courses with higher entry requirements than would be expected compared with white students and non-EAL students respectively.
3.4
Summary of section 3
The primary aim of the study was to examine whether the addition of the SAT® alongside A levels is better able to predict HE participation and outcomes than A levels alone.
As reported previously, higher SAT® scores are associated with participation in HE but less strongly than either GCSEs or A levels.
‘English’ SAT® (mean Reading and Writing) scores correlate with degree classification outcomes and in the absence of any other reliable measures could be used to give some prediction of HE performance. However, the SAT® adds very little predictive power when combined with GCSE data only and does not provide any additional predictive power when both average A level and average GCSE performance are taken into account. Although the currently available data from GCSEs and A levels does not always provide sufficient information to resolve all HE admissions decisions, this research indicates that adopting the SAT® would not provide a solution to predicting undergraduate success in the UK.
In addition to the main finding in respect of the SAT®, several other general findings have emerged from modelling the degree outcome data. Some of these support research carried out elsewhere.
The relationship between degree performance, prior attainment and the type of school attended suggests that students from comprehensive schools are likely to do better in HE than students with similar attainment from grammar and independent schools.
Girls are more likely to be in HE than boys with similar attainment, yet girls tend to enter courses with lower entry requirements than would be expected from their attainment compared with boys.
Neither gender nor ethnicity is significantly related to degree outcome, when prior attainment is taken into account, e.g. male students are neither more likely nor less likely to do better at university than female students with the same prior attainment.
4 Disadvantaged students
One specific issue for the study to address was whether the SAT® could identify students with the potential to benefit from higher education whose ability was not adequately reflected in their A level results because of their (economically or educationally) disadvantaged circumstances. In the past, an argument put forward for the SAT® is that it measures aptitude rather than attainment and is therefore less dependent on a student’s socioeconomic background and schooling – although the evidence does not unequivocally support this view (see McDonald et al., 2001). In the McDonald study (using three samples of students from low-attaining schools, high-attaining schools and independent schools), students were placed into three bands on the basis of their mean A level scores. Within each band, SAT® test scores tended to be lowest in the low-attaining schools and highest in the independent schools. However, the relationship between A levels and the SAT® was not a strong one; some students who scored highly on one measure did not do so on the other. It was reported that using SAT® scores in addition to A levels as a basis for selection to HE would increase the number of students considered for selection in all three samples. However, the percentage increase in the number of students that would be considered was highest in the low-attaining schools.
Assuming A levels do not adequately reflect the ability of some disadvantaged students, it would be likely that such students might exhibit inconsistent performance, i.e. perform better on the SAT® than in their A levels. Those who continue with further study would then be expected to do better than would be predicted by their A levels in HE. The thinking here is that it is only those with inconsistent performance who would be likely to benefit from the introduction of SAT®; those whose overall performance is well-reflected by A level would not be affected by the additional measure.
4.1
Measures of disadvantage
4.2
Analysis of interactions between measures of disadvantage
and degree outcomes
In order to see if the SAT® could identify those with the potential to benefit from HE, interaction terms were added to one of the models. Interaction terms look at variables in combination, in this case in pairs, to see if there is any differential relationship between them and degree outcome. For example, to examine how various measures of disadvantage, such as eligibility for free school meals, interact with attainment measures and the resultant impact on degree outcomes. Interactions between FSM, IDACI, sex, school-level GCSE performance, school-level HE progression rates, with each of average GCSE scores, English SAT® and Maths SAT® scores, were considered together with interactions between both English SAT® scores and Maths SAT® scores with A level point scores. Interactions with prior attainment (A level and GCSE) were included in the analysis so that we could ascertain whether the SAT® can indicate potential for certain types of students (e.g. boys, those from deprived areas, those from lower performing schools, those from schools that have lower HE continuation rates, those who were eligible for FSM), over and above what is indicated by their GCSE and A level scores.
Initially a model was constructed that included all the interaction terms, regardless of statistical significance. As so many of the interaction terms were not significant, the model was refined by removing those interactions that were furthest from being significant. As many of the variables and interactions are closely related to each other, when some of these non-significant interactions were removed from the model, changes to the behaviour of other interactions occurred, going from being significant to being non-significant or vice versa (a feature called co-linearity). Part of the process of modelling is to judge which ones to retain and which to remove. In a final version of the model there was a significant interaction between students’ average GCSE performance and school-level HE progression rates. This shows that a student with a high GCSE score who attends a school from which many students go on to HE is more likely to get a better class of degree than a student with a high GCSE score from a school with fewer students continuing into HE. Alternatively, comparing students from schools with similar HE progression rates, those with higher GCSE scores are more likely to get better degrees.
degree class from prior attainment alone is not straightforward, as attainment is mediated by many other factors.
The McFadden’s R2 of the final model was 0.66. This is slightly higher than the McFadden’s R2for model 3 (0.64) which is identical apart from the interaction terms. This indicates that while statistically significant, the interaction terms are only adding a small amount of additional information to the model.
The outputs from the final interaction model discussed above are presented in Table A3.17 in appendix 3.
4.3
Findings published in previous reports
In earlier phases of the research, relationships between the SAT®, attainment and background characteristics were explored. In these analyses it was found that performance on the SAT® was not independent of social background.
Score differences between different groups on the SAT® are well documented but are also found in most other measures of educational achievement (Camara and Schmidt, 1999). This was also the case in the current study with differences in all the main attainment measures (A levels, GCSEs and the SAT®) according to a number of different background variables (FSM eligibility, ethnicity, EAL, etc).
Relationships between the SAT® and background characteristics
(Kirkup et al., 2009)
Two measures of affluence / deprivation were used: one (IDACI – Income Deprivation Affecting Children Index) was from the Pupil Level Annual School Census (PLASC), and the other was based on students’ questionnaire responses.
When prior attainment at GCSE was not taken into account, students from schools with a higher IDACI index (i.e. from areas of low income households) did less well on the SAT® than students from less deprived areas with similar A level attainment. However, if prior attainment was included, students with similar A level and GCSE points performed similarly on the SAT® irrespective of household income.
In a later phase of the research, the factors affecting participation in HE were explored, with a particular focus on students in educationally or economically disadvantaged circumstances.
Relationships between attainment and HE participation
(Kirkupet al., 2010)
Performance at A level was the strongest predictor of participation in HE and of obtaining a place on a course with high entry point requirements. Prior attainment at GCSE and SAT® scores were also significant. Relationships between HE destinations and disadvantaged circumstances were as follows:
Comparing students in HE from maintained schools:
Students from more deprived areas were on average just as likely to be studying at more prestigious institutions (or on courses for which there is fierce competition), as students from less deprived areas with similar attainment and background characteristics.
Comparing students in HE from both maintained and non-maintained schools (regression analysis using an affluence measure based on students’ survey responses):
More affluent students were more likely to be studying on courses with high entry point requirements than might be expected from their attainment.
Participation in HE was also related to school-level performance:
GCSE performance at school level was positively related to the entry points of students’ HE courses; i.e. students from high performing schools were more likely to achieve places on courses with high entry requirements than students from low performing schools when comparing students with the same level of attainment.
4.4
Summary of section 4
5 High-achieving A level students
As stated in section 2.3, one of the main aims of the research was to ascertain:
Can the SAT® distinguish helpfully between the most able applicants who get straight A grades at A level?
In an earlier phase of the project it was discovered that there was considerable variation in the SAT® scores of those students who had gained three or more A grades at A level. This finding suggested that the SAT® might be useful to HE admissions staff to help them differentiate between candidates from this high-ability group, should the SAT® prove to be a valid predictor of degree outcomes.
In the graduate sample, 533 students had a minimum of three A grades at A level. The degrees obtained by these high-achieving A level students are shown in Table 5.1.
Table 5.1 Degree classification outcomes for high-achieving A level students
Number of A grades at A level First 2:1 2:2 3rd /
other
Total
Three 72 206 25 4 307
Four 48 125 6 0 179
Five 12 25 3 0 40
Six 5 2 0 0 7
Total 137 358 34 4 533
Per cent 25.7 67.2 6.4 0.8 100
Graduate sample (per cent) 11.8 58.6 25.9 3.7 100
Due to rounding, percentages may not sum to 100.
class, then the variation in SAT® test scores amongst this group might be helpful in the selection of applicants for HE.
Correlations were calculated between degree outcomes and the various measures of prior attainment (including SAT® scores). Due to the small size of this sub-sample and the restriction in the range of scores and degree outcomes, it was expected that these correlations would be relatively small compared to the graduate sample as a whole (see section 3.1). The correlations with degree class (in order of size) were:
average A level points score (0.16)
average KS4 (GCSE) points score (0.15)
SAT® Writing score (0.11)
SAT® Reading score (0.09)
SAT® Maths score (0.09)
Unfortunately, due to the small number of students with three or more A grades and insufficient variation in the degree outcomes it was not possible to use a multilevel ordered categorical model for this particular group of students only; the model failed to converge21. Two alternative means of exploring this issue were devised; firstly using the whole graduate sample and secondly using an alternative group of high-achieving A level students, as described in section 5.1 below. A multilevel ordered categorical