VALIDATION OF ARTEMETHER AND LUMEFANTRINE IN
POWDER FOR ORAL SUSPENSION DOSAGE FORM BY
RP-HPLC
A Dissertation Submitted to
THE TAMILNADU Dr. M.G.R MEDICAL UNIVERSITY
CHENNAI - 600 032.
In Partial fulfillment for the award of the degree of
MASTER OF PHARMACY IN
PHARMACEUTICAL ANALYSIS
Submitted By
NAME: EZHILVANI. A Reg.No: 261530204
Under the guidance of
Dr. I. CAROLIN NIMILA, M.Pharm., Ph.D.,
Assistant Professor,
DEPARTMENT OF PHARMACEUTICAL ANALYSIS.
J.K.K.NATTRAJA COLLEGE OF PHARMACY,
KUMARAPALAYAM-638183,
TAMILNADU.
This is to certify that the dissertation work entitled “AANNAALLYYTTIICCAAL L
M
MEETTHHOODD DDEEVVEELLOOPPMMEENNTT ANANDD MEMETTHHOODD VAVALLIIDDAATTIIOONN OOFF
A
ARRTTEEMMEETTHHEERR ANANDD LLUUMMEEFFAANNTTRRIINNEE ININ PPOOWWDDEERR FOFORR OORRAALL
S
SUUSSPPEENNSSIIOONN DODOSSAGAGEE FFOORRMM BBYY RPRP--HHPPLCLC ”, submitted by the student bearing Reg. No: 261530204 to “The Tamil Nadu Dr.M.G.R.Medical University – Chennai” , in partial fulfillment for the award of Degree of
Master of Pharmacy in Pharmaceutical Analysis was evaluated by us during
the examination held on………..……….
This is to certify that the work embodied in this dissertation “AANNAALLYYTITICCAAL L
M
MEETTHHOODD DDEEVVEELLOOPPMMEENNTT ANANDD MEMETTHHOODD VAVALLIIDDAATTIIOONN OOFF
A
ARRTTEEMMEETTHHEERR ANANDD LLUUMMEEFFAANNTTRRIINNEE ININ PPOOWWDDEERR FOFORR OORRAALL
S
SUUSSPPEENNSSIIOONN DODOSSAAGGEE FFOORRMM BBYY RPRP--HHPPLLCC”, submitted to “The Tamil Nadu Dr.M.G.R.Medical University”, Chennai, was carried out by Mrs. A. EZHILVANI
[Reg.No: 261530204], for the Partial fulfillment of degree of MASTER OF PHARMACY in PHARMACEUTICAL ANALYSIS under my guidance and
supervision during the academic year 2016-2017
Dr. I. CAROLIN NIMILA, M.Pharm., Ph.D., Dr.V.SEKAR, M.Pharm., Ph.D.,
Guide and Assistant Professor. Professor and HOD.
Dr. R. SAMBATH KUMAR, M.Pharm., Ph.D.,
Principal.
.
This is to certify that the work embodied in this dissertation entitled “AANNAALLYYTTICICAALL MEMETTHHOODD DDEEVVEELLOOPPMMEENNTT ANANDD MEMETTHHOODD VAVALLIDIDAATTIIOONN O
OFF ARARTTEEMMEETTHHEERR AANNDD LULUMEMEFFAANNTTRRIINNEE IINN POPOWWDDEERR FFOORR OORRAALL
S
SUUSSPPEENNSSIIOONN DDOOSSAAGGEE FOFORRMM BYBY RRPP--HHPPLLCC ”, submitted to “The Tamil Nadu Dr. M.G.R. Medical University- Chennai”, in partial fulfillment to the requirement
for the award of Degree of MASTER OF PHARMACY in PHARMACEUTICAL ANALYSIS, is a bonafide work carried out by Mrs. A.EZHILVANI,
[Reg.No.261530204] during the academic year 2016-2017, under the guidance and
supervision of Dr . I . CA RO L I N NI M I L A , M.Pharm., Ph.D., Assistant Professor of pharmaceutical Analysis, J.K.K. Nattraja College of Pharmacy, Kumarapalayam.
Place: Kumarapalayam Dr. R. SAMBATHKUMAR, M.Pharm, Ph.D.,
Date: Professor & Principal,
J.K.K.Nattraja College of Pharmacy. Kumarapalayam-638 183,
Tamil Nadu.
This is to certify that the work embodied in this dissertation
“ANANAALLYYTTICICAALL MEMETTHHOODD DDEEVVEELLOOPPMMEENNTT ANANDD MEMETTHHOODD VAVALLIDIDAATTIIOONN
O
OFF ARARTTEEMMEETTHHEERR AANNDD LULUMEMEFFAANNTTRRIINNEE IINN POPOWWDDEERR FFOORR OORRAALL
S
SUUSSPPEENNSSIIOONN DODOSSAAGGEE FOFORRMM BYBY RRPP--HHPPLLCC” submitted in partial fulfillment to “The Tamil Nadu Dr.M.G.R. Medical University, Chennai”, in the requirement
for the award of degree of MASTER OF PHARMACY in PHARMACEUTICAL
ANALYSIS, is a bonafide work carried out by Mrs. A. EZHILVANI, [Reg. No.
261530204] during the academic year 2016-2017, under my guidance and direct supervision in the department of Pharmaceutical analysis, J.K.K.Nataraja College of Pharmacy, Kumarapalayam.
Dr. I. CAROLIN NIMILA M.Pharm., Ph.D.,
Assistant Professor,
Department of Pharmaceutical Analysis, J.K.K.Nataraja college of Pharmacy, Kumarapalayam - 638183,
Tamil Nadu. PLACE: Kumarapalayam
DATE :
DECLARATION
The work presented in this dissertation entitled “AANNAALLYYTTIICCAALL MEMETTHHOODD D
DEEVVEELLOOPPMMEENNTT ANANDD MEMETTHHOODD VAVALLIIDDAATTIIOONN OFOF ARARTTEEMMEETTHHEERR ANANDD
L
LUUMMEEFAFANNTTRRIINNEE ININ PPOOWWDDEERR FOFORR ORORAALL SSUUSSPPEENNSSIOIONN DODOSSAAGGEE FFOORRMM
B
BYY RPRP--HHPPLLCC” was carried out by me, under the direct supervision of Dr.I.CAROLIN NIMILA, M.Pharm., Ph.D., Assistant Professer of Pharmaceutical
Analysis, J.K.K.Nattaraja College of Pharmacy, Kumarapalayam.
I further declare that this work is original and this dissertation has not been submitted previously for the award of any other degree, diploma, associate ship and fellowship or any other similar title. The information furnished in this dissertation is genuine to the best of my knowledge.
A. EZHILVANI,
Reg.No:261530204,
PLACE: Kumarapalayam
ACKNOWLEDGEMENT
Firstly, I am many more thankful to the God for blessing me to have a great strength and courage to complete my dissertation. Behind every success there are lots of efforts, but efforts are fruitful due to hands making the passage smoother. So, I am thankful to all those hands and people who made my work grand success.
I am proud to dedicate my humblest regards and deep sense of gratitude and heartfelt thanks to late Thiru. J.K.K. NATARAJAH CHETTIAR, founder of our college. I wish to express my sincere thanks to our most respectful correspondent Tmt. N. SENDAMARAI and our beloved Managing Director Mr. S. OMM SHARRAVANA, B.Com., LLB., for enabling us to do the project work.
I take this opportunity with pride and immense pleasure expressing my deep sense of gratitude to our respectable and beloved guide Dr. I. CAROLIN NIMILA, M.Pharm., Ph.D., Assistant Professer, Department of Pharmaceutical Analysis
J.K.K.Nattaraja College of Pharmacy, whose active guidance, innovative ideas, constant inspiration, untiring efforts help encouragement and continuous supervision has made the presentation of dissertation a grand and glaring success to complete this research work successfully.
I express my heartful thanks to our beloved Dr. R. SAMBATH KUMAR, M.Pharm., Ph.D., Principal, J.K.K. Nattaraja College of Pharmacy,
Kumarapalayam. For his indispensable support which enable us to complete this task vast success.
I would like to extend my thanks, gratitude and most respectful regards to Dr. HARIHARA SUBRAMANIAN, M.Pharm, Ph.D., General Manager, Caplin
Point Laboratories limited, Chennai for his encouragement , invaluable assistance, observation, suggestion and cooperation in dealing and bringing out this project work successfully.
I am very thankful to Mr.Saravanan, Mr.Anandraj, Mr.Karuna and Mr.Vigneshwaran all the employees for giving their support, kind cooperation and
valuable suggestions to complete this project work.
My glorious acknowledgement to Dr. K.SENGODAN, M.B.B.S., administrative officer for encouraging us in a kind and generous manner to complete this work.
A. EZHILVANI
Dedicated
to
Almighty
My Beloved Parents,
Husband,
&
LIST OF ABBRAVATIONS
API Active pharmaceutical Ingredient
CGLP Current Good Laboratories Practices
CGMP Current Good Manufactures Practices
CV Co-efficient of Variation
°c Degree centigrade
FTIR Fourier Transmission Infra Red
ICH International Conference on Harmonization of
K Capacity factor
LOD Limit of detection
LOQ Limit of Quantitation
mg Milligram
mcg microgram
mL Milliliter
mg/mL Milligram per milliliter
N Plate number
NLT Not less than
NMT Not more than
nm Nanometer
PDA Photo Diode Array
RI Refractive Index
RP-HPLC Reverse phase High Performance Liquid Chromatography
RS Resolution
RSD Relative Standard Deviation
RT Retention time
USP United States Pharmacopoeia
UV Ultra violet
v/v Volume per volume
µg Micro gram
µg/mL Microgram per Milliliter
ppm Parts per million
Fig Figure
ART Artemether
TABLE OF CONTENTS
SI. No CONTENTS Page No.
01
INTRODUCTION
01 - 37
02
LITERATURE REVIEW
38 - 49
03
AIM AND PLAN OF WORK
50 – 51
04
DRUG PROFILE
52– 56
05
MATERIALS AND INSTRUMENT
USED
57 – 58
06
METHOD DEVELOPMENT AND
VALIDATION
59 – 80
07
CHROMATOGRAMS
81 – 138
08
RESULTS AND DISCUSSION
139 – 162
09
CONCLUSION
163
1. INTRODUCTION
The pharmaceutical analysis is a branch of chemistry, which involves the series of
process for the identification, determination, quantization, and purification. This is
mainly used for the separation of the components from the mixture and for the
determination of the structure of the compounds. The different pharmaceutical agents
are as follows:
1. Plants
2. Microorganisms
3. Minerals
4. Synthetic compounds
Based upon the determination type, there are mainly two types of analytical methods.
They are as follows:
1. Qualitative analysis: This method is used for the identification of the
chemical compounds.
2. Quantitative analysis: This method is used for the determination of the
amount of the sample.
Types of Analytical Methods
Analytical methods are mainly of the following two types:
1. Classical methods:
1. Gravimetry: The weight of the sample is determined after the
Chapter – 1 Introduction
Dept. of Pharmaceutial Analysis 2 J.K.K.Nattraja College of Pharmacy 2. Titrimetry: The volume of the solution is determined after the reaction
such as neutralization, complex formation, precipitate formation, and
oxidation and reduction.
3. Volumetry: The volume of the gas evolved by the reaction is
determined.
2. Instrumental methods:
1. Electrochemical methods: Used for the measurement of the current,
voltage, or resistance.
Examples: Conductometry: Measurement of the conductance.
Potentiometry: Measurement of the potential.
Coulometry: Measurement of the current.
Voltametry: Measurement of the current at specified
voltage.
2. Optical methods: Based upon the measurement of radiation absorbed
or emitted
Absorption methods : Visible, Ultraviolet (UV), Infrared (IR), Atomic
Absorption Spectroscopy (AAS)
Emission methods: Plasma emission spectroscopy, flame
spectroscopy, and fluorimetry.
3. Chromatography: paper, High Pressure Liquid Chromatography
(HPLC), Gas Chromatography (GC), ion exchange, Thin Layer
4. Thermal methods: Differential Thermal Analysis (DTA),
Thermogravimetric (TG), and Differential Scanning Calorimetry
(DSC).
5. Other methods: X-ray diffractometry, radioactive methods, mass
spectrometry, refractometry and polarimetry.
Pharmaceutical analysis deals not only with medicaments (drugs and
formulations), but also with their precursors i.e. with the raw material whose degree
of purity, which in turn decides the quality of medicaments. The quality of a drug is
determined, after establishing its authenticity, which is carried by testing its purity and
the quality of the pure substance in the drug and its formulations.
HIGH-PERFORMANCE LIQUID CHROMATOGRAPHY (HPLC):
High-performance liquid chromatography is a chromatographic technique
used to separate the components in a mixture, to identify each component, and to
quantify each component .The method involves a liquid sample being passed over a
solid adsorbent material packed into a column using a flow of liquid solvent. Each
analyte in the sample interacts slightly differently with the adsorbent material, thus
retarding the flow of the analytes. If the interaction is weak and the analytes flow off
the column in a short amount of time, and if the interaction is strong, then the elution
time is long.
Chromatography may be defined as a method of separating a mixture of
components into individual components through equilibrium distribution between two
Chapter – 1 Introduction
Dept. of Pharmaceutial Analysis 4 J.K.K.Nattraja College of Pharmacy The schematic representation of an HPLC instrument typically includes a
sampler, pumps, and a detector. The sampler brings the sample mixture into the
mobile phase stream which carries it into the column. The pumps deliver the desired
flow and composition of the mobile phase through the column. The detector generates
a signal proportional to the amount of sample component emerging from the column,
hence allowing for quantitative analysis of the sample components. A digital
microprocessor and user software control the HPLC instrument and provide data
analysis. Some models of mechanical pumps in a HPLC instrument can mix multiple
solvents together in ratios changing in time, generating a composition gradient in the
mobile phase. Various detectors are in common use, such as UV/V is, photodiode
array (PDA) or Refractive index (RI).
CHROMATOGRAPHY AND ITS TYPES
HPLC techniques are classified on the following types:
• Based on the modes of chromatography (based on the polarity of stationary
and mobile phase):
Normal phase mode: Stationary phase is polar e.g., silica gel and mobile phase is
non-polar.
Reverse phase mode: Stationary phase is non-polar and mobile phase is polar.
In normal phase mode, non-polar compounds travel faster and are eluted first.
This is because of less affinity between solute and stationary phase. Polar
compounds are retained longer time in the column because of more affinity
In reverse phase mode, polar compounds get eluted first and non-polar
compounds are retained for a longer time. Since most of the drugs and
pharmaceuticals are polar in nature and not retained for a longer time and
eluted faster.
Chromatography is a family of analytical chemistry techniques for the
separation of mixtures. It involves passing the sample, a mixture that contains the
analyte, in the "mobile phase", often in a stream of solvent, through the "stationary
phase." The stationary phase retards the passage of the components of the sample.
When components pass through the system at different rates they become separated in
time, like runners in a marathon. Ideally, each component has a characteristic time of
passage through the system. This is called its "retention time."
A physical separation method in which the components of a mixture are
separated by differences in their distribution between two phases, one of which is
stationary (stationary phase) while the other (mobile phase) moves through it in a
definite direction. The substances must interact with the stationary phase to be
retained and separated by it.
A chromatograph takes a chemical mixture carried by liquid or gas and
separates it into its component parts as a result of differential distributions of the
solutes as they flow around or over a stationary liquid or solid phase. Various
techniques for the separation of complex mixtures rely on the differential affinities of
substances for a gas or liquid mobile medium and for a stationary adsorbing medium
Chapter – 1 Introduction
Dept. of Pharmaceutial Analysis 6 J.K.K.Nattraja College of Pharmacy Analytical chromatography is used to determine the identity and concentration
of molecules in a mixture. Preparative chromatography is used to purify larger
quantities of a molecular species.
Based on the principle of separation:
1. Adsorption chromatography: Separation of compounds based on the
difference in affinity of compounds towards stationary phase. Most
widely used stationary phase is unmodified silica which allows high
efficiency and high permeability. The functional group responsible for
adsorption is silanol group which reacts with sample solutes by
hydrogen bonding.
2. Ion exchange chromatography: Separation of compounds based on
ion exchange of functional groups. In this ion exchange, resins are
used to separate a mixture of similar charged ions. The retention of the
ions on the column depends on the ionic strength and PH of the mobile
phase. Types of ion exchangers include the following:
1. Polystyrene resins: These allow cross linkage which increases
the stability of the chain. Higher cross linkage reduces
swerving, which increases the equilibration time and ultimately
improves selectivity.
2. Cellulose and dextran ion exchangers (gels): These possess
larger pore sizes and low charge densities making them suitable
for protein separation.
3. Controlled-pore glass or porous silica: In general, ion
exchangers favour the binding of ions of higher charge and
3. Ion pair chromatography: In this reverse phase, column is converted
temporarily into ion exchange column using compounds such as
pentane or hexane or heptanes or octane with sulphonic acid sodium
salt, tetra methyl or ethyl ammonium hydroxide.
4. Size exclusion chromatography (gel permeation chromatography):
Separation is based on the different molecular size compounds
separated by using different gels.
Example: Dextran, agarose, polyacrylamide gels. This technique is
widely used for the determination of molecular weight of
polysaccharides.
5. Affinity chromatography: Separation is based on the affinity of the
sample with specific stationary phases.
6. Chiral phase chromatography: Separation of optical isomers using
chiral stationary phases.
• Based on elution technique:
1. Isocratic separation: Same mobile-phase combination is used
throughout the process of separation.
2. Gradient separation: Mobile-phase combination of lower polarity or
elution strength is used followed by gradually increasing the polarity or
elution strength.
• Based on scale of operation:
1. Analytical HPLC
Chapter – 1 Introduction
Dept. of Pharmaceutial Analysis 8 J.K.K.Nattraja College of Pharmacy 2. Preparative HPLC
Example: Individual fractions of samples are analysed (mg). (A.H
Beckett et.al)2
COMPONENTS OF HPLC SYSTEM:
Pump
Pump generates a flow of elute from the solvent reservoir to the system. Most
pumps used in current LC system generate the flow by back-and forth motion of a
motor –driven piston. (Reciprocating pumps). Because of this piston motion, it
produces “pulses”. There have been large system improvements to reduce this
pulsation and the recent pumps create much less pulse compared to the older ones.
Recent analysis requires very high sensitivity to quantify a small amount of analytes,
and thus even a minor change in the flow rate can influence the analysis. Therefore,
the pumps required for the high sensitivity analysis needs to be highly precise.
Injector
An injector is placed next to the pump. The simplest method is to use a
syringe, and the sample is introduced to the flow of eluent. Since the precision of LC
measurement is largely affected by the reproducibility of sample injection, the design
of injector is an important factor. The most widely used injection method is based on
sampling loops. The use of auto sampler (auto-injector) system is also widely used
Figure1.1 Instumentation of HPLC
Column
The separation is performed inside the column; therefore, it can be said that the
column is the heart of an LC system. The packing material generally used is silica or
polymer gels. The eluent used for LC varies from acidic to basic solvents. Most
column housing is made of stainless steel, since stainless is tolerant towards a large
variety of solvents. However, for the analysis of some analytes such as biomolecules
and ionic compounds, contact with metals is not desired, thus polyether ether ketone
(PEEK) column housing is used instead.
Detector
Separation of analytes is performed inside the column, Whereas a detector is used
to observe the obtained separation .The composition of the eluent is consistent when
no analyte is present .While the presence of analyte changes the composition of the
eluent. What detector does is to measure these differences. This difference is
Chapter – 1 Introduction
Dept. of Pharmaceutial Analysis 10 J.K.K.Nattraja College of Pharmacy On-line detectors
Refractive index
UV/Vis Fixed wave length
UV/Vis variable wave length
UV/Vis Diode array
Fluorescence
Conductivity
Mass –Spectrometric (LC/MS)
Evaporative light scattering
Off-line detector
• FTIR spiral disk monitor requires sample transfer on the germanium disk and
following scanning in FTIR instrument.
Recorder
The change in eluent detected by a detector is in the form of electronic signal,
and thus it is still not visible to our eyes. Nowadays, computer based data processor
(integrator) is more common .There are software that are specifically designed for LC
system. It provides not only data acquisition, but features like peak-fitting, base line
correction, automatic concentration calculation, molecular weight determination, etc.
Degasser
The eluent used for LC analysis may contain gases such as oxygen that are
non-visible to our eyes. When gas is present in the eluent, this is detected as a noise
and causes unstable baseline. Generally used method includes sparging (bubbling of
the method is not convenient and also when the solvent is left for a certain time period
(e.g., during the long analysis), gas will dissolve back gradually. Degasser uses
special polymers membrane tubing to remove gases. The numerous very small pores
on the surface of the polymer tube allow the air to go through while preventing any
liquid to go though the pore. By placing this tubing under low pressure container, it
created pressure differences inside and outside the tubing (higher inside the tubing).
This difference let the dissolved gas to move through the pores and remove the gas.
Compared to classical batch type degassing, the degasser can be used on-line; it is
more convenient and efficient.
Column heater
The LC separation is often largely influenced by the column temperature. Also
for some analysis, such as sugar and organic acid, better resolutions can be obtained at
elevated temperature (50~80oC). It is also important to keep stable temperature to
obtained repeatable results even it is analyzed at around room temperature. There are
possibilities that small different of temperature causes different separation results. The
columns are generally kept inside the column oven (column heater).
(H.H Willard et.al, 1996)3.
INTRODUCTION TO HPLC METHOD DEVELOPMENT
Method development has following steps:
Collect information on sample, define separation goals
Need for special HPLC procedure, sample pretreatment, etc.
Chapter – 1 Introduction
Dept. of Pharmaceutial Analysis 12 J.K.K.Nattraja College of Pharmacy Choose LC method, preliminary run, select best separation conditions
Optimize separation conditions
Check for problems
A good method development strategy should require only as many
experimental runs as are necessary to achieve the desired final result. Finally method
development should be as simple as possible, and it should allow the use of
sophisticated tools such as computer modeling.
The important factors, which are to be taken into account to obtain reliable
quantitative analysis, are:
1. Careful sampling and sample preparation.
2. Appropriate choice of the column.
3. Choice of the operating conditions to obtain the adequate resolution of the
mixture.
4. Reliable performance of the recording and data handling systems. Quantitative calibration
Recover purified material Qualitative method
5. Suitable integration/peak height measurement technique.
6. The mode of calculation best suited for the purpose.
7. Validation of the development method.
(Synder et.al 1983)4.
Careful sampling and sample preparation
Before beginning method development, it is need to review what is known
about the sample in order to define the goals of separation. The sample related
information that is important is summarized in below.
Number of compounds present
Chemical structure
Molecular weight of compounds
pka Values of compounds
UV spectra of compounds
Concentration range of compounds in samples of interest
Sample solubility
The chemical composition of the sample can provide valuable clues for the
best choice of initial conditions for an HPLC separation.
Separation Goals
The goals of HPLC separation need to be specified clearly, which include:
• The use of HPLC to isolate purified sample components for spectral
identification or quantitative analysis.
• It may be necessary to separate all degradants or impurities from a product for
reliable content assay.
Chapter – 1 Introduction
Dept. of Pharmaceutial Analysis 14 J.K.K.Nattraja College of Pharmacy • Whether a signal HPLC procedure is sufficient for a raw material or one or
more different procedure are desired for formulations.
• When the number of samples for analysis at one time is greater than 10, a run
time less than 20 minutes often will be important.
Sample preparation
Sample come in various forms:
• Solution ready for injection.
• Solutions that require dilution, buffering, addition of and internal standard
or other volumetric manipulation.
• Solids must be dissolved or extracted.
• Samples that require pretreatment to remove interference and /or protect the
column or equipment from damage.
Most samples for HPLC analysis require weighing and /or volumetric dilution
before injection. Best results are often obtained when the composition of the sample
solvents is close to that of the mobile phase since this minimizes baseline upset and
other problems. Some samples require a partial separation (pretreatment) prior to
HPLC, because of need to remove interference, concentrate sample analyte or
eliminate “column killers”.
The samples may be of two types, regular or special. The regular samples are
typical mixtures of small molecules (<2000Da) that can be separated by normal
starting conditions. Whereas special samples are better separated under customized
conditions given below.
Choice of the column
The separation of the column in HPLC is somewhat similar to the selection of
separation mechanism is based on inductive forces, dipole-dipole interactions and
hydrogen bond formation. In case of ion-exchange chromatography, the separation is
based on the differences in the charge, size of the ions generated by the sample
molecules and the nature of ionisable group on the stationary phase. In case of size –
exclusion chromatography the selection of the column is based on the molecular
weight and size of the sample components. Selection of columns based on the method
is briefly summarized in below.
Method /Description /Columns Preferred Method
Reversed – Phase HPLC
Uses water- organic mobile phase
Columns: C18 (ODS), C8, Phenyl,
trimethylsilyl (TMS), and cyano.
Iron –pair HPLC
Uses water – organic mobile phase, a
buffer to control pH, and an ion –pair
reagent
Columns: C18 , C8, Cyano
Normal-phase HPLC
Uses mixtures of organic solvents as
mobile phase. Columns: cyano, diol,
amino, silica
First choice for most samples, especially
neutral or non-ionized compounds that
dissolve in water-organic mixtures
Acceptable choice for ionic or ionisable
compounds, especially bases or cations.
Good second choice when reserved-phase
or ion-pair HPLC is ineffective; first
choice for lipophilic samples that do not
dissolve well in water-organic mixtures;
first choice for mixtures of isomers and
Chapter – 1 Introduction
Dept. of Pharmaceutial Analysis 16 J.K.K.Nattraja College of Pharmacy Optimization of HPLC method
During the optimization stage, the initial sets of conditions that have evolved
from the first stages of development are improved or maximized in terms of
resolution and peak shape, plate counts asymmetry, capacity factor, elution time,
detection limits, limit of quantitation and overall ability to quantify the specific
analyte of interest. Optimization of a method can follow either of two general
approaches:
Manual
Computer driven
The manual approach involves varying one experimental variable at a time, while
holding all other constant and recording changes in response. The variables might
include flow rate, mobile or stationary phase composition, temperature, detection
wavelength and pH. This approach to system is slow, time consuming and potentially
expensive. However, it may provide a much better understanding of the principles and
theory involved and of interactions of the variables.
In the second approach, computer driven automated method development,
efficiency is optimized while experimental input is minimized. This approach reduce
the time, energy and cost of all instrumental method development.
The various parameters that include to be optimized during method development are
A. Selection of mode of separation.
B. Selection of stationary phase.
C. Selection of mobile phase.
Selection of mode of separation
In reverse phase mode, the mobile phase is comparatively more polar than the
stationary phase. For the separation of polar or moderately polar compounds, the most
preferred mode is reverse phase. The nature of the analyte is the primary factor in the
selection of the mode of separation. A second factor is the nature of the matrix.
Selection of stationary phase
Selection of the column is the first and the most important step in method
development. The appropriate choice of separation column indicates three different
approaches.
Selection of separation
The particle size and nature of the column packing
The physical parameters of the column i.e. the length and the diameter some
of the important parameters considered while selecting chromatographic
columns are
Length and diameter of the column
Packing material
Shape of the particles
Size of the particles
% of carbon loading
Pore volume
Surface area
Reproducibility and reliability
End capping
In this case, the column selected had a particle size of 5µm and an internal
Chapter – 1 Introduction
Dept. of Pharmaceutial Analysis 18 J.K.K.Nattraja College of Pharmacy the information about the analyte. Reversed phase mode of chromatography facilities
a wide range of columns like dimethyl silane (C2), butysilane (C4), octylsilane (C8),
Octadecyslane (C18), base deactivated silane (C18), BDS phenyl, Cyanopropyl (CN),
nitro, amino etc. silica based columns with different cross linking’s in the increasing
order of polarity are as follows:
<………..Non-polar………….moderately polar…………..polar……..>
C18 < C8 < C6 < Phenyl < Amino < Cyano < Silica
C18 was chosen for this study since it is most retentive one. The sample
manipulation becomes easier with this type of column. Generally longer columns
provide better separation due to higher the theoretical plate numbers. Columns with
5µm particle size give the best compromise of efficiency.
Peak shape is equally important in method development. Columns that provide
symmetrical peaks are always preferred while peaks with poor asymmetry can result
in,
• Inaccurate plate number and resolution measurement
• Imprecise quantitation
• Degraded and undetected minor bands in the peaks tail
• Poor retention reproducibility
A useful and practical measurement of peak shape is peak asymmetry
factor and peak tailing factor. Peak asymmetry is measured at 10% of full peak height
and peak tailing factor at 5%. Reproducibility of retention times and capacity factor is
A column which gives separation of all the impurities and degradants from
each other and from analyte peak and which is rugged for variation in mobile phase
shall be selected.
Selection of mobile phase
The primary objective in selection and optimization of mobile phase is to
achieve optimum separation of all the individual impurities and degradants from each
other and from analyte peak.
In liquid chromatography, the solute retention is governed by the solute
distribution factor, which reflects the different interactions of the solute – stationary
phase, solute-mobile phase, and mobile phase-stationary phase. For a given stationary
phase, the nature and the composition of which has to be judiciously selected in order
to get appropriate and required solute retention. The mobile phase has to be adapted in
terms of elution strength (solute retention) and solvent selectivity (solute
separation).Solvent polarity is the key word in the chromatographic separations since
a polar mobile phase will give rise to low solute retention in normal phase and high
solute retention in reverse phase LC. The selectivity will be particularly altered if the
buffer pH is close to the pKa of the analytes. The following are the parameters, which
shall be taken into consideration while selecting and optimizing the mobile phase.
Buffer
pH of the buffer
Mobile phase composition
Buffers if any and its strength
Buffer and its strength play an important role in deciding the peak symmetries
Chapter – 1 Introduction
Dept. of Pharmaceutial Analysis 20 J.K.K.Nattraja College of Pharmacy Phosphate buffers prepared using salts like KH2PO4, K2HPO4, NaH2PO4, and
Na2HPO4.
Phosphoric acid buffers prepared using H3PO4.
Acetate buffers-ammonium acetate, sodium acetate etc.
Acetic acid buffers prepared using CH2COOH.
The retention also depends on the molar strengths of the buffer-molar strength
is increasingly proportional to retention times. The strength of the buffer can be
increasing, if necessary to achieve the required separations. The solvent strength is a
measure of its ability to pull analyte from the column. It is generally controlled by the
concentration of the solvent with the highest strength. The useful pH range for
columns is 2 to 8, since siloxane linkages are cleaved below pH-2 while at pH values
above eight, silica may dissolve.
Mobile phase composition
Most chromatographic separations can be achieved by choosing the optimum
mobile phase composition. This is due to the fact that fairly large amount of
selectively can be achieved by choosing the qualitative and quantitative composition
of aqueous and organic portions. Most widely used solvents in reverse phase
chromatography are methanol and Acetonitrile. Experiments should be conducted
with mobile phases having buffers with different pH and different organic phases to
check for the best separations of analyte peak. A mobile phase which gives separation
of analyte peak
and which is rugged for variation of both aqueous and organic phase by at least +
Selection of Detector
The detector was chosen depending upon some characteristic property of the
analyte like UV absorbance, florescence, conductance, oxidation, reduction etc. The
characteristics that are to be fulfilled by a detector to be used in HPLC determination
are,
High sensitivity facilitating trace analysis
Negligible baseline noise to facilitate lower detection.
Large linear dynamic range.
Low dead volume.
Inexpensive to purchase and operate.
Pharmaceutical ingredients do not absorb all UV light equally, so that
selection of detection wavelength is important. An understanding of the UV light
absorptive properties of the organic impurities and the active pharmaceutical
ingredient is very helpful. For the greatest sensitivity ƛmax should be used. Ultra
violet wavelengths below 200nm should be avoided because detector noise increases
in this region. Higher wave lengths give greater selectivity.
Performance calculations
Carrying out system suitability experiment does the performance calculations.
System suitability experiments can be defined as tests to ensure that the method can
generate results of acceptable accuracy and precision. The requirements for system
suitability are usually developed after method development and validations have been
completed. The criteria selected will be based on the actual performance of the
method as determined during its validation. For example, if sample retention times
form part of the system suitability criteria, their variation SD can be determined
Chapter – 1 Introduction
Dept. of Pharmaceutial Analysis 22 J.K.K.Nattraja College of Pharmacy System suitability might then require that retention times fall within a + 3 SD
range during routine performance of the method.
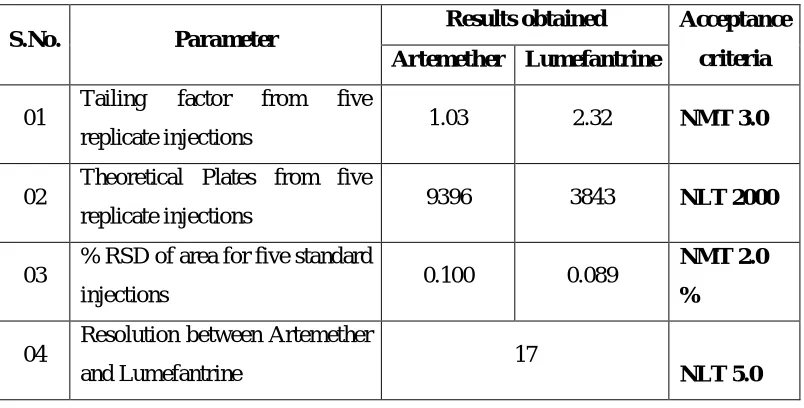
The USP (2000)5 defines parameters that can be used to determine system
suitability prior to analysis include plate number(n), tailing factor(T), resolution(Rs)
and relative standard deviation (RSD) of peak height or peak area for respective
injections.
The RSD of peak height or area of five injections of a standard solution is
normally accepted as one of the standard criteria .For assay method of a major
component, the RSD should typically be less than 1% for these five respective
injections.
The plate number and / or tailing factor are used if the run contains only one peak.
For chromatographic separations with more than one peak, such as an internal
standard assay or an impurity method expected to contain many peaks, some measure
of separations such as Rs is recommended. Reproducibility of tR or k value for a
specific compound also defines system performance.
The column performance can be defined in terms of column plate number. As
the plate count is more the column is more efficient.
METHOD VALIDATION
The word “Validation’’ means “Assessment’’ of validity or action of proving
effectiveness.
Definition
ICH6 defines validation as “establish the documented evidence which provides a high
degree of assurance that a specific process will consistently produce a product of
Method validation is the process to confirm that the analytical procedure
employed for a specific test is suitable for its intended use. Method needs to be
validated or revalidated.
Before their introduction into routine use
Whenever the conditions change for which the method has been validated,
e.g., instrument with different characteristics
Whenever the method is changed, and the change is outside the original scope
of the method.
Purpose of validation
Enable the scientists to communication scientifically and effectively on
technical matter.
Setting the standards of evaluation procedures for checking compliance and
taking remedial action.
Economic: Reduction in cost associated with process sampling and testing.
As quality of the product cannot always be assured by routine quality control
because of testing of statistically insignificant number of samples.
Retrospective validation is useful for trend comparison of results compliance
to CGMP/CGLP.
Closure interaction with pharmacopoeial forum to address analytical
problems.
International pharmacopoeial harmonization particularly in respect of
impurities determination and their limits.
Method validation is completed to ensure that an analytical methodology is
accurate, specific, reproducible and rugged over the specified range that an analyte
Chapter – 1 Introduction
Dept. of Pharmaceutial Analysis 24 J.K.K.Nattraja College of Pharmacy use, and is sometime referred to as “the process of providing documented evidence
that the method does what it is intended to do’’.
For method validation, these specifications are listed in USP chapter <1225>, and can
be referred to as the “eight steps of method validation”. As shown in figure below.
These terms are referred to as “analytical performance parameters’’ Or sometimes as
“analytical figures of merit.’’
In response to this situation, one of the first harmonization projects taken up by the
ICH was the development of a guideline on the “Validation of Analytical Methods”
Definitions and Terminology. “ICH divided the “Validation characteristics”
somewhat differently, as outlined in Figure below
ICH Method Validation Parameters
Method validation parameters
The developed methods were validated by following steps:
A. Accuracy
It is defined as closeness of agreement between the actual (true) value and mean
analytical value obtained by applying a test method number of times. Spike and
recovery studies are performed to measure accuracy; a known sample is added to the
excipients and the actual drug value is compared to the value found by the assay.
Accuracy is expressed as the bias or the % error between the observed value and the
true value (assay value/actual value x 100 %.)
The accuracy is acceptable if the difference between the true value and mean
measured value does not exceed the RSD values obtained for repeatability of the
method. The parameter provides information about the recovery of the drug from
sample and effect of matrix, as recoveries are likely to be excessive as well as
deficient.
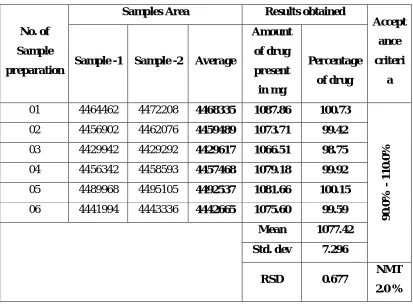
Repeatability is the result of the method operating over a short time interval under
the same conditions (or) is the % RSD of multiple determinations of a single sample
in a single test run (intra-assay precision). It should be determined from a minimum of
nine determinations covering the specified range of the procedure (for example, three
levels three repetitions each) or from a minimum of six determinations at 100% of the
Chapter – 1 Introduction
Dept. of Pharmaceutial Analysis 26 J.K.K.Nattraja College of Pharmacy Intermediate precision is the results from within lab variations due to random events
such as different days, analysts, equipment, etc. In determining intermediate
precision, experimental design should be employed so that the effects (if any) of the
individual variables can be monitored (or) intermediate precision (also called
inter-assay precision) measure the % RSD for multiple determinations of a single sample,
controls and reagents analyzed in several assay runs in the same laboratory.
Reproducibility
It refers to the precision between laboratories usually in collaborative studies
and not directly relevant to assay validation in a manufacturing facility.
Documentation in support of precision studies should include the standard deviation,
relative standard deviation, coefficient of variation, and the confidence interval.
Specificity
It is the ability of an analytical method to assess unequivocally the analyte of
interest in the presence of components that may be expected to be present, such as
impurities, degradation products and matrix components. It is not possible to
demonstrate that an analytical procedure is specific for a particular analyte. In such
case a combination of two or more analytical procedure is recommended to achieve
the necessary level of discrimination. Lack of specificity of an individual analytical
procedure may be compensated by other supporting analytical procedures or tests.
In case of the assay, demonstration of specificity requires that the procedure
is unaffected by the presence of impurities or excipients. In practice, this can be done
by spiking the drug substances or product with appropriate levels of impurities or
extraneous materials. If the degradation product impurity standards are unavailable,
specificity may be demonstrated by comparing the test results of samples containing
impurities or degradation products to a second well-characterized procedure e.g.,
pharmacopoeia method or other validated analytical procedure (independent
procedure). These comparisons should include samples stored under relevant stress
conditions (e.g. light, heat humidity, acid/base hydrolysis, oxidation.ect.)
Limit of Detection
The limit of detection (LOD) is defined as the lowest concentration of an
analyte in a sample that can be detected, not quantitated. It is a limit test that specifies
whether or not an analyte is above or below a certain value. It is expressed as a
concentration at a specified signal-to- noise ratio, usually two –or three-to-one. The
ICH has recognized the signal-to-noise ratio convention, but also lists two other
options to determine LOD: visual non-instrumental methods and a means of
calculating the LOD. The method used to determine LOD should be documented and
supported, and an appropriate number of samples should be analyzed at the limit to
validate the level.
Limit of Quantitation
The limit of quantitation (LOQ) is defined as the lowest concentration of an
analyte in a sample that can be determined with acceptable precision and accuracy
under the stated operational conditions of the method. That is, as the LOQ
concentration level decreases, the precision increases. If better precision is required, a
higher concentration must be reported for LOQ.
Chapter – 1 Introduction
Dept. of Pharmaceutial Analysis 28 J.K.K.Nattraja College of Pharmacy Linearity
It is ability of an assay to obtain test results, which are directly proportional
to the concentration of an analyte in the sample. The determination of linearity will
Identify the range of the analytical assay. It can be measured as slope of the regression
line and its variance or as the coefficient of determination (R2) and correlation
coefficient(R).
Range
Range is the interval between the upper and the lower levels of analyte
(inclusive) that have been demonstrated to be determined with precision, accuracy and
linearity using the method as written. If the relationship between response and
concentration is the linear, the range may be estimated by means of a calibration
curve.
The range is normally expressed in the same units as the test results obtained
by the method. The ICH guidelines specify a minimum of five concentration levels,
along with certain minimum specified ranges. For assay the minimum specified range
is from 80-120% of the target concentration. For an impurity test, the minimum range
from the reporting level of each impurity, to 120% of the specification. (For toxic or
more potent impurities, the range should be commensurate with the controlled level).
Ruggedness
Ruggedness, according to the USP, is the degree of reproducibility of the
results obtained under a variety of conditions, expressed as %RSD. The ruggedness of
an analytical method is the degree of reproducibility of test results obtained by the
analysis of the same samples under a variety of conditions such as different
laboratories, different analysts, different instruments, different lot of reagents,
Robustness
ICH defines robustness as a measure of the method’s capability to remain
unaffected by small, but deliberate variations in method parameters. Robustness can
be partly assured by good system suitability specifications. The evaluation of
robustness should be considered during the development phase and depends on the
type of procedure under study. It should show the reliability of an analysis with
respect to deliberate variations in method parameters. If the results of a method or
other measurements are susceptible to variations in method parameters, these
parameters should be adequately controlled and a precautionary statement included in
the method documentation. One consequence of the evaluation of robustness should
be that a series of system suitability parameters (e.g., resolution test) is established to
ensure that the validity of the analytical procedure is maintained whenever used.
System Suitability Test
System suitability test is commonly used to verity resolution, column
efficiency and repeatability of the chromatographic system to ensure its adequacy for
a particular analysis. According to the United States pharmacopoeia (USP) and the
International Conference on Harmonization (ICH), SST is an integral part of many
analytical procedure.
Primary SST parameters are most important as they indicate system
specificity, precision and column stability. Other parameter include capacity factor
(K) and signal to noise ratio(S/N) for impurity peaks.
The USP chromatography general chapter states “System suitability test are
an integral part of gas and liquid chromatographic methods. They are used to verify
that the resolution and reproducibility of the chromatographic system are adequate for
Chapter – 1 Introduction
Dept. of Pharmaceutial Analysis 30 J.K.K.Nattraja College of Pharmacy electronics, analytical operations and samples to be analyzed constitute an integral
system can be evaluated as such.” (USP 38-NF 31, 621 – Chromatography) 5
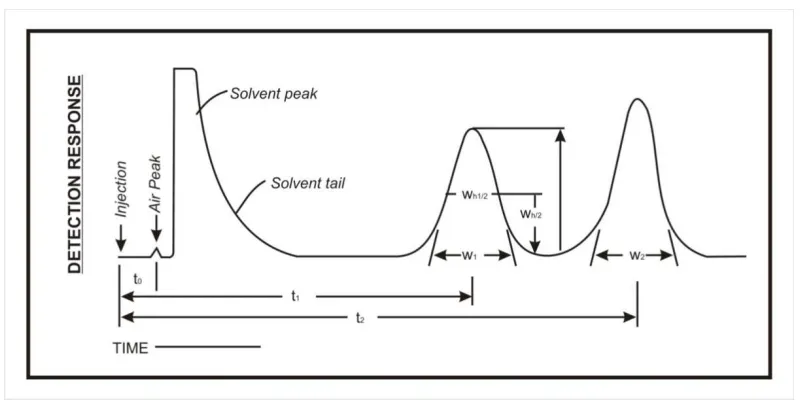
INTERPRETASTION OF CHROMATOGRAMS
Figure below represents a typical chromatographic separation of two
substances, 1 and 2, where t1 and t2 are the respective retention times; and h, h/2, and
Wh/2 are the height, the half – height, and the width at half-height, respectively, for
peak1. W1 and W2 are the respective widths of peaks 1 and 2 at the base line. Air
peaks are a feature of gas chromatograms and correspond to the solvent front in liquid
[image:42.595.106.506.387.593.2]chromatography.
Figure 1.2 Diagrammatic representation of Interpretation of chromatogram
Chromatography retention times are characteristic of the compounds they
represent but are not unique. Coincidence of retention times of a test and a reference
substance can be used as a feature in construction of an identity profile but is
insufficient on its own to establish identity. Absolute retention times of a given
Relative Retention times:
Relative retention time is calculated by the equation Rr = t2/t1
t1 = Retention time of test.
t2 = Retention time of reference substance, determined under identical experimental
conditions on the same column.
Relative Retention:
t 2 – tM
To calculate the relative retention (r) = ---
t1-tM
Where tM is the retention time of the non-retained marker.
Resolution
The resolution R is a function of column efficiency, N and is specified to
ensure that closely eluting compounds are resolved from each other, to establish the
general resolving power of the system, and to ensure that internal standards are
resolved from the drug.
Figure1.3 Resolution
R is determined by the equation:
Chapter – 1 Introduction
Dept. of Pharmaceutial Analysis 32 J.K.K.Nattraja College of Pharmacy
2(t2-t2)
R = __________________
1.70 (W1, h/2 + W2, h/2)
t2 and t1 are the retention times of the components.
W2 and W1 are the corresponding width at the bases of the peaks obtained by
extrapolating the relatively straight sides of the peaks to the base line.
W1h/2 and W2h/2 are the corresponding peak width at half-height.
Resolution
1.18(tR2 – tR1)
R = _______________
(Wh1 + W h2)
Where, t R2 > tR1
tR2 and tR1 = Retention times or distances along the baseline from the point of
injection to the perpendiculars dropped from the maxima of two adjacent peak
Wh1and Wh2 = peak width at half height.
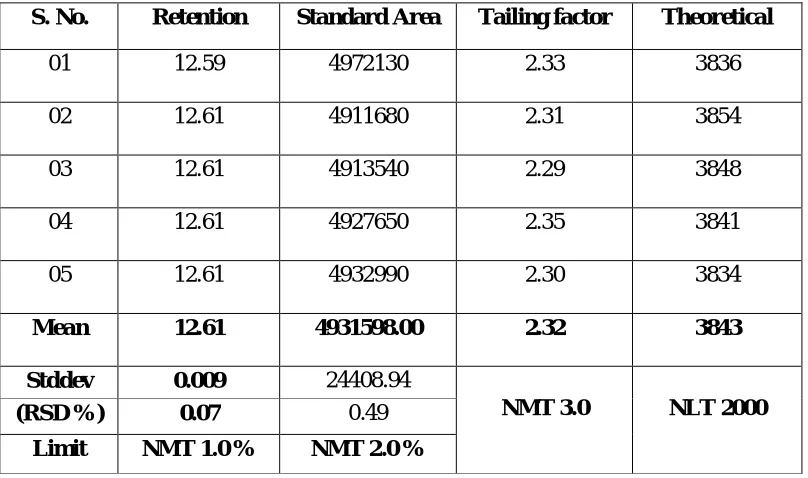
Theoretical Plates
Column efficiency also may be specified as system suitability requirements,
especially if there is only one park of interest in the chromatograms. The number of
the theoretical plates, N, is a measure of column efficiency. It is calculated by the
equation.
N= 16 [t/w] 2 or N= 5.54 [t/w1/2]2
w = width of the peak at its base, obtained by extrapolating the relatively straight
sides of the peak to the baseline.
W1/2 = Peak width at half-height.
Precision:
Precision a measure of either degree of reproducibility or of repeatability is
determined by making replicate injections of standard preparation and calculating
relative standard deviation. Unless otherwise specified in the individual monograph,
data from five replicate injections of the standard preparation are used to calculate the
relative standard deviations (SR), if the requirement is 2.0% or less; data from six
replicate injections are used if the relative standard deviation requirement is more than
2.0%.
Relative Standard Deviation in percentage.
SR (%) = [ ∑ ( ) ]
x = Arithmetic mean of the set.
xi = An individual measurement in a set of N measurements.
N= Number of individuals values
Tailing Factor (or) Symmetry factor
Tailing factor, T, a measure of peak symmetry, is unity for perfectly
symmetrical peaks and its value increases as tailing factor is pronounced (Fig 1). In
some cases values less tan unity may be observed. As peak asymmetry increases,
integration and hence precision becomes less reliable.
Tailing factor, T = .
Chapter – 1 Introduction
Dept. of Pharmaceutial Analysis 34 J.K.K.Nattraja College of Pharmacy F = Distance from the peak maximum to the leading edge of the peak, the distance is
being measured at a point 5% of the peak height from baseline.
Capacity Factor (Mass distribution ratio):
Capacity factor k’ of a sample component is a measure of the degree which that
component is retained by the column relative to an unretained component
Capacity factor is k, = !" !
tr – is the elution time of retained component and
t0 – is the elution time of the unretained sample.
Signal to Noise Ratio:
S/N = #
#
Where,
H = Height of the peak corresponding to the component concerned, in the
chromatogram obtained with the prescribed reference solution, measured from the
maximum of the peak to the extrapolated baseline of the signal observed over a
distance equal to 20 times the width at half-height.
h = Range of the background noise in a chromatogram obtained after injection
or application of a blank, observed over a distance equal to 20 times the width at
half-height of the peak in the chromatogram obtained with the prescribed reference
solution and, if possible, situated equally around the place where this peak would be
found.
Peak to Valley ratio
The peak-to-valley ratio (p/v) may be employed as a system suitability
requirement in a test for related substances when baseline separation between 2 peaks
P/v = ##$ %
Hp = Height above the extrapolated baseline of the minor peak,
Hv = Height above the extrapolated baseline at the lowest point of the curve
separating the minor and major peaks. (ICH 2005)6
System Suitability Parameters and Recommendations:
Parameter Recommendation
Capacity Factor (k’) The peak should be well-resolved from the other peaks and
the void volume, generally k’>2.0
Repeatability RSD, ≤1% for N≥5 is desirable
Relative retention Not essential as long as the resolution is stated
Resolution Rs of >2 between the peak of interest and the closed eluting
Tailing Factor (T) T of ≤2
Theoretical Plates (N) In general should be > 2000
STATISTICAL PARAMETERS
Linear regression:
Once a linear relationship has been shown to have a high probability by the
value of the correlation coefficient ‘r’, then the best straight line through the data
points has to be estimated. This can often be done be done by visual inspection of the
calibration graph, but in many cases it is far more sensible to evaluate the best straight
line by linear regression (the method of least squares).
The equation of straight line is y = mx + c
Where, y the dependent variable is plotted as result of changing x, the independent
Chapter – 1 Introduction
Dept. of Pharmaceutial Analysis 36 J.K.K.Nattraja College of Pharmacy To obtain the regression line ‘y on x’ the slope ‘m’ of the line and the intercept ‘c’ on
the y axis are given by the following equation.
m=& ∑ '( (∑ ')(∑ ()
& ∑ ' (∑ ') and c=
& ∑ ( ∑ ' (∑ ')(∑ () & ∑ ' (∑ ')
Correlation coefficient:
When the changes in one variable are associated or followed by changes in the order
it is called correlation. To establish whether there is a liner relationship between two
variables x1 and y1, use Pearson’s correlation coefficient r.
r= ∑ ) * ∑ ) *
{[ ∑ ) (∑ ) ) ][ ∑ * (∑ * ) ]} ⁄
Where n is the number of data points.
The value of r must lie between +1 and -1, the nearer it is to +1, the greater
the probability that a define linear relationship exists between the variables x and y,
values close to +1 indicate positive correlation and values close to -1, indicate
negative correlation values of ‘r’ that tend towards zero indicate that x and y are not
linearly related (they made be related in a non-linear fashion).
Standard deviation:
The standard deviation measures the spread f the data about the mean value.
It is commonly used in statics as a measure of precision statics as a measure of
Precision and is more meaningful than is the average and is expressed mathematically
as.
S = 23(Xi − x)8N − 1
Where,
If N is large (50 or more) then of course it is immaterial whether the term in the
Denomination is N-1 or N
Σ = sum
X = observed values
;= Mean or arithmetic average = ΣX/N
X - ; = deviation of a value from the mean
N = Number of observations
Percentage relative standard deviation
It is also known as coefficient of variation CV. It is defined as the standard
deviation (S.D) expressed as the percentage of mean.
CV or % RSD = <.= x 100
Where, S.D = Standard deviation,
; = Mean or arthimetic average.
The variance is defined as S2 and is more important in statistics than S itself.
However, the latter is much more commonly used with chemical data.
Standard Error of mean:
Standard error of mean can be defined as the value obtained by division of
standard deviation by square root of number of observation. It is mathematically
expressed as
S.E =<.=
√
Where, n = number of observations.
Chapter – 2 Literature Review
Dept. of Pharmaceutial Analysis 38 J.K.K.Nattraja College of Pharmacy 2. LITERATURE REVIEW
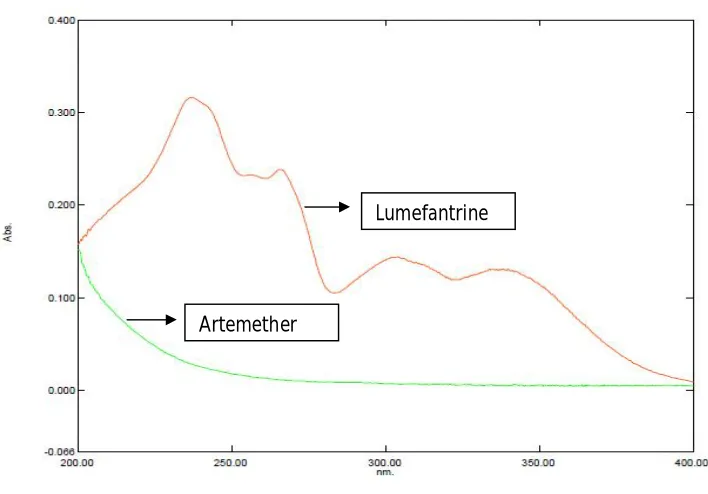
1. R Arun et al13 described the development and validation of a simultaneous HPLC-UV method for the estimation of Artemether and Lumefantrine in fixed-dose combination tablets. The method showed to be linear (r2 > 0.999), precise (RSD <0.43%), accurate (recovery of 99.81% for Artemether and 99.54% for Lumefantrine), specific and robust. Three batches of Artemether and Lumefantrine tablets were assayed by the validated method. The Artemether contents in the tablets varied from 99.30 to 99.33%, while Lumefantrine contents were 99.65 to 99.66%.
3. Mohamed Aly Amin Ahmed Ibrahim et al 15 developed a HPLC Method and did Validation for Determination of Lumefantrine in Pharmaceutical Dosage Forms, it described a simple, precise and rapid HPLC method was developed for estimation of Lumefantrine in pure and pharmaceutical dosage forms. The chromatographic separation was conducted on Shimadzu (Prominence LC 20 UFLC XR) connected with PDA detector; using column C18; Waters, (300 x 3.9 mm, 10 µm). The isocratic mobile phase consisted of ion pair reagent: Acetonitrile in ratio of (35: 65 v/v). Ion pair reagent is composed of 5.65 g of sodium hexane sulfonate and 2.75 g of sodium dihydrogen phosphate in 900 ml of water, adjusted to pH 2.3 with Phosphoric acid 85%, diluted to 1000 ml with water and filtered through 0.45 µm filter. The mobile phase was delivered to the system at a flow rate of 2 ml/min. An injection volume of 20 µl was used for Lumefantrine. The detection was carried out by PDA detector 342 nm. The calibration2 curve of Lumefantrine in mobile phase was linear with correlation coefficient (r) = 0.99946; over a concentration range of 60 – 1200 mg/l; with a retention time of 3.686 minutes. The percentage recovery of Lumefantrine was 100.029%. The relative standard deviation (RSD) was found to be less than 2. The proposed method was validated and successfully applied for determination of Lumefantrine in tablet dosage form.