The short- and long-run impact of the
national funding formula for schools in
England
IFS Briefing Note BN195
Chris Belfield
The Short- and Long-Run Impact of the National Funding
Formula for Schools in England
Chris Belfield and Luke Sibieta Copy-edited by Judith Payne
Published by
The Institute for Fiscal Studies
ISBN 978-1-911102-39-7 March 2017
The authors would like to thank Stuart Adam, Carl Emmerson and Paul Johnson for providing useful comments throughout the course of this work.
This research has been funded by the Nuffield Foundation. The Nuffield Foundation is an endowed charitable trust that aims to improve social well-being in the widest sense. It funds research and innovation in education and social policy and also works to build capacity in education, science and social science research. The Nuffield Foundation has funded this project, but the views expressed are those of the authors and not necessarily those of the Foundation. More information is available at www.nuffieldfoundation.org.
The authors would like to thank the Department for Education for provision of school-level data.
The data creators, depositors, copyright holders and funders bear no responsibility for the analysis, inferences, conclusions or interpretation of the data presented here.
Executive Summary
Key findings
Largest reform to school
funding in over 25 years Government proposals for a National Funding Formula (NFF) for schools in England starting in 2018–19 would replace the 152 different local authority funding formulae with one single formula. The government is to be applauded for making specific proposals and setting out the reasons for the choices it has made.
Reform comes at a time of heavy strain on school budgets
School funding per pupil has been frozen in cash terms between 2015–16 and 2019–20, resulting in a real-terms cut of 6.5%. This would be the largest cut in school spending per pupil over a four-year period since at least the early 1980s and would return school spending per pupil to about the same real-terms level as it was in 2010–11. Any losses schools face as a result of the NFF come on top of this cut.
Wide variation in funding
per pupil mostly preserved Wide variation in funding across schools that currently exists is mostly the result of deliberate choices to target funding towards disadvantaged schools and high-cost areas. The proposed NFF would largely preserve this variation. The intention of the reform is to ensure similar schools are funded in a similar way, rather than to reduce all disparities in funding across schools.
Inevitably, there are
Some redistribution across different types of schools and areas
Funding is diverted from schools with very high levels of deprivation to those with average levels. There is also a shift in funding towards small primary schools and large secondary schools. Schools in inner London are among the biggest losers, with average cuts of around 2.5% in cash-terms per-pupil funding between 2017–18 and 2019–20.
Pupil Premium not included in the funding formula
This is despite the formula including a specific amount for pupils who have been eligible for free school meals in the past six years – the same factor Pupil Premium is based on. The government should rationalise sources of funding by adding the Pupil Premium to the NFF and hold schools to account for all additional funding they receive for pupils from disadvantaged backgrounds.
Large number of schools won’t be on the main funding formula by 2019–20
Proposed protections would prevent any school from losing more than 3% of funding per pupil in cash terms between 2017–18 and 2019–20. Since many schools’ budgets are a long way from those implied by the formula, only 60% of schools will be on the main formula in 2019–20. Around 5% of schools would have budgets over 7% higher than that implied by the formula in 2019–20.
Government has not said how it will move all schools to main formula after 2019–20
1.
Introduction
[image:5.595.90.511.289.525.2]The government is embarking on the single largest reform of the school funding system in England for the last 25 years. Currently, the level of funding a school receives is determined by a local-authority-specific funding formula and the amount each local authority receives from central government. The proposed reform, due to be introduced from financial year 2018–19, will replace the 152 different local authority funding formulae with one single National Funding Formula (NFF). When fully in place, this would ensure similar schools in different parts of the country receive a similar amount of funding. While this has been the ambition of successive governments, they have consistently shied away from the hard choices such a reform entails. The current government is to be applauded for making specific proposals, setting out the reasons for the choices it has made and publishing a large amount of data alongside these proposals to enable effective scrutiny.
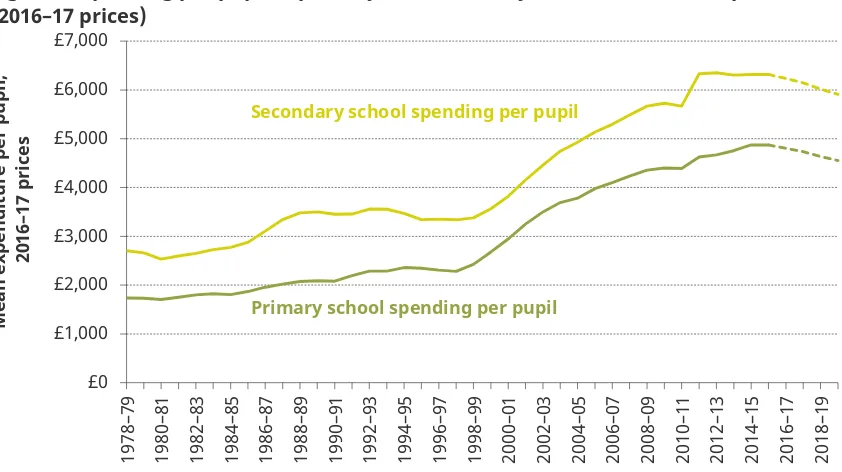
Figure 1. Spending per pupil in primary and secondary schools: actual and plans (2016–17 prices)
Note: Dashed lines are projections based on actual policy and spending announcements for 2016–17 to 2019–20. All years are financial years. These projections do not include the additional funding that results from the transitional protections as discussed in Section 4. This increases funding by 0.7% for primary schools and 0.8% for secondary schools in 2019–20.
Source: C. Belfield, C. Crawford and L. Sibieta, Long-Run Comparisons of Spending per Pupil across Different Stages of Education, IFS Report R126, 2017, https://www.ifs.org.uk/publications/8937.
Any single funding formula for schools in England was always going to create relative winners and losers. To make things harder, this reform comes at a time when schools budgets are under severe pressure. As Figure 1 shows, the current policy of freezing school spending per pupil in cash terms implies a real-terms fall in school spending per
pupil of around 6.5% between 2014–15 and 2019–20.1 The costs schools face have actually
risen faster than inflation in recent years, due to additional costs such as higher employer pension and National Insurance contributions. This implies real-terms cuts closer to 8% between 2014–15 and 2019–20. These changes represent the first real-terms cuts to day-1 Throughout this briefing note, ‘real terms’ refers to spending relative to economy-wide inflation as measured
by the GDP deflator.
£0 £1,000 £2,000 £3,000 £4,000 £5,000 £6,000 £7,000 1978 –79 1980 –81 1982 –83 1984 –85 1986 –87 1988 –89 1990 –91 1992 –93 1994 –95 1996 –97 1998 –99 2000 –01 2002 –03 2004 –05 2006 –07 2008 –09 2010 –11 2012 –13 2014 –15 2016 –17 2018 –19 M ean ex pend it ur e per p up il, 2016 –17 p ri ces
to-day spending per pupil for at least 20 years and would take primary and secondary school spending per pupil back to approximately the same real-terms level as in 2010–11. However, coming on the back of a very significant increase during the 2000s, school spending per pupil is still relatively high in historical terms, being over 70% higher in real terms than in 1990–91.
The new funding formula is planned to take effect from April 2018 and the government has put in place a substantial element of transitional protection, which we estimate costs about £300 million in 2019–20 and temporarily adds about 0.7% to spending per pupil in cash terms. These protections imply no school can see its budget fall by more than 3% between 2017–18 and 2019–20. Nevertheless, schools losing out from the reform are voicing their concerns loudly, likely because these further losses come on top of real-terms falls in spending per pupil between 2014–15 and 2017–18 and, historically, cuts to school spending are rare.
Schools in areas with relatively low levels of funding per pupil have also complained that they do not gain more from the reform, and some even lose funding. This reform does not aim to reduce the disparity in funding across all schools, rather to reduce the disparity in funding between schools with similar characteristics. Therefore, this reform does not necessarily benefit schools with low levels of funding; it benefits schools with low levels of
funding given their characteristics.
Against such a backdrop, this briefing note provides impartial explanation and analysis of the proposed reforms. We start by briefly presenting the case for reform, before setting out what the government has proposed, including transition arrangements. We then analyse the likely effects of these reforms on different schools and areas in the short run up to 2019–20. Such analysis confirms and complements the detailed report recently
released by the Education Policy Institute.2 We then extend this to analyse what is likely to
happen after 2019–20. Only about 60% of schools will be on the main funding formula by this date and the government has provided worryingly little clarity on how quickly remaining schools will be moved onto the new formula. We analyse a number of hypothetical paths for the transition after 2019–20.
2 N. Perera, J. Andrews and P. Sellen, The Implications of the National Funding Formula for Schools, Education
2.
Rationale for reform
There is a strong case for reforming the school funding system in England: similar schools should receive similar levels of funding. Arriving at this result will necessarily create winners and losers. At present, the school funding system is a two-stage process. The government provides grants to local authorities, and local authorities then distribute these to individual schools on the basis of locally determined formulae. Within these individual formulae, the most important factors are pupil numbers in individual schools, the numbers of pupils seen as relatively disadvantaged and other factors that affect the costs schools face (e.g. rates bills and likely staff costs). These formulae determine the funding of all state-funded schools within each area, including free schools and
academies. On top of this, schools receive Pupil Premium funding directly from central government and they receive funding from local authorities to cover the specific extra costs of teaching pupils with high or special educational needs.
This process results in a wide variation in funding per pupil across different schools and areas. A lot of this variation reflects deliberate choices made by policymakers to fund different sorts of schools and areas in different ways. Most notably, as part of efforts to narrow the achievement gap, successive governments over the past 20 years have chosen to increase the amount of funding provided to schools with more disadvantaged pupils. For example, secondary schools in the most deprived quintile received about 30% more
funding per pupil in 2013–14 than those schools in the least deprived quintile,3 compared
with about 10% in the late 1990s.4 Greater levels of funding are also provided to schools in
areas facing higher costs (e.g. schools in the London area).
There is also variation in funding per pupil across similar schools in different parts of the country, which occurs for two main reasons: (i) grants provided to local authorities are currently based on out-of-date information and (ii) local authorities make different choices in their funding formulae.
Until the early 2000s, the grants paid to local authorities to fund schools were allocated through a formula based on the characteristics of the local authority. However, for around the last 15 years, the amount of funding per pupil each local authority receives has been largely based on what they got the previous year plus a bit extra. As local authorities have changed over time, this has meant funding levels have become increasingly divorced from the reality of what local authorities look like today. As a result, local authorities are not always able to fund similar schools in the same way. This type of variation does not seem desirable.
To illustrate this point and the extent of variation in funding per pupil, Figure 2 shows the level of funding per pupil across local authorities in 2016–17, together with the proportion of pupils eligible for free school meals (FSM, the most widely used marker of disadvantage across schools). There is a great deal of variation, with funding per pupil varying from nearly £7,000 in the highest-funded local authority, Tower Hamlets, to just under £4,200 in the lowest-funded local authority, Wokingham. Much of this variation reflects the
differential between inner London and the rest of England and differences in the observed
3 Using proportion of pupils eligible for free school meals as an indicator for deprivation at the school level. 4 C. Belfield and L. Sibieta, Long-Run Trends in School Spending in England, IFS Report R115, 2016,
Figure 2. Local authority average funding per pupil 2016–17
Note: Excludes City of London and Isles of Scilly. Funding per pupil represents total schools block funding per pupil in 2016–17, and thus excludes High-Needs, Early Years and Pupil Premium funding.
Source: Department for Education and Education Funding Agency, ‘Dedicated schools grant allocations 2016–17’ (https://www.gov.uk/government/publications/dedicated-schools-grant-dsg-2016-to-2017); Department for Education, ‘Schools, pupils and their characteristics: January 2016’
(https://www.gov.uk/government/statistics/schools-pupils-and-their-characteristics-january-2016).
level of deprivation across local authorities (shown by the proportion of pupils eligible for FSM).
Schools in London receive additional funding to cover the higher costs they face. In the old formula, this was formalised as an ‘area cost adjustment’ (ACA). This allocated about 28% extra funding to inner London on the basis of differences in average wages. However, the actual difference in teacher salary scales between inner London and the rest of England currently varies between about 15% and 25% depending on teachers’ position on the
salary scale.5 While there are likely to be differences in the costs of other inputs, such as
non-teaching staff or non-staff costs, a funding uplift of 28% seems relatively generous to inner London schools.
Outside London, the variation in funding per pupil is considerably smaller, varying between about £4,000 and £5,000 per pupil. Funding per pupil is generally higher in local authorities with higher observed levels of disadvantage. This reflects choices of successive governments to target funding in this direction. The relationship between observed disadvantage and funding per pupil is not perfect, however. There are a number of local authorities with relatively low levels of funding per pupil given their degree of
disadvantage, which thus could be described as ‘under-funded.’ Notable examples include Barnsley, Blackpool and Knowsley, which have all seen their levels of deprivation rise in recent years relative to the national average. Such local authorities would likely gain in
5 In fact, average teacher salaries are only about 13% higher in inner London than in England as a whole as
teachers tend to be younger and thus lower down the pay scale in inner London.
0% 5% 10% 15% 20% 25% 30% 35%
0 1,000 2,000 3,000 4,000 5,000 6,000 7,000
Per
cen
ta
ge el
ig
ib
le
fo
r F
SM
£ pe
r pu
pi
l
Rest of England Outer London Inner London % FSM (RHS)
Highest to lowest funding per pupil
Knowsley
Blackpool
funding under any formula that accounted for current, rather than historical, levels of disadvantage.
The second main reason why funding per pupil varies across similar schools is that local authorities can and do make different choices in their funding formulae. The most
important choice local authorities make is the relative amount provided for secondary and primary school pupils. In 2016–17, 10% of local authority funding formulae provide at least 57% more funding per secondary school pupil than per primary school pupil, while 10% of
local authorities provide less than 36% more funding per secondary school pupil.6 A
primary school in the former group will receive a lower level of funding per pupil than a similar primary school in the latter group, precisely because of its local authority’s decision to target more spending on secondary schools. There are numerous other differences in local authority funding formulae, including the amount provided for disadvantaged pupils or the level of compensation for fixed costs. Implementing a single national formula would harmonise these differences.
There are advantages and disadvantages to harmonising these differences in a single national funding formula. On the one hand, local policymakers may have better
information on levels of need in their area (e.g. pupils joining a school after the year has started). On the other hand, it is not clear why basic elements of the formula, such as secondary to primary school funding ratio, should vary as much as they do across local authorities. There is clearly a trade-off between flexibility to incorporate local knowledge and reducing funding differences across the country. It might thus be desirable to retain some degree of local discretion to respond to particular and fast-moving measures of need.
A further consideration is the role played in this system by academies, which, although outside of local authority control, still have their funding set by local formulae. If all schools are expected to become academies in the long run (as the government still seems to intend), it would seem more logical to have a single National Funding Formula rather than 152 local systems.
6 This is before taking into account differences in deprivation, school size and other characteristics between
3.
Government proposals
The government’s proposals for an NFF would, if implemented, represent a radical reform to school funding in England. Starting in 2018–19, it would replace the 152 different local funding formulae with one single formula. In the consultation published in December 2016, the government set out precise proposals for the level of different factors in this formula, along with transitional arrangements and protections to prevent schools from seeing sudden, large changes in their budgets.
The government is holding separate consultations on reforms to High-Needs funding and funding for services delivered centrally by local authorities. High-Needs funding covers pupils with specific special educational needs and accounted for about £5.6 billion in 2016– 17. The central services block accounted for about £233 million in the government’s baseline for 2016–17. In the rest of this briefing note, we focus entirely on reforms to the main schools block, which accounted for about £31.7 billion of school funding in the government’s baseline for 2016–17.
The formula proposed by the government is set out in Table 1. The vast majority (over 90%) of funding is pupil-led, i.e. allocated on the basis of the characteristics of pupils attending each school. With a number of important exceptions, these funding factors were set by implementing something close to the average amount local authorities currently allocate for each factor. As such, the degree of turbulence the formula would create is minimised.
By far the most important factor for determining school budgets is the basic amount allocated for pupils of different ages. These are set at a higher level for pupils in secondary schools in order to maintain the current average secondary to primary funding ratio of 1.28. Funding for secondary pupils is differentiated between pupils in Key Stage 3 (ages 11–14) and pupils in Key Stage 4 (ages 14–16), as it is across most local authorities at the moment.
The government then allocates extra funding to schools with more disadvantaged pupils using a range of measures in order to capture different types of disadvantage, including: eligibility for free school meals; whether pupils have ever been eligible in the past six
years; whether pupils live in a deprived neighbourhood;7 whether they have low prior
attainment;8 and whether they have English as an additional language (EAL).9 Local
authorities already allocate funding on the basis of these factors, though they do so to differing degrees, with most weight placed on current FSM eligibility.
In setting their level in the new national formula, the government has sought at least to maintain the existing level of total funding targeted at disadvantage through local funding formulae (which excludes the Pupil Premium). Indeed, the government has actually explicitly increased funding for disadvantaged pupils in two ways. First, some local authorities do not specifically target funding at disadvantaged pupils because the
7 Pupils are grouped into bands based on their Income Deprivation Affecting Children Index (IDACI) score.
Funding is then targeted at pupils in the six most deprived bands, which accounts for 44% of pupils.
8 As measured by the Early Years Foundation Stage Profile for primary school pupils and by Key Stage 2 results
for secondary school pupils.
proportion of disadvantaged pupils is uniformly high across schools in their area,
effectively allocating some deprivation funding through the basic amount provided for all pupils. The government has increased the amount of money explicitly targeted at
deprivation to account for this. Second, the government has chosen to increase the amount of funding for pupils with low prior attainment – another measure of
disadvantage – in order to provide extra resources to schools to help such pupils catch up.
The Pupil Premium, which provides an extra £1,320 and £935 respectively for each pupil in
primary and secondary schools who has been eligible for FSM in the past six years,10 is
treated entirely separately from the NFF. Given that the new formula includes a specific amount for the same factor, the continued existence of the Pupil Premium as a separate grant makes very little sense and it would be better to roll this into the main formula. The government justifies its exclusion from the NFF on the basis that schools are held to account for how Pupil Premium money is used for eligible children. The Pupil Premium is certainly a high-profile and well-recognised area of funding for disadvantaged pupils. However, it would be more logical to hold schools to account for how pupils from different backgrounds perform more generally and how resources are used to support their
attainment, rather than for just one element of funding for one group of pupils.
As is common practice at present, the government has sought to provide a lump sum to primary and secondary schools in recognition of the fixed costs they face. To protect small schools in sparsely populated areas, the government has also proposed a sparsity factor that would provide up to an extra £25,000 and £65,000 for primary and secondary schools with low pupil numbers, respectively.
Finally, a number of other factors are simply set in historical terms on the basis that
schools have little control over them in the short run:11 non-domestic rates bill; costs of
running a split site; ongoing Private Finance Initiative (PFI) costs; funding for in-year pupil growth; and mobility of pupils between schools after the start of the academic year. On top of this, the government has set out a new Area Cost Adjustment (ACA) in order to compensate schools that face higher costs of running a school. This new adjustment combines two main elements: (i) actual differences in teacher salary scales across areas and (ii) differences in average wages across areas to account for differences in the costs of employing other staff. This adjustment is applied as a proportional uplift to all funding (except that which is determined on a historical basis, such as actual rates bills). This approach appears more sensible than the old adjustment, which only took account of average wages. The main effect of the formula is a lower uplift for schools in inner London, which is now around 18%, having been about 28% in the old formula. This new formula would operate from 2018–19 onwards, though in the first year local authorities will still be able to adjust funding across schools in their area. From 2019–20, the government proposes moving to a ‘hard’ school-level formula.
10 In addition, the government provides £1,900 for looked-after children and £300 for children from families
whose parents have served in the armed forces.
11 These will be set at their 2017–18 level for 2018–19, with the government planning to consult further on
Table 1. Proposed National Funding Formula
Primary Secondary Total
allocated Percentage allocated
Pupil-led factors £ per pupil £ per pupil £ million %
Basic amount £2,712 KS3: £3,797;
KS4: £4,312 £23,255m 72.5%
Eligible for FSM £980 £1,225
£1,746m 5.4%
Eligible for FSM in past 6 years £540 £785
IDACI band A £575 £810
£1,239m 3.9%
IDACI band B £420 £600
IDACI band C £360 £515
IDACI band D £360 £515
IDACI band E £240 £390
IDACI band F £200 £290
Low prior attainment £1,050 £1,550 £2,394m 7.5%
English as an additional language £515 £1,385 £388m 1.2%
School-level costs £ per school £ per school £ million %
Lump sum £110,000 £110,000 £2,263m 7.1%
Sparsity £0–£25,000 £0–£65,000 £27m 0.1%
Premises and historical factors £ million %
Rates Historical level £569m 1.8%
PFI Historical level + uprating
Split sites Historical level
Exceptional circumstances Historical level
In-year growth Historical level £167m 0.5%
Mobility Historical level £23m 0.1%
Total £32,071m
Memo: Area Cost Adjustment Varies across local authorities £792m
Note: Excludes City of London and Isles of Scilly. Funding per pupil represents total schools block funding per pupil in 2016–17, and thus excludes High-Needs, Early Years and Pupil Premium funding. IDACI bands are determined by the IDACI score in a pupil’s neighbourhood, which measures the proportion of children living in low-income families in that area. The bands are set as follows: band A (0.5–1); band B (0.4–0.5); band C (0.35–0.4); band D (0.3–0.35); band E (0.25–0.3); band F (0.2–0.25); and band G (0–0.2), which attracts no extra funding. Area Cost Adjustment spending is included within each individual factor.
Source: Government consultation: ‘Schools national funding formula – stage 2’
Overall, the formula set out by the government appears broadly sensible and offers future policymakers the opportunity to debate the size of different funding factors and adjust them accordingly. Such a radical reform of the system will, however, create significant winners and losers. The government has therefore proposed a range of transitional arrangements and protections to prevent schools from seeing large changes in their budgets in the short run.
First, for each of the first two years, there is a minimum funding guarantee so that no school will experience a per-pupil funding cut of more than 1.5% in cash terms in each of 2018–19 and 2019–20. At the other end of the scale, the government has proposed a cap on gains in per-pupil funding of 3.0% in 2018–19 and a further 2,5% in 2019–20. This cap on gains helps fund the minimum funding guarantee.
Second, the funding formula incorporates a funding floor so that no school can lose more
than 3% of its per-pupil funding12 between 2017–18 and 2019–20. There is no extra value in
this funding floor over the minimum funding guarantee. Rather than providing reassurance, the funding floor creates uncertainty in terms of what will happen after 2019–20. Will it be retained after 2019–20 and in what form? Will schools on the funding floor continue to have their funding determined with reference to their 2017–18 level in perpetuity? If so, this will largely defeat the objective of the NFF. Or, as seems more likely, will schools on the funding floor continue to see increases below the national average until they reach the main formula? It is certainly difficult to provide precise commitments beyond the existing Spending Review period, but the government‘s failure to provide any guidance on this matter is a major source of uncertainty for affected schools and could cause schools to make inefficient decisions if they are faced with the prospect of having to make further, unexpected cuts after 2019–20.
4.
Short-run impact: by 2017–18 to
2019–20
The government has committed to protect average school spending per pupil in cash terms between 2015–16 and 2019–20. The NFF is to be implemented within this overall settlement. The NFF would start to be implemented from April 2018 onwards, with local authorities still able to affect school funding levels in 2018–19 and a move to a ‘hard’ school-level formula in 2019–20. To prevent large falls in school budgets, the government has chosen to implement a substantial element of transitional protection, funded partly by a cap on the gains schools can experience and partly by additional spending to help smooth the transition.
In this section, we analyse the effects of the proposed NFF on school funding levels in 2019–20 as compared with their baseline level in 2017–18. This is shown in cash terms to be consistent with the figures the government has already published. We convert some figures to real terms on the basis of economy-wide inflation to provide an indication of the overall resource challenge facing schools. We show both the actual proposed changes between 2017–18 and 2019–20 (i.e. after all protections have been applied) and the changes that would result if no transitional protection were in place. The latter effect provides an indication of the potential impact of the NFF in the long run, although the exact effect will depend on policy decisions after 2019–20. This is discussed in more detail in Section 5.
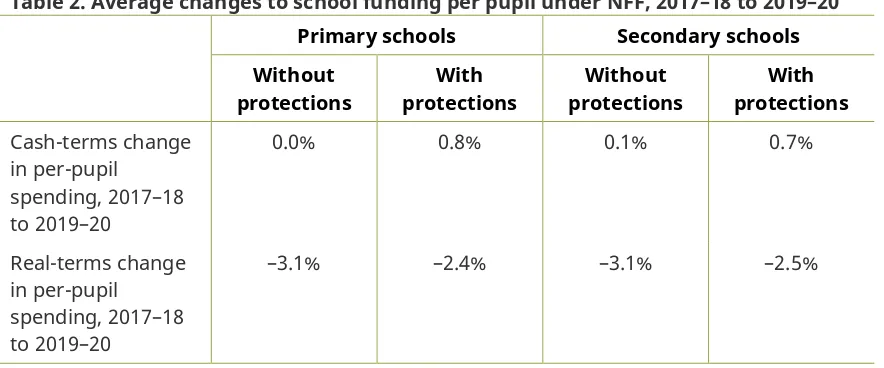
Table 2 shows the average change in funding per pupil across all schools, both before and after protections have been applied. Before protections, the expected change in cash terms between 2017–18 and 2019–20 is near zero, in line with the overall schools
[image:14.595.80.522.525.709.2]settlements. This would equate to a per-pupil real-terms fall of 3.1% between 2017–18 and 2019–20, which on top of previous real-terms cuts would equate to a total real-terms cut of 6.5% between 2015–16 and 2019–20, taking spending per pupil back to approximately the same level as in 2010–11.
Table 2. Average changes to school funding per pupil under NFF, 2017–18 to 2019–20 Primary schools Secondary schools Without
protections protections With protections Without protections With Cash-terms change
in per-pupil spending, 2017–18 to 2019–20
0.0% 0.8% 0.1% 0.7%
Real-terms change in per-pupil
spending, 2017–18 to 2019–20
–3.1% –2.4% –3.1% –2.5%
The government has also announced transitional measures to prevent large sudden losses or gains in school budgets between 2017–18 and 2019–20. The minimum funding guarantee (MFG) of –1.5% means that no school can lose more than 1.5% in cash terms in 2018–19 and/or 2019–20, limiting cash-terms losses to below 3% in total between 2017–18
and 2019–20.13 This protects the funding of almost 6,000 schools at an overall cost of
around £400 million in 2019–20. In addition, there is a limit on the amount each school can gain of 3% in 2018–19 and 2.5% in 2019–20. This constrains the funding of almost 3,000 schools and saves the government around £100 million in 2019–20. The combined effect of these transitional protections is to temporarily increase total school funding by about £300 million in cash terms, or by 0.8% in primary schools and 0.7% in secondary schools. However, once inflation is taken into account, funding per pupil is still expected to fall by about 2.5% in real terms between 2017–18 and 2019–20.
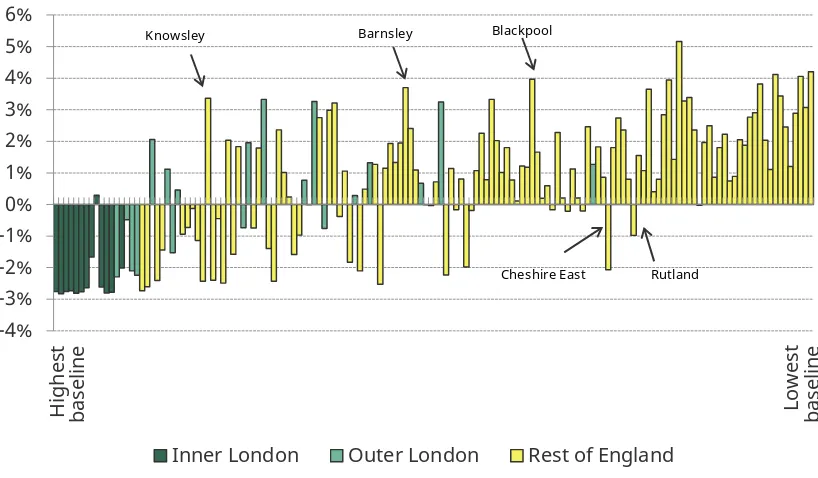
The remainder of this section focuses on the differential impact of the NFF on the funding levels of different school types and areas between 2017–18 and 2019–20. First, Figure 3 shows the average cash-terms impact of the proposed NFF by local authority between 2017–18 and 2019–20. Here, we only show figures with transitional protection and local authorities are ordered from highest to lowest levels of baseline funding per pupil. The proposed NFF would result in some compression in funding per pupil across local
[image:15.595.88.497.449.688.2]authorities. Those with the highest levels of current funding per pupil are (mostly) due to experience falls and those with the lowest levels of current funding per pupil are (mostly) due to experience increases. A large part of this pattern is driven by the fact that inner London local authorities are almost all due to experience falls in funding per pupil, which is a direct result of reducing the ACA from around 28% to 18%.
Figure 3. Average cash-terms changes under NFF with protections by local authority between 2017–18 and 2019–20
Source: Authors’ calculations using National Funding Formula data provided by the Department for Education.
13 The 2019–20 funding floor of 3% below 2017–18 levels has no effect over and above the MFG. -4%
-3% -2% -1% 0% 1% 2% 3% 4% 5% 6%
H
ig
he
st
ba
se
lin
e
Lowe
st
ba
se
lin
e
Inner London Outer London Rest of England
Barnsley
Knowsley Blackpool
Excluding inner London, we still see a pattern of larger increases for currently lower-funded local authorities, but this is not a perfect relationship. For example, Rutland and Cheshire East both have relatively low levels of funding per pupil at the moment and are due to experience cuts in funding as a result of the NFF. It is also noteworthy that the local authorities we identified in Section 2 as being seemingly under-funded under the current system are all due to experience relatively generous increases (Knowsley, Barnsley and Blackpool), which is the result of basing funding levels on current rather than historical levels of deprivation.
Figures 4 and 5 show the average effect across the regions of England for primary and secondary schools respectively, with and without protections. Unsurprisingly, the clear result is again the impact on inner London. In 2019–20, primary funding per pupil in inner London will be 2.5% lower in cash terms than in 2017–18 as a result of the proposed NFF, and secondary school spending will be 2.4% lower. However, this is not the whole story. If the funding protections were not in place, funding per pupil would have fallen by 9.2% and 8.3% in cash terms in primary and secondary schools, respectively. Therefore, after 2019– 20, it seems likely that funding per pupil in inner London will continue to be constrained below the national increase until such schools reach the main formula.
At the other end of the scale, the regions receiving the largest increases are the East Midlands and North East of England amongst primary schools. In the East Midlands, it is notable that primary schools gain more without protections, which suggests a large number of primary schools in the East Midlands would have their funding increases capped between 2017–18 and 2019–20. For secondary schools, the ordering is slightly different, with the South East and South West of England receiving the largest average increases.
Regions receiving the largest increases will be those containing more local authorities that have been historically under-funded as well as schools that have been targeted for
increases under the formula (which we discuss below). The fact that the ordering is different across primary and secondary schools likely reflects the fact that different areas prioritise primary versus secondary schools to differing degrees in their current formulae. In Figure 6, we split primary and secondary schools into quintiles of schools by the overall number of pupils at the school and show the differential impact of the NFF on school
funding per pupil in cash terms amongst the largest and smallest schools.14 The impact of
the NFF is starkly different between primary and secondary schools. Small primary schools gain more than large primary schools with transitional protection. Amongst secondary schools, we see the reverse: large secondary schools would see larger gains than small secondary schools. Without transitional protection, large primary schools would have received a small cash-terms cut to funding per pupil and small secondary schools would have experienced a cut of about 1.2%. This suggests small secondary schools should probably expect a cut relative to the national average after 2019–20.
14 The impacts for other quintiles follow the same qualitative pattern and are available from the authors on
Figure 4. Average change to primary school funding per pupil by region under NFF between 2017–18 and 2019–20, with and without protections
Source: Authors’ calculations using National Funding Formula data provided by the Department for Education.
Figure 5. Average change to secondary school funding per pupil by region under NFF between 2017–18 and 2019–20, with and without protections
Source: Authors’ calculations using National Funding Formula data provided by the Department for Education.
2.2% 1.9% 1.6% 1.7% 1.5%
0.2% 0.0%
-0.3%
-2.5%
0.8% 2.4% 1.9% 1.8%
1.6% 1.2%
-0.6% -1.1% -1.6%
-9.2%
0.0%
-10.0% -8.0% -6.0% -4.0% -2.0% 0.0% 2.0% 4.0%
With protections Without protections
2.3% 1.6% 1.4%
1.2% 0.6%
0.5%
-0.3% -0.8%
-2.4%
0.8% 2.3%
1.5% 1.4% 0.8%
-0.3%
0.1% -0.7%
-1.8%
-8.3%
0.0%
-10.0% -8.0% -6.0% -4.0% -2.0% 0.0% 2.0% 4.0%
[image:17.595.88.496.402.640.2]Figure 6. Average change to school funding per pupil by quintile of school size under NFF between 2017–18 and 2019–20, with and without protections
Source: Authors’ calculations using National Funding Formula data provided by the Department for Education.
These impacts are the result of the relative size of the lump-sum component of the NFF compared with the existing LA formulae, and the inclusion of the sparsity factor. As the
Education Policy Institute points out in its recent report,15 this is likely to be driven by the
fact that more primary schools currently receive a lump sum of less than the £110,000 included in the NFF and this increase disproportionally benefits small primary schools. Fewer secondary schools receive a lump sum below £110,000 and so small secondary schools are more likely to lose out.
Turning now to examine the impact by schools’ levels of deprivation, Figures 7 and 8 show the impact of the NFF on funding by decile of the proportion of the student body who are eligible for free school meals (FSM), the most widely used measure of deprivation at school level. School spending has been increasingly focused on pupils from disadvantaged backgrounds since the mid 1990s and, as pointed out in Section 3, the introduction of the NFF was designed to largely preserve the existing level of total funding targeted at disadvantaged pupils. However, Figures 7 and 8 show that this is not quite the case. In primary schools, funding per pupil in the most deprived decile is expected to grow by only 0.3% in cash terms between 2017–18 and 2019–20 as a result of the NFF (compared with 0.8% on average); in secondary schools, spending on the most deprived decile is set to fall by 0.2% (compared with average growth of 0.7%). The schools that benefit most from the introduction of the NFF are those with middling proportions of students from
disadvantaged backgrounds.
15 N. Perera, J. Andrews and P. Sellen, The Implications of the National Funding Formula for Schools, Education
Policy Institute, 2017, https://epi.org.uk/report/national-funding-formula/.
-1.5% -1.0% -0.5% 0.0% 0.5% 1.0% 1.5%
Smallest quintile
by school size Largest quintile by school size Smallest quintile by school size Largest quintile by school size
Primary Secondary
Ch
an
ge
in
pe
r-pu
pi
l f
un
di
ng
,
2017
–18 t
o
2019
–2
0 (
ca
sh
te
rm
s)
Quintile of school size
Figure 7. Average change to primary school funding per pupil by decile of proportion of pupils eligible for FSM under NFF between 2017–18 and 2019–20, with and without protections
Source: Authors’ calculations using National Funding Formula data provided by the Department for Education.
Figure 8. Average change to secondary school funding per pupil by decile of
proportion of pupils eligible for FSM under NFF between 2017–18 and 2019–20, with and without protections
Source: Authors’ calculations using National Funding Formula data provided by the Department for Education.
-2.5% -2.0% -1.5% -1.0%
-0.5% 0.0%
0.5% 1.0% 1.5% Ch an ge in pe r-pu pi l f un di ng , 2017 –18 t o 2019 –2 0 ( ca sh te rm s)
Decile of deprivation
With protections Without protections
-2.5% -2.0% -1.5% -1.0%
-0.5% 0.0%
0.5% 1.0% 1.5% Ch an ge in pe r-pu pi l f un di ng , 2017 –18 t o 2019 –2 0 ( ca sh te rm s)
Decile of deprivation
[image:19.595.83.498.419.683.2]Without protections, the change in funding per pupil would have been lower across the distribution, but the pattern is the same. Funding per pupil would have fallen by 1.3% amongst the most deprived primary schools and by 2.3% amongst the most deprived secondary schools. This suggests the most deprived schools should probably expect to see funding increases below the national average after 2019–20.
This is the result of two factors. First, a large number of the most deprived schools are in inner London, which, as discussed above, will experience large cuts due to the change in the ACA. Second, the NFF makes greater use of a broader range of factors to allocate funding for deprivation. For example, it allocates more funding on the basis of area deprivation than local authorities do at present. The NFF allocates funding to pupils living in IDACI bands A–F, which covers 44% of pupils, and it allocates more to pupils living in neighbourhoods with lower, though still above average, levels of deprivation. The main measure of deprivation used by most local authorities at present is eligibility for FSM, which only includes 15% of pupils. Using the broader measure of deprivation reduces the focus of funding on the most deprived schools.
Importantly, the patterns we observe here look identical if we instead use an even broader measure of deprivation, such as the proportion of pupils living in the most deprived neighbourhoods.
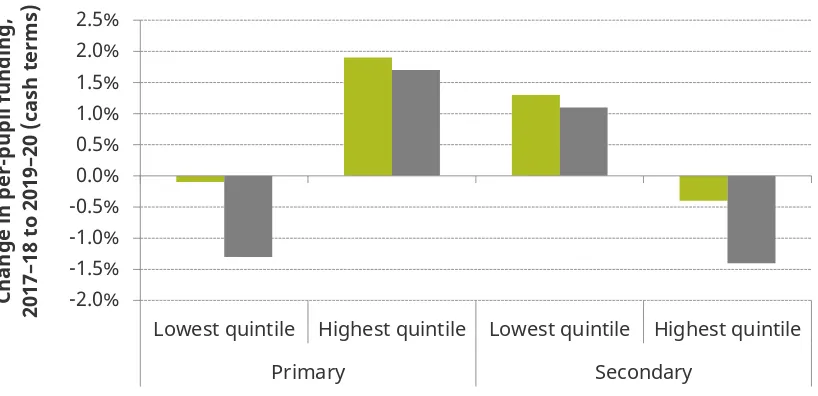
[image:20.595.89.498.488.686.2]Finally, in Figure 9, we examine the impact of harmonising one of the most important factors in local authorities’ current formulae: the secondary:primary funding ratio. We split local authorities into quintiles based on the ratio of the basic amount they provide for secondary school pupils to the basic amount they provide for primary school pupils. Local authorities in the highest quintile have a funding ratio in excess of 1.51 and those in the Figure 9. Average change to school funding per pupil by quintile of current
secondary to primary funding ratio under NFF between 2017–18 and 2019–20, with and without protections
Source: Authors’ calculations using National Funding Formula data provided by the Department for Education.
-2.0% -1.5% -1.0% -0.5% 0.0% 0.5% 1.0% 1.5% 2.0% 2.5%
Lowest quintile Highest quintile Lowest quintile Highest quintile
Primary Secondary
Ch
an
ge
in
pe
r-pu
pi
l f
un
di
ng
,
2017
–18 t
o
2019
–2
0 (
ca
sh
te
rm
s)
Quintile of secondary:primary funding ratio
lowest quintile have a funding ratio below 1.39. We then compare changes under the proposed NFF amongst primary and secondary schools in the lowest and highest quintiles.
5.
Long-run impact
The proposed transitional arrangements and protections will limit schools’ losses in
per-pupil funding to 3% between 2017–18 and 2019–20, and limit any gains to 5.6%.16 However,
this means that there will still need to be considerable funding changes after 2019–20 if all schools are to move onto the new formula. Exactly how these schools will transition onto the main formula is completely unclear.
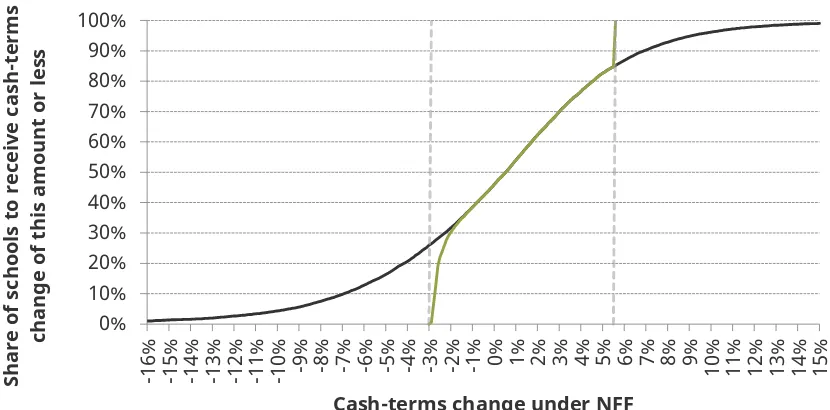
Figures 10 and 11 show the distribution of changes in funding for primary and secondary schools, both as proposed between 2017–18 and 2019–20 with all protections and
[image:22.595.85.500.387.592.2]transitional arrangements, and the overall changes required to reach the main NFF (as set out for 2019–20). More than 4% of primary schools and 5% of secondary schools would need to receive cuts of more than 10% of per-pupil funding to reach the new funding formula in 2019–20. The exact path of the continued transition to the new formula post-2019 will prove very important for these schools. Furthermore, 15% of primary schools and 11% of secondary schools will remain ‘under-funded’ relative to the national formula in 2019–20, i.e. they would have experienced a gain of more than 5.6% in the absence of transitional protections and the cap on gains. These schools also face uncertainty over how their budgets will evolve in future years.
Figure 10. Cumulative distribution of changes between 2017–18 and 2019–20: primary schools
Note: The top and bottom 1% of schools are excluded for reasons of data disclosure.
Source: Authors’ calculations using National Funding Formula data provided by the Department for Education.
16 In reality, because a number of components of funding are protected in cash terms (e.g. rates charges and
PFI costs), very few schools experience a 3% reduction in per-pupil funding.
0% 10% 20% 30% 40% 50% 60% 70% 80% 90% 100%
-16% -15% -14% -13% -12% -11% -10% -9% -8% -7% -6% -5% -4% -3% -2% -1% 0% 1% 2% 3% 4% 5% 6% 7% 8% 9% 10% 11% 12% 13% 14% 15%
Sh
ar
e
of
s
ch
oo
ls
to
r
ec
ei
ve
c
as
h-te
rm
s
ch
an
ge
o
f t
hi
s a
m
ou
nt
o
r l
es
s
Cash-terms change under NFF
Figure 11. Cumulative distribution of changes between 2017–18 and 2019–20: secondary schools
Note: The top and bottom 1% of schools are excluded for reasons of data disclosure.
Source: Authors’ calculations using National Funding Formula data provided by the Department for Education.
Exactly how schools move towards the new formula depends on which transition protections are kept after 2019–20 and on the national increase in average school
funding.17 It seems unlikely that transitional protections would be removed overnight in
2020–21 as this would imply cuts in funding per pupil of more than 7% for almost 1,000 schools. Instead, we consider the case where the minimum funding guarantee remains at –1.5% and the maximum annual cash-terms gain is capped at 3% above the change in
overall school funding settlement.18 Under this scenario, we model three alternative
assumptions about the growth in the overall school settlement: cash-terms freeze in funding per pupil; cash-terms growth of 2% in funding per pupil (which approximates a real-terms freeze); and cash-terms growth of 4% per year in funding per pupil (which approximates real-terms growth of 2%).
For each of these scenarios, Figure 12 shows the rate at which schools converge on the NFF. Obviously, the faster the growth in average school spending, the faster schools converge on the new formula. This is because the funding levels implied by the NFF increase faster, allowing schools to reach their formula level, whilst the MFG is limiting losses. Under a cash-terms freeze, 95% of schools would be receiving the pure formula settlement by 2024–25 and 99% by 2029–30. Under either a terms freeze or a 2% real-terms increase in per-pupil funding, more than 99% of schools would be ‘on formula’ by 2024–25 or 2023–24, respectively.
17 Assuming the relative components of the formula remain unchanged.
18 Alternatively, we could have modelled the impact of a cash-terms floor (e.g. funding will never fall below 97%
of the 2019–20 level). This would significantly restrict convergence to the NFF and, in the case of a cash-terms freeze in the school settlement, a large number of schools would never reach the new formula.
0% 10% 20% 30% 40% 50% 60% 70% 80% 90% 100%
-17% -16% -15% -14% -13% -12% -11% -10% -9% -8% -7% -6% -5% -4% -3% -2% -1% 0% 1% 2% 3% 4% 5% 6% 7% 8% 9% 10% 11%
Sh ar e of s ch oo ls to r ec ei ve c as h-te rm s ch an ge o f t hi s a m ou nt o r l es s
Cash-terms change under NFF
Figure 12. Percentage of schools receiving the funding level dictated by the NFF under alternative assumptions about the growth in overall school funding
Note: The figure assumes a long-run inflation rate of 2% per year from 2019–20 onwards.
Source: Authors’ calculations using National Funding Formula data provided by the Department for Education.
Figure 13. Net cost of transitional protections in 2016–17 prices under alternative assumptions about the growth in overall school funding
Note: The figure assumes a long-run inflation rate of 2% per year from 2019–20 onwards.
Source: Authors’ calculations using National Funding Formula data provided by the Department for Education.
0% 10% 20% 30% 40% 50% 60% 70% 80% 90% 100%
Cash-terms freeze Real-terms freeze 2% real growth
£0 £50 £100 £150 £200 £250 £300 £350
N
et
c
os
t o
f p
ro
vid
in
g t
ra
ns
it
io
na
l
pr
ot
ec
tio
ns
(£
m
illio
n)
[image:24.595.90.491.437.680.2]As more schools have funding supported by the MFG than constrained by the cap on gains, such transitional protections have a net cost. This cost increases between 2017–18 and 2019–20, as the cost of allowing ‘under-funded’ schools up to 3% growth costs more than is gained by reducing the funding of ‘over-funded’ schools by 1.5%. The net cost of providing these transitional protections is £290 million in 2019–20 in 2016–17 prices. As shown in Figure 13, this cost declines over time as fewer schools require protection. The faster school funding increases, the faster the cost of providing protections declines. Finally, Figure 14 examines the transition path of ‘over-funded’ schools – those with funding levels above that implied by the formula – under various different transitional protections (assuming a cash-terms freeze in overall spending). The figure highlights the risk of removing transitional protections overnight: these 5,500 schools would experience an average cut of 4.5% in cash terms. Preserving a minimum funding guarantee of –1.5% ensures a smoother transition for these schools with, as shown in Figure 13, almost all schools reaching their intended formula level by 2029–30. If overall school spending per pupil is protected or grows in real terms, these transitional arrangements are important for reducing a ‘roller-coaster’ path of school funding with large cash-terms cuts
[image:25.595.87.504.340.608.2]immediately followed by increases.
Figure 14. Relative funding level of schools ‘above formula’ under different levels of minimum funding guarantee
Note: The figure assumes a cash-terms freeze in overall school spending and a long-run inflation rate of 2% per year from 2019–20 onwards.
Source: Authors’ calculations using National Funding Formula data provided by the Department for Education.
93 94 95 96 97 98 99 100 2019 –20 2020 –21 2021 –22 2022 –23 2023 –24 2024 –25 2025 –26 2026 –27 2027 –28 2028 –29 2029 –30 2030 –31 2031 –32 2032 –33 2033 –34 2034 –35 2035 –36 2036 –37 2037 –38 2038 –39 2039 –40 Ave ra ge c ash -te rm s p er -p upi l f un di ng of ‘a bov e f or m ul a’ s ch ool s (2019 –20 = 100)
6.
Conclusion
Government proposals for implementing a single National Funding Formula for schools in England would represent the most ambitious reform to the school funding system for over 25 years. Once fully implemented, this reform will ensure similar schools in different parts of the country receive a similar level of funding per pupil. Such a radical reform will necessarily create winners and losers and implementing this reform at a time when there is already considerable pressure on school budgets will inevitably be difficult. The
government should be applauded for making specific proposals, for setting out the reasons for the choices it has made and for publishing a large amount of data alongside these proposals to enable effective scrutiny.
The proposed reform corrects clear inequities in funding levels between local authorities, which have come about due to the lack of a formula to allocate school funding to local authorities for the last 15 years. The reform also removes local authority discretion over the targeting of school funding at certain characteristics. This reduces the variation in funding levels between similar schools in different parts of the country, but reduces the flexibility for policymakers to incorporate local knowledge. Finally, the reform diverts funding away from schools with the most deprived student population and towards those with average levels of deprivation; it increases the funding of schools that have intakes with low prior attainment; and it increases the funding of smaller primary schools and larger secondary schools.