ASSESSMENT OF TMJ MORPHOLOGICAL CHANGES IN RHEUMATOID ARTHRITIS PATIENTS USING CONE BEAM
COMPUTED TOMOGRAPHY
Dissertation Submitted to
THE TAMILNADU DR. M.G.R. MEDICAL UNIVERSITY
For partial fulfillment of the requirements for the degree of
MASTER OF DENTAL SURGERY
BRANCH – IX
ORAL MEDICINE AND RADIOLOGY
THE TAMILNADU DR. MGR MEDICAL UNIVERSITY
CHENNAI – 600 032
CERTIFICATE BY THE GUIDE
This is to certify that Dr. PRIYANKA, Post graduate student (2014-2017) in the Department of Oral Medicine and Radiology (Branch IX), Tamilnadu Government Dental College and Hospital, Chennai 600003, has done this dissertation titled “ASSESSMENT OF TMJ MORPHOLOGICAL CHANGES IN RHEUMATOID ARTHRITIS PATIENTS USING CONE BEAM COMPUTED TOMOGRAPHY”
under my direct guidance and supervision in partial fulfillment of the M.D.S. degree examination in April 2017 as per the regulations laid down by Tamilnadu Dr. M.G.R. Medical University, Chennai- 600 032 for M.D.S., Oral Medicine and Radiology (Branch – IX) degree examination.
Prof. Dr. S. JAYACHANDRAN, M.D.S, Ph.D. MAMS, MBA
CERTIFICATE BY HEAD OF THE DEPARTMENT /
HEAD OF THE INSTITUTION
This is to certify that the Dissertation entitled “ASSESSMENT OF TMJ MORPHOLOGICAL CHANGES IN RHEUMATOID ARTHRITIS PATIENTS
USING CONE BEAM COMPUTED TOMOGRAPHY” is a bonafide work done by
Dr. PRIYANKA, Post Graduate student (2014-2017) in the Department of Oral Medicine and Radiology under the guidance of Prof. Dr. S. JAYACHANDRAN, M.D.S., Ph.D. Professor, Department of Oral Medicine and Radiology, Tamil Nadu Government Dental College and Hospital, Chennai – 600 003.
Dr. S. JAYACHANDRAN, M.D.S., Ph.D., MAMS., MBA.,
Professor and Head of the Department, Department of Oral Medicine and Radiology, Tamil Nadu Government Dental College & Hospital, Chennai - 600 003.
Dr. B SARAVANAN M.D.S., Ph.D.,
DECLARATION BY THE CANDIDATE
Title of the study “Assessment of TMJ morphological changes in rheumatoid arthritis patients using cone beam computed tomography” Place of study TamilNadu Government Dental College and Hospital,
Chennai 600003 Duration of the course Three years
Name of the Guide Prof. Dr. S. JAYACHANDRAN, MDS, PhD, MAMS, MBA. Head of the Department Prof. Dr. S. JAYACHANDRAN, MDS, PhD, MAMS, MBA.
I, Dr PRIYANKA hereby declare that no part of the dissertation will be utilized for gaining financial assistance/any promotion without obtaining prior permission of the Principal, TamilNadu Government Dental College and Hospital, Chennai 600003. In addition, I declare that no part of this work will be published either in print or in electronic media without the guide who has been actively involved in the dissertation. The author reserves the right to publish the work with the prior permission of the Principal and Guide, TamilNadu Government Dental College & Hospital, Chennai 600003.
ACKNOWLEDGEMENT
With supreme sincerity, obedience, deep sense of gratitude and heartfelt
appreciation, I thank my esteemed guide, DR. S. JAYACHANDRAN M.D.S., PhD.,
MAMS. Professor and Head, Department of Oral Medicine and Radiology, Tamil Nadu
Government Dental College and Hospital, Chennai – 3, for his valuable guidance,
support and encouragement throughout my post graduate course and to bring this
dissertation to a successful completion.
I extend my special thanks to our Principal Dr. B Saravanan, MDS,
Ph.D, TNGDCH for providing motivation and encouraging environment to conduct this
study.
I sincerely thank Dr. G.V. MURALI GOPIKA MANOHARAN M.D.S.,
Professor Department of Oral Medicine and Radiology, Tamil Nadu Government Dental
College and Hospital, Chennai – 3, for his valuable guidance and sincere support.
My sincere humble regards and gratitude to Dr. L. Kayal M.D.S., Professor, Dr. Capt. P. Regu M.D.S., Dr. K. Sarala, M.D.S., Dr. Vidya Jayaram, Dr. Aarthi Nisha, Assistant Professors, Department of Oral Medicine and Radiology for
their help and suggestions during my course
I dedicate this work to my parents Mrs. SAROJ KHOBRE and Mr.
SHAMSHER SINGH KHOBRE, my brother RAKESH SINGHKHOBRE, my sister
NEHA PARVEEN GUNPAL and family members for their love, care, kindness and
I am very much thankful to my uncle Dr. DINESH KATARIA and my friends Dr. NEHA AZAD and Dr. JAYAVARMA R for their suggestions, support and
help throughout this study.
I am very much thankful to Department of rheumatology, RGGGH, for kind
cooperation and support throughout my study.
I take this opportunity to express my gratitude to my seniors, batchmates,
juniors and friends for their valuable help and suggestions throughout my course. I also
want to thank my department radiographers for their help during my study.
Lastly, I wholeheartedly thank the ALMIGHTY who has showered his blessings
from above and who is behind each and every step in my life.
LIST OF ABBREVIATIONS USED
RA Rheumatoid arthritis
CBCT Cone beam computed tomography
CT Computed tomography
TMJ Temporomandibular joint
TMD Temporomandibular disorder
3D Three dimensional
RF Rheumatoid arthritis
ANA Antinuclear antibody
ESR Erythrocyte sedimentation rate
CRP C reactive protein
MTP Metatarsophalangeal joint
MCP Metacarpophalangeal joint
PIP Proximal interphalangeal joint
ACPA Anti-citrullinated protein antibodies
TNF Tumor necrosis factor
MRI Magnetic resonance imaging
RANKL Receptor activator of nuclear factor kappa b, ligand
ACR American College of Rheumatology
SNP Single-nucleotide polymorphism TNFR Tumor necrosis factor receptor
DNA Deoxy-ribonucleic acid
HLA Human leukocyte antigen
AKA Anti-keratin antibodies APF Anti-perinuclear factor
SE Shared epitope
IL Interleukin
FLS Fibroblast-like synoviocytes
EULAR European League Against Rheumatism
DMARD Disease‐modifying anti‐rheumatic drugs
CCP Cyclic citrullinated peptide
CONTENTS
TITLE PAGE NO.
1. INTRODUCTION 1
2. AIMS AND OBJECTIVES 4
3. REVIEW OF LITERATURE 5
4. MATERIALS AND METHODS 27
5. STATISTICAL ANALYSIS 35
5. RESULTS AND OBSERVATIONS 36
6. DISCUSSION 51
7. SUMMARY AND CONCLUSION 56
8. BIBLIOGRAPHY 58
9.
LIST OF PHOTOGRAPHS
S.NO. FIGURE NAME
Figure 1 Armamentarium
Figure 2 Clinical examination of TMJ
Figure 3 CBCT machine and exposure criteria Figure 4 CBCT revealing condylar erosion
Figure 5 CBCT revealing condylar flattening
LIST OF TABLES
S.NO TABLE NAME
Table 1 Age distribution
Table 2 Distribution of symptoms
Table 3 Distribution of mouth opening
Table 4 Distribution of osseous changes in condyle
Table 5 Comparison of left TMJ pain with left condylar osseous changes
Table 6 Comparison of left TMJ pain with right condylar osseous changes
Table 7 Comparison of right TMJ pain with left condylar osseous changes
Table 8 Comparison of right TMJ pain with right condylar osseous changes
Table 9 Comparison of crepitation with left condylar osseous changes
Table 10 Comparison of crepitation with right condylar osseous changes
Table 11 Comparison of mouth opening with condylar osseous changes
Table 12 Distribution of joint space
LIST OF CHARTS
S.No. CHART NAME Chart 1 Sex distribution
Chart 2 Distribution of severity of erosion in left condyles
Chart 3 Distribution of severity of sclerosis in left condyles
Chart 4 Distribution of severity of subchondral in left condyles
Chart 5 Distribution of severity of osteophyte in left condyles
Chart 6 Distribution of severity of erosion in right condyles
Chart 7 Distribution of severity of sclerosis in right condyles
Chart 8 Distribution of severity of subchondral cyst in right condyles
Chart 9 Distribution of severity of osteophyte in right condyles
Chart 10 Distribution of severity of erosion in left glenoid fossa
Chart 11 Distribution of severity of flattening in left glenoid fossa
Chart 12 Distribution of severity of sclerosis in left glenoid fossa
Chart 13 Distribution of severity of erosion in right glenoid fossa
Chart 14 Distribution of severity of flattening in right glenoid fossa
ABSTRACT
TITLE- Assessment of TMJ morphological changes in rheumatoid arthritis patients using cone beam computed tomography
BACKGROUND- Rheumatoid arthritis is an autoimmune disorder, which can cause temporomandibular joint involvement with clinical symptoms such as pain, swelling, crepitation and movement impairment. Erosion of the components of TMJ is seen in two‐
third of the patients with RA. Other radiologic features for RA patients with TMJ include flattening, sclerosis, subchondral cyst and osteophytes. CBCT found to be efficient for diagnosing several osseous changes in the TMJ region.
AIM- The aim of the study is to evaluate osseous changes in rheumatoid arthritis patients with temporomandibular joint involvement (TMD) using Cone Beam Computed Tomography.
OBJECTIVES- To interpret the CBCT axial, coronal, sagittal and 3D images of involved condyle, glenoid fossa and joint space in rheumatoid arthritis patients, in relation to the osseous changes and to correlate the clinical findings with CBCT imaging features.
METHODOLOGY- Patients were diagnosed with rheumatoid arthritis based on laboratory values for rheumatoid factor antibody and anti-citrullinated protein antibodies. A clinical diagnosis of TMJ RA was made based on symptoms and CBCT for each patient involving 100 TMJ was taken.
compared to radiographic feature of osteophyte at left condyle (p < 0.05), showed statistically significant values. Crepitus heard at left TMJ was correlated to left condyle bony changes for presence of osteophyte results in p < 0.05 in coronal view. While crepitation at right TMJ, assessed for sclerotic changes in opposite side (left) of condyle, results in p value of 0.04 in axial, 0.01 in coronal and 0.00 in sagittal showed highly significant result.
Conclusion- Presence of osteophyte was found to be significant in sagittal section of CBCT at left condylar surface, in subjects with no pain at rest and motion at left condyle. Also, Clinical finding of crepitation is linked to increase evidence of osteophyte, and coronal view should be section of choice to assess this finding. Crepitus heard in one joint can be a reason for sclerotic changes in other joint.
1 INTRODUCTION
Rheumatoid arthritis is a chronic autoimmune condition characterized by
inflammation of synovial membrane, destruction of articular surface and sub articular
bone, autoantibody production and systemic features including skeletal, pulmonary,
cardiovascular and psychological disorders1,2. It is considered multifactorial, with
combination of strong genetic factors and infections, associated with the incidence of RA.
Rarely trauma, acute injury and surgeries are known to initiate RA3. RA has 1%
prevalence worldwide, with female predilection (3:1). It mainly affects 35 to 55 years of
age group. 50% of the RA patients usually presents with TMJ complaints. Clinical
symptoms incudes dull, deep aching pain at preauricular region, morning stiffness of
joint, joint sound and limited range of motion1,4. Hematologically, patients with RA have certain abnormal blood antibodies like “RF” and “ANA” and raised ESR values. Other
tests for confirmation like anti- citrulline antibody and CRP test, are required in doubtful
cases. Diagnosis of RA with TMJ involvement is based on history, clinical finding,
laboratory values and radiographic findings3. Erosion of the components of TMJ is seen
in two‐third of the patients with RA1. Evidence for the link between articular erosion and
autoimmunity was revealed by anti-carbamylated protein antibodies and anti-citrullinated
protein antibodies (ACPA) in the serum of patients with RA. ACPA binds to the surface
of the cell and increases differentiation of cell to bone-resorbing osteoclasts, reflecting
osteoclast-mediated bone resorption5. Both systemic osteoporosis and erosions is
associated with imbalance between the osteoclasts and osteoblasts activity. Cytokines
related to RA physiopathology, such as RANKL and tumor necrosis factor alpha (TNF-α), are also associated with the pathogenesis of focal and systemic bone lesions6
2
Histopathology of synovial tissue, showed a very large quantity of osteoclasts in bone
erosions in RA patients, and less or even absence of mature osteoblasts, suggesting the
blocking of differentiation of bone forming osteoblasts by certain molecules in the
synovium5. Radiological examination is an important tool to assess TMJ disorder3.
Various imaging techniques for diagnosing RA include extraoral radiography, magnetic
resonance imaging, Computed Tomography, arthrography and arthrotomography.
More recently, CBCT is the best-recommended imaging techniques for TMJ
evaluation3. However, as compared to conventional dental radio- graphic techniques,
CBCT gives increased radiation doses to the patients. The introduction of cone beam CT
(CBCT) provides a radical change in dental and maxillofacial radiology. Diagnosis of
wide range of clinical applications can be improved potentially by three-dimensional (3D) information offered by CBCT, that too at lower doses than seen in ‘‘medical’’
multislice CT7. Hintze et al compared conventional tomography with cone beam
computed tomography in detection of TMJ morphological changes. They found no
significant differences in diagnostic accuracy between the two techniques. Since there is
no evidence that CBCT is inferior to CT, the use of imaging technique depends mainly on
the available equipment8. The dose of radiation in CBCT is lower and is less costly; the
amount of radiation differs according to the brand of the equipment, and the anatomical
structure to be imaged. Other than these advantages, CBCT also provides a three-
dimensional image of the mineralized tissue in maxillofacial region with minimal
distortion. CBCT found to be efficient for diagnosing several osseous changes in the TMJ
region9. Destruction at the TMJ in patients having RA is correlated to the duration and
3
erosion of articular and subarticular surface of bone, flattening of condylar head,
reduction in the joint space width, subchondral cyst and resorption. Joint space reduction
is due to the destruction of disc by the pannus1. Glenoid fossa also can show erosion and
flattening of the articular eminence. Synovial proliferation is the initial process in RA and
can differentiate it from other types of arthritis, and is seen readily on MRI. Joint effusion
is also more common in RA. As the disease progresses, it can lead to resorption of the
mandibular condyle4. Management of inflammation and pain is by the use of first‐line
drugs, such as cortisone and aspirin. Reducing the progression of the disease and
promoting remission is by using second-line drugs (disease‐modifying anti‐rheumatic
4 AIM
The aim of the study is to evaluate osseous changes in rheumatoid arthritis
patients with temporomandibular joint involvement (TMD) using Cone Beam Computed
Tomography.
OBJECTIVES
1. To interpret the CBCT axial, coronal, sagittal and 3D images of involved condyle
of the mandible in rheumatoid arthritis patients, in relation to the morphological
characteristics like erosion, flattening, sclerosis, subchondral cyst and osteophyte. 2. To interpret the CBCT axial, coronal, sagittal and 3D images of involved glenoid
fossa in rheumatoid arthritis patients, in relation to the morphological
characteristics like erosion, flattening and sclerosis.
3. To interpret the CBCT axial, coronal and sagittal images of involved joint space
in rheumatoid arthritis patients, in relation to the morphological characteristics
like normal joint space and decreased joint space.
4. To correlate the clinical findings with CBCT imaging features.
5 REVIEW OF LITERATURE
Historical background
The first description of RA is found in Augustin Jacob Landre-Beauvais
dissertation, which was acknowledged by modern medicine from the year 1800. He
treated patients with severe joint pain, which was not explained at the time by other
known maladies. He hypothesized that these patients were suffering from a previously uncharacterized condition, which he named Goutte Asthenique Primitive, or “Primary
Asthenic Gout.”
Alfred Garrod, an English physician, was next important contributor during the
mid to late 19th century was the first, who differentiated gout from other arthritic
condition.
Alfred Garrod in 1859 wrote “Treatise on Nature of Gout and Rheumatic Gout”.
He distinguished arthritis from gout and described RA as a distinct condition, which he referred to as “Rheumatic Gout.”
In the late 19th and early 20th centuries, two preliminary paleopathological
studies were carried out independently by Professor Flinders Petrie and Sir Armand
Ruffer. They demonstrate skeletal damage similar to RA of human remains from Egypt.
Archibald Garrod, who was the fourth son of Alfred Garrod, in 1890, wrote the
6
Arcini, in 1992 described the most striking case of RA in paleopathological
samples. The pattern of damage to the right hand, from a human remains found in
Europe, showing both damage of the index finger and ulnar deviation, was most likely
the case of RA10.
Published paleopathological studies of Rheumatoid Arthritis10.
Date of Samples Year Published Location Hypothesis Supported
4000-1000 BCE 1917 Egypt Ancient Origin
3000-1000 BCE 1988 Alabama New World to Old World
2750-2625 BCE 1897 Egypt Ancient Origin
2500-1900 BCE 1988 Sweden Ancient Origin
2290-2040 BCE 1990 Kentucky New World to Old World
1300 BCE 1940 Lower Egypt Ancient Origin
800 BCE 1988 Ohio New World to Old World
400-1 BCE 1985 Denmark Ancient Origin
339-210 BCE 1979 Sicily Ancient Origin
7
During 2750-2625 B.C, examination of 50-year old Egyptian male mummy
showed typical changes of rheumatoid arthritis (RA) in the temporomandibular joint and
joints of the hand11.
EPIDEMIOLOGY
Linos A et al (1980)12 conducted study of the incidence and prevalence of rheumatoid arthritis in Rochester from 1950-74, which revealed an average annual
incidence rate of 28.1/100,000 for males, 65.8/100,000 females. Age-specific rates
generally increased with age. Prevalence rates for January 1, 1975 were 4.0/1000 for
males and 10/1000 for females. Among adults, prevalence rates were 5.8/1000 for males
and 13.4 for females.
A cross-sectional study of clinical evaluations for 4800 new patients of all ages,
admitted to a hospital with rheumatological symptoms, in the eastern state of West
Bengal performed by Kar et al (1991)13 showed a prevalence of 5.2% of RA among
these patients .
Another study to estimate the prevalence of rheumatoid arthritis in adult Indian
population by Malaviya et al (1993)14, showed in 299 individuals diagnosed for RA, a prevalence of 0.75% was found. The prevalence of RA in India is quite similar to that
reported from the developed countries. It is higher than that reported from China,
Indonesia, Philippines and rural Africa. These findings are in keeping with the fact that
the north Indian population is genetically closer to the Caucasians than to other ethnic
8
A study by Symmons DP et al (1994)15 provides the first data on the incidence of
RA based on a prospective population-based register. Out of 210 patients, 104 were
diagnosed for RA at the time of presentation. The annual incidence rate was 36/100,000
for women and 14/100,000 for men. RA was rare in men aged under 45 yr. The incidence
in men rose steeply with age. The incidence in women rose up to age 45 yr, plateaued to
age 75 yr, and fell in the very elderly.
A population based cohort study by Gabriel SE et al (1999)16 described trends in
the epidemiology of RA over a period of 30 years. Of the 425 individuals, with a mean
age at diagnosis of 60.2 years, the overall prevalence of RA was approximately 1%. This
incidence was approximately double in women compared with that in men, and increased
steadily with age, until age 85, after which the incidence of RA decreased.
An estimation of the global burden of RA, was carried out byMarita Cross et al
(2000)17. A series of systematic reviews were conducted to gather age-sex-specific
epidemiological data for RA prevalence, incidence and mortality. The global prevalence
of RA was found as 0.24%. Globally, of the 291 conditions studied, RA was ranked as
the 42nd highest contributor to global disability, just below malaria and just above iodine
deficiency.
There is wide variation in the occurrence of RA among countries and areas of the
world. Alamanos et al (2006)18, analysed a total of 28 studies based on ACR criteria,
across four categories: North America, northern Europe, southern Europe and developing
9
Involvement of temporomandibular joint in RA, was studied by Kurtoglu C et al
(2016)19, Fifty-four patients having RA treatment were examined to evaluate the prevalence and type of temporomandibular disorders (TMD) in patients with rheumatoid
arthritis(RA), the prevalence of TMD in RA patients was 90.7%.
ETIOLOGY
No single cause has been identified for RA. It appears to be a multifactorial
disease in which there are important genetic and environmental influences3.
MacGregor A et al (2000)20 analyzed data from 2 previously published nationwide studies of twins with RA, conducted in Finland and the United Kingdom.
Genetic factors have a substantial contribution to RA in the population, accounting for
approximately 60% of the variation in liability to disease. Although tempered by power
considerations, there is no evidence in these twin data that the overall genetic
contribution to RA differs by sex, age, age at disease onset, and disease severity.
A study was conducted by Barton A et al (2001)21 where 291 individuals
genotyped for A/G polymorphism in exon 1 of TNFRI and also typed for a
single-nucleotide polymorphism (SNP) in exon 6 of the TNFRII gene. The results of this study
provided evidence of association between a single-nucleotide polymorphism (SNP) in the
TNFRII gene and RA, the strongest association being observed in patients with a family
history. No evidence of association between RA and TNFRI was demonstrated.
In evaluation of the environmental associations with rheumatoid arthritis,
10
A study by Jobanputra P et al (1995)23 established association with parvovirus
infection, wherein, of the 23 patients with B19 DNA, 29% of patients were diagnosed for
rheumatoid arthritis.
Smoking has an adverse effect on disease progression in patients with RA. In a
study by B. Masdottir et al (2000)24, sixty‐three individual with advanced RA answered a structured questionnaire that included detailed information about their smoking history.
They were also evaluated clinically and radiologically. An association was observed
between smoking, and those RF types that predispose to RA and have the highest
diagnostic specificity for this disease.
Martti Oka (1953)25 concluded that the onset of rheumatoid arthritis during pregnancy or immediately after it, is so common that in certain circumstances, pregnancy
can be regarded as an aetiological factor.
PATHOGENESIS
Historically, RA was called chronic infectious arthritis, because the clinical and
pathologic features of disease resemble those seen in chronic infectious diseases such as
tuberculosis. One important host variable is the major histocompatibility locus. Human
leukocyte antigen (HLA) genes located within the major histocompatibility complex on
chromosome 6p have been found to have a strong association with RA26.
Rheumatoid arthritis (RA) is the most common systemic inflammatory
autoimmune disease, in which joint synovium is primarily affected by a dysregulated
immune system. RA is typically associated with serological evidence of systemic
11
The first autoantibody in RA, rheumatoid factor (RF), was described by Waaler in
1940, and it was later found to be directed to the Fc region of IgG. Autoantigens targeted
by a number of autoantibodies, subsequently found in RA, such as cartilage components,
stress proteins, enzymes, nuclear proteins and citrullinated proteins, which demonstrates
that RA is not characterized by only one autoreactivity to a single autoantigen, but by
accumulated autoreactivities in both B and T cells. The spectrum of these self-antigens
and immunologically relevant epitopes probably varies during the disease course, and the
set of autoantigens in one individual, may differ from that in another. In 1993, Serre et al.
identified filaggrin as the target antigen of RA-specific anti-keratin antibodies (AKAs).
Subsequently, it has been demonstrated that AKAs and other RA-specific auto-antibodies
known as anti-perinuclear factors (APFs), and anti-Sa antibodies, all recognize
citrulline-containing peptides/proteins as common antigenic entity, and they are collectively termed
as anti- citrullinated protein antibodies (ACPAs). Currently, only RF and ACPA are
utilized in clinical practice because of their diagnostic and prognostic values; the latter, in
particular, is highly specific for RA.
The association between high titer RF status and a poor prognosis indicates that
RF may have a role in the pathogenesis of RA. Furthermore, RF has proven to be the
most useful disease marker of RA, as included in the American College of Rheumatology
classification criteria for RA.
As with RF, they are associated with more erosive RA. Although ACPAs are also
12
peptide anti-bodies, depending on the antigens used for their detection, citrulline is a
common critical constituent of the antigenic determinant of these antibodies, as its
absence leads to a lack of recognition by antibodies.
ACPA production is thought to be limited to subjects with certain genetic
backgrounds, among which RA-shared epitope (SE) located in the HLA-DRB1 gene is
the most dominant genetic factor.
SE, a common region with highly similar sequences among certain HLA-DR class
II alleles, is the genetic factor best known to be associated with RA. 46 MHC class II
molecules expressing SE can bind and present citrullinated peptides to T cells. Studies
utilizing RA patients of North American and several European ancestries, have found that
SE alleles are not associated with RA in ACPA negative patients, indicating that these
alleles are risk factors for ACPA rather than RA. However, the greatly increased odds
ratio for RA susceptibility and radiological progression in individuals with the
combination of SE gene carriage and ACPA, than individuals with either of them
suggests a synergistic interaction of SE and ACPA27.
Binding of ACPA to the cell surface increases cellular differentiation to
bone-resorbing osteoclasts via autocrine stimulation of TNF production. Induction of
osteoclastogenesis by ACPA binding is also highlighted by high levels of markers of
bone resorption in the serum of patients with RA, reflecting osteoclast mediated bone
13
Both erosions and systemic osteoporosis are related to the imbalance between
osteoblasts and osteoclasts activity. Some of the cytokines involved in RA
physiopathology, as the tumor necrosis factor alpha (TNF-α) and RANKL, are also
involved in the pathogenesis of both focal and systemic bone lesions. The balance
between the osteoblasts and osteoclasts activity, in course of RA is conditioned not only
from distinctive inflammatory factors (TNF-α, IL1, IL6, IL17, IFN-gamma), but also
from metabolic factors (IGF1, estradiol, parathyroid hormone, leptin) related to the
disease per-se, or influenced by the use of some drugs as glucocorticoids. The
fundamental role is played by osteoclasts, both from the synovial and the medullary side6.
Histopathology of synovial tissue of patients with RA, has revealed an abundance
of osteoclasts in bone erosions, but a paucity or even absence of mature osteoblasts,
suggesting that certain molecules in the synovium effectively block differentiation of
bone- forming osteoblasts5.
In a population based study in Finland, occurense of HLA-DR4 was 54% in
patients with RA and in 30% with control patients28.
In a study by Pincus T et al (1994)29, individuals carrying DR4 and
HLA-DR1 alleles in particular, have been shown to posses a higher risk of the disease. It has
been suggested that the susceptibility alleles all share a single epitope that is responsible
for the predisposition of individuals to RA. (29)
By using the miRNA microarray analysis, Philippe et al30, showed resident cells like
fibroblast-like synoviocytes (FLS), play a crucial role in rheumatoid arthritis (RA). They
14
destruction. Moreover, RA FLS spread RA to unaffected joints. Pathogen-associated
molecular patterns and damage-associated molecular patterns have been found to activate
RA FLS by interacting with pattern recognition receptors, such as TLR. RA FLS express
a large number of TLR, and TLR2 was demonstrated to be involved in RA inflammation.
Because microRNA have emerged as important controllers of TLR expression and
signaling, the aim of the study was to evaluate their potential involvement in the control
of TLR2 expression by RA FLS. It was first showed that TLR2 expression is strongly
upregulated in RA FLS, in response to TLR2 ligands. Using a microRNA microarray
analysis, they identified that one miRNA in activated RA FLS, miR-19b, which was
downregulated and predicted to target Tlr2 mRNA. Downregulation of miR-19b and
miR-19a, which belongs to the same cluster, was confirmed by real-time quantitative
PCR. Transfection of RA FLS with miR-19a/b mimics, decreased TLR2 protein
expression. In parallel, it was found that both IL-6 and matrix metalloproteinase 3
secretion was significantly downregulated in activated FLS, transfected with either
mimic. Moreover, using a luciferase assay, it was showed that miR-19a/b directly target
TLR2 mRNA. Taken together, the data points toward an important role for miR-19a/b in
the regulation of IL-6 and matrix metalloproteinase 3 release by controlling TLR2
expression, as well as provide evidence that miR-19a/b can act as negative regulators of
inflammation in humans. These findings provide clear evidence that 19a and
miR-19b, which are induced by bacterial ligands, can act as negative regulators of
15
MacGregor et al31, have investigated the association between allotypes of
HLA-DR4 and radiological erosion in the peripheral joints of patients with RA. They found
that in all patients with RA, DRB1*0401/0404 genotype was associated with a
substantially increased risk of being rheumatoid factor positive, and of having
subcutaneous nodules and radiological erosion. They suggested that HLA-DRB1*04
might be a marker of severe RA.
CLINICAL FEATURES
In 1987 classification criteria were developed by the American College of
Rheumatology (ACR) to distinguish non-RA from established RA32.
Criterion and Definition
1. Morning stiffness
Morning stiffness in and around the joints, lasting at least 1 hour before maximal
improvement.
2. Arthritis of 3 or more joint areas
At least 3 joint areas simultaneously have had soft tissue swelling or fluid (not bony
overgrowth alone) observed by a physician. The 14 possible areas are right or left PIP,
MCP, wrist, elbow, knee, ankle, and MTP joints.
3. Arthritis of hand joints
16 4. Symmetric arthritis
Simultaneous involvement of the same joint areas (as defined in 2) on both sides of the
body (bilateral involvement of PIPs, MCPs, or MTPs is acceptable without absolute
symmetry).
5. Rheumatoid nodules
Subcutaneous nodules, over bony prominences, or extensor surfaces, or in juxta-articular
regions, observed by a physician.
6. Serum rheumatoid factor
Demonstration of abnormal amounts of serum rheumatoid factor by any method, for
which the result has been positive in <5% of normal control subjects
7. Radiographic changes
Radiographic changes typical of RA, on postero-anterior hand and wrist radiographs,
which must include erosions or unequivocal bony decalcification, localised in or most
marked adjacent to the involved joints (osteoarthritis changes alone do not qualify)
*For classification purposes, a patient shall be said to have RA if he/she has satisfied at
least 4 of these 7 criteria. Criteria 1 through 4 must have been present for at least 6
weeks. Patients with 2 clinical diagnoses are not excluded. Designation as classic,
definite, or probable RA is not to be made.
Previously, Rheumatoid Arthritis (RA) was defined by the presence of four of
17
collaborated with the European League against Rheumatism (EULAR) and developed a
new classification criteria which focuses on patients with synovitis for less than 6 weeks
of whom symptoms are not better explained by another diagnosis. The new criteria set
are thought to be more sensitive in identifying patients in the early stages of RA prior to
developing erosive disease. Therefore, allowing for the early initiation of DMARD
therapy. Scoring is based on 4 categories: 0-5 points for number and site of involved
joints, 0-3 points for serologic abnormality, 0-1 points for elevated acute phase response
and 0-1 points for the duration of symptoms. A total score of 6 or more increases the
possibility of RA33.
The clinical history of a patient with RA, generally includes pain and symmetric
swelling involving multiple joints. Any joint may be affected, but those most commonly
involved are the metacarpophalangeal joints of the hand, proximal interphalangeal joints
of the hand, metatarsophalangeal joints, wrists, knees, elbows, and, less commonly,
shoulder, hip, and distal interphalangeal joints29.
RF may represent a marker of the earliest phases of the pathogenetic process of
RA, that may be detectable before the appearance of other features that permit a clinical
diagnosis. A study by Del Puente A et al (1988)34, with 2,712 Pima Indians of Arizona,
20 years of age or older, initially without RA, was observed for up to 19 years with
biennial examinations. It concluded that the presence of RF, in subjects without RA, is a
risk factor for the development of RA, and that this risk is related to the RF titer.
Another study by Sune F Nielsen et al, (2012)35 included white Danish
18
study entry. Individuals in the general population, with elevated rheumatoid factor, have
up to 26-fold greater long term risk of rheumatoid arthritis, and up to 32% 10 year
absolute risk of rheumatoid arthritis. These novel findings may lead to revision of
guidelines for early referral to a rheumatologist and early arthritis clinics based on
rheumatoid factor testing.
Anti- CCP is highly specific for diagnosing rheumatoid arthritis. Nishimura et al,
(2007)36, concluded that the specificity of anti-CCP for the diagnosis of rheumatoid arthritis was greater than that of RF. Anti-CCP may also be a better predictor of erosive
disease.
Study by Panchagnul R et al (2006)37, suggested that anti-CCP is a useful and
highly specific, but not absolutely specific or sensitive test to detect RA, and supplements
rheumatoid factor in the presence of a strong clinical suspicion.
However ,it was proposed by Avouac et al (2006)38, that the sensitivity of the
second generation of anti-CCP is close to that of rheumatoid factor, with a higher
specificity, for distinguishing RA from other rheumatic diseases. Moreover, anti‐CCP
antibodies appear to be highly predictive of the future development of RA in both healthy
19 TEMPOROMANDIBULAR JOINT
The area where the mandible articulates with the cranium, the TMJ, is one of the
most complex joints in the body. It provides for hinging movement in one plane and
therefore can be considered a ginglymoid joint. However, at the same time, it also
provides for gliding movements, which classifies it as an arthrodial joint. Thus it has been
technically considered a ginglymoarthrodial joint. The TMJ is formed by the mandibular
condyle fitting into the mandibular fossa of the temporal bone. Separating these two
bones from direct articulation is the articular disc. In the normal joint, the articular
surface of the condyle is located on the intermediate zone of the disc, bordered by the
thicker anterior and posterior regions. The condyle is the portion of the mandible that
articulates with the cranium around which movement occurs.The total mediolateral
length of the condyle is between 18 and 23mm, and the anteroposterior width is between
8 and 10 mm. The actual articulating surface of the condyle extends both anteriorly and
posteriorly to the most superior aspect of the condyle. The posterior articulating surface is
greater than the anterior surface. The articulating surface of the condyle is quite convex
anteroposteriorly and only slightly convex mediolaterally. The mandibular condyle
articulates at the base of the cranium with the squamous portion of the temporal bone.
This portion of the temporal bone is made up of a concave mandibular fossa, in which the
condyle is situated and which has also been called the articular or glenoid fossa. Posterior
to the mandibular fossa is the squamotympanic fissure. Immediately anterior to the fossa
is a convex bony prominence called the articular eminence. The degree of convexity of
the articular eminence is highly variable, but important, because the steepness of this
20
Although rheumatoid arthritis is more commonly associated with the joints of the
hands, it also may occur in the TMJs and is then almost always bilateral. A history of
multiple joint complaints is a significant diagnostic finding. About 50% of patients with
rheumatoid arthritis will present with TMJ complaints.
About 80% of rheumatoid patients are seropositive for rheumatoid factor.
Although not conclusive, this test is helpful in identifying rheumatoid arthritis. In one
radiographic study, two thirds of the patients with rheumatoid arthritis demonstrated
erosive changes in the TMJs39.
Clinical characteristics of rheumatoid arthritis includes pain/tenderness at the
TMJ region, morning stiffness, joint sounds such as crepitus or clicking, limitation of
mouth opening and swelling over joint area40.
Yamakawa M et al (2002)41 conducted a study on 142 women with rheumatoid arthritis (40 to 69 years) and 143 women of similar age without RA to estimate the
prevalence of TMJ disorder in RA subjects. In the RA group, TMJ tenderness was
elicited in 9.2%, clicking in 12.7%, and crepitus in 35.9%, representing a significant
excess occurrence of crepitus. They concluded the prevalence of TMJ disorders in RA
patients to be 67.6%.
Yi-Chun Lin et al (2007)42 recruited 56 adult RA patients and were found to have a very high prevalence of TMD (92.9%). They concluded that TMD is a frequent
manifestation of RA. Approximately half of the cases of TMJ involvement in RA
21
Radiological investigations are of paramount importance in the diagnostic
assessment of a patient with TMD. The American Academy of Oral and Maxillofacial
Radiology (AAOMR) has established the rationale for image selection for diagnosis,
treatment planning and follow up of a patient with conditions affecting the TMJ.
Conventional radiographic TMJ projections like transpharyngeal, transcranial, panoramic
radiograph, conventional tomographic sections of TMJ may be adequate in a number of
clinical situations. But there are bony alterations that occur in these disorders like
erosions, osteophytes, pneumatisation of articular eminence that are difficult to be
detected in conventional radiographs due to overlapping of the anatomic structures. This
warrants the use of advanced imaging modalities like Magnetic Resonance Imaging,
arthrography, conventional Computed Tomography and Cone Beam Computed
Tomography43.
Celiker R et al (1995)44 included twenty patients in a study, ten were evaluated
with computed tomography and ten with magnetic resonance imaging. Among the 20
patients, 45% had TMJ involvement detected by imaging techniques. The most frequent
pathological signs were osteophyte formation, erosion of the mandibular condyle and
decreased joint space (40%). They concluded that TMJ involvement may be detected
even in asymptomatic patients with RA and there is a positive correlation between the
severity of disease and involvement of TMJ. The prevalence of TMJ involvement in RA
may be as high as 45%, the majority of respondents estimated that only as many as 25%
of their patients with RA had TMJ involvement.
22
radiographic criterion pathognomonic for generalized osteoarthritis or rheumatoid
arthritis, However, osteophytes, flattening of condyle or reduced joint space is found to
be more in generalized osteoarthritis and erosions in condyle more in rheumatoid
arthritis.
A study by Dahlstrom L et al (1996)46 was conducted to assess the reliability and
validity of panoramic radiography for TMJ evaluation in comparison with tomography.
TMJ was assessed for 50 TMD patients and 20 non-TMD subjects. They concluded that
evaluation of bony changes on the condyles has acceptable reliability and specificity, but
low sensitivity, whereas the temporal component has low reliability and accuracy. If bony
abnormality is suspected in the TMJ, tomography may be indicated than panoramic
radiography.
As conventional plain radiographs of various TMJ projections depict only
mineralized structures of the TMJ. These are, however, plagued by the numerous
23 Cone Beam Computed Tomography (CBCT)
It is a recent innovation in field of technology that has achieved the rapid
acceptance in general, particularly in dentistry despite its current relatively high price
when compared with alternative imaging methodologies. Craniofacial CBCTs were
designed to counteract some of the limitations of the conventional CT scanning devices47.
The object to be evaluated is captured as the radiation source falls onto a
two-dimensional detector. This simple difference allows a single rotation of the radiation
source to capture an entire region of interest, as compared to conventional CT devices
where multiple slices are stacked to obtain a complete image48. The cone beam also
produces a more focused beam of x-ray and significantly less scatter radiation compared
to the conventional fan-shaped CT devices, and this considerably increases the X-ray
utilization and reduces the ability of X-ray tube required for volumetric scanning49.
It has been reported that the total radiation dose is approximately 20% of
conventional CTs and equivalent to a full mouth periapical radiographic exposure50.
Presently, the available CBCT equipment differs in size, possible settings, area of
image capture (field of view), and clinical usage.
CBCT has application in several diagnostic areas, such as implant treatment, oral
surgery, endodontic treatment, and temporomandibular joint imaging. The great
advantage of this technology is that offers 3-dimensional (3D) imaging of dental
24
comparison to the conventional computed tomography, CBCT technology in clinical
practice has significant advantages such as minimization of the dose of radiation to the
patient, accuracy of image, rapid scanning time, lesser image artifacts, chair-side image
display, high spatial resolution and real-time analysis51, 52.
PRINCIPLE OF CONE BEAM COMPUTED TOMOGRAPHY
All CT scanners consist of an x-ray source and detector mounted on a rotating
gantry. During rotation of the gantry, the receptor detects x rays attenuated by the patient.
These recordings constitute raw data that is reconstructed by a computer algorithm to
generate cross sectional images, whose component picture element (pixel) values
correspond to linear attenuation coefficients. CT can be divided into 2 categories on the
basis of acquisition of x ray beam geometry, namely fan beam and cone beam.
Cone beam scanners use a 2 dimensional digital array providing an area detector,
unlike linear detector as CT does. This is combined with a three dimensional (3D) x-ray
beam with circular collimation so that the resultant beam is in the shape of a cone, hence
the name cone beam because the exposure incorporates the entire region of interest
(ROI), only one rotational scan of the gantry is necessary to acquire enough data for
reconstruction. Cone beam geometry has inherent quickness in volumetric data
acquisition and therefore the potential for significant cost savings as compared with CT,
25
dimensions are dependent on the pixel size on the area detector. Therefore CBCT units in
general provide voxel resolutions that are isotropic- equal in all three dimensions53.
CBCT technology has a substantial impact on the maxillofacial imaging. It has
been applied to diagnosis in almost all the areas of dentistry and now its role is also
expanding into treatment fields such as temporomandibular joint, Implant site
assessment, Orthodontics and Three Dimensional Cephalometrics, Conditions of the
maxillofacial complex, Odontogenic Cysts and Tumors54.
Hussain et al.(2008)55 in their systematic review evaluated the ability of different diagnostic imaging techniques for diagnosing the presence of erosions and osteophytes in
the temporomandibular joint (TMJ) and mentioned that axially corrected sagittal
tomography is currently the imaging modality of choice for diagnosing erosions and
osteophytes in the TMJ. They put forward that CT does not seem to add any significant
information to what is obtained from axially corrected sagittal tomography. CBCT might
prove to be a cost and radiation dose-effective alternative to axially corrected sagittal
tomography. They concluded that combining different radiographic techniques is likely
to be more accurate in diagnosing erosions and osteophytes in the TMJ than using a
single imaging modality55.
A study by KE Alexiou et al (2009)56 on CBCT, to evaluate and correlate with age the severity of TMJ osteoarthritic changes using CBCT, and concluded that older
patients are expected to have more frequent and severe progressive degenerative bony
26
Alkhader M, et al57 performed examination of 106 TMJs from 55 patients with
temporomandibular disorder by CBCT and MRI. Their results showed that MRI was
better at detecting changes in the size of the TMJ, such as deformities, than it was at
detecting changes in shape, for example flattening, osteophyte formation or erosion. This
fact could be due primarily to the limited spatial resolution of MRI; the slice thickness of
MRI is 3 mm or more for clinical use, which may be too thick to detect subtle osseous
changes. Other problems include the presence of fibrous tissues inside the TMJ and the
attachment of the lateral pterygoid muscle in close proximity to the articular surface of
the condyle, which can be interpreted as either an osseous abnormality or as a disc, and
may result in false-positive or false-negative results. Thus, they concluded that the value
of MRI for the detection of TMJ osseous abnormalities is considered to be limited.
JB Ludlow et al (2003)58 conducted a study on effective dose measurements for two extra oral direct digital imaging devices, cone beam CT unit and panoramic unit and
concluded that CBCT examinations resulted in doses that were 3 – 7 times the panoramic
doses observed in this study.
Hintze et al(2007)59 compared the diagnostic accuracy of cone beam CT images with conventional tomographic images for the detection of morphological
temporomandibular joint (TMJ) changes and resulted no significant differences in
diagnostic accuracy between the two techniques. They concluded that there is no
evidence, that conventional or CBCT is inferior to CT, the choice of imaging technique
27
MATERIALS AND METHODS
The study was conducted among the patients referred from department of
rheumatology, Rajiv Gandhi Government General hospital, Chennai to the Department of
Oral Medicine and Radiology, Tamil Nadu Government Dental College and Hospital
with TMJ complaints.
The study protocol was approved by the Institutional Ethical Committee.
DURATION OF THE STUDY: From July 2015- July 2016
SAMPLE DESIGN:
Totally 50 cases were included under the study, of either sex, who were diagnosed
for TMJ involvement with RA based on history, clinical findings and laboratory values.
The patients were selected who satisfied the following inclusion and exclusion criteria.
Inclusion criteria:
1- Patient diagnosed with rheumatoid arthritis and having TMJ involvement.
2- Between the age of 25 to 60 years, both gender
3- Willing to participate in study.
Exclusion criteria:
1- Patients with myogenous cause of pain.
2- Patients with history of trauma or surgery at TMJ or with ankylosis .
3- Pregnant women
28
METHODOLOGY:
Study subjects of 50 patients were included in the study, based on inclusion and
exclusion criteria, and those who satisfied the clinical criteria of rheumatoid arthritis with
TMJ involvement. All those participants were explained about the design of the study,
the need for thorough clinical examination and CBCT as a part of the study. Patients who
gave a signed informed consent on an institutionally approved document were included in
the study. Patient also subjected to routine blood investigations, to rule out any systemic
illness, in our institution before the start of the study.
Patients were diagnosed with rheumatoid arthritis based on laboratory values for
rheumatoid factor antibody and anti-citrullinated protein antibodies. A detailed case
history of the patients, with emphasis on symptoms of rheumatoid arthritis like multiple
joint pain, along with TMJ symptoms such as pain/tenderness at the TMJ region, joint
sounds such as crepitus and limitation of mouth opening, was recorded. Thorough clinical
examination was recorded on a structured proforma designed for the study (Figure 2). A
clinical diagnosis of TMJ RA was made and CBCT for each patient involving 100 TMJ
was taken in Department of Oral Medicine and Radiology, Tamil Nadu Government
29
Armamentarium (Figure 1):
Examination of the patient
1) Electrically operated dental chair
2) Patient’s apron
3) Disposable mouth mask
4) A pair of disposable latex examination gloves
5) Stainless steel kidney trays
6) Mouth mirror
7) Stainless steel probe
8) Tweezer
9) Divider and Metallic scale
CS 9300 Select (Carestream Health, Inc.) cone beam 3D extraoral imaging system
was used. The CBCT machine had a scanning time of 12-28 seconds (+/- 10%), voxel size 90μm to 180μm, field of view 5x5cm, 8x8cm, 10x5cm, 10x10cm and fitted with a
TFT sensor. Exposure parameters for the patients varied from, tube voltage 60 - 90 kV,
tube current 2 - 15 mA, with a scan time of 12- 28 seconds. Routine radiation safety
procedures were followed. Patients were positioned in standing position while taking the
scan. The total image acquisition time was less than 2 minutes. Radiation exposure for a
Single CBCT scan was in the range 0.02 to 0.08 mSv. The radiographic exposure for
patients was well below the maximum permissible dose of 2.4 mSv as per the NCRP
guidelines (Figure 3).
30
Dental Imaging Software 6, 13, 1, 8(Copyright Carestream Health, Inc.,2013) on
Hewlett- Packard HP Z220 CMT Workstation running on Windows 7 Professional
Operating System (Copyright © 2009 Microsoft Corporation). The DICOM data was
analyzed on secondary reconstructed orthogonal slices, reformatted OPG and
reconstructed 3 dimensional images. Cross sectional CBCT images were evaluated to
assess the osseous changes at temporomandibular joint in rheumatoid arthritis patients.
Assessment was done for the condyle of the mandible, glenoid fossa and joint space.
1. To interpret the CBCT axial, coronal, sagittal and 3 dimensional images of osseous
changes of condyle of the mandible in rheumatoid arthritis patients in relation to the
morphological characteristics like
Erosion - defined as area of decreased density of the cortical bone and adjacent
subcortical bone of the condyle.
Flattening - defined as a flat bony contour deviating from convex form.
Osteophyte- defined as marginal bony outgrowth of the condyle.
Sclerosis- defined as an area of increased density of cortical bone extending into
the bone marrow. (56)
Subchondral cyst - defined as a space of 1mm in diameter and connecting
with the cartilage loss regions (60)
2. To interpret the CBCT axial, coronal, sagittal and 3 dimensional images of involved
31
3. To interpret the CBCT axial, coronal, sagittal and 3 dimensional images of involved
joint space in rheumatoid arthritis patients in relation to the morphological characteristics
like normal or reduced joint space.
FOR CHONDYLAR OSSEOUS CHANGES
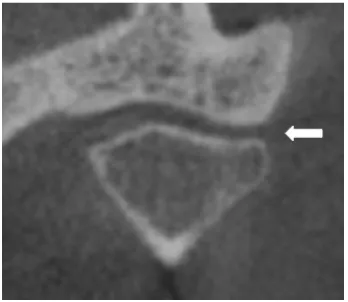
For analysing, a four point rating scale (0 to 3) was used to define the severity of erosion
in the condylar head as follow (Figure 4):
0- Absence of erosion
1- Mild erosion- when decreased density is observed only in the cortical bone.
2- Moderate erosion- when decreased density is observed in the cortical bone and extends
to the upper layers of the adjacent subcortical bone
3- Severe erosion- when decreased density is observed in the cortical bone and extends
below the upper layers of the adjacent subcortical bone.
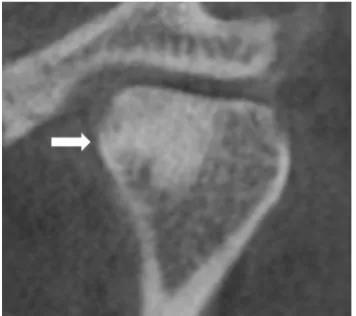
A four point rating scale (0 to 3) was used to define the severity of flattening in the
condylar head as follow (Figure 5):
0- Absence of flattening
1- Mild flattening- when flattening is observed only in the cortical bone.
2- Moderate flattening- when flattening is observed in the cortical bone and extends to the
upper layers of the adjacent subcortical bone.
3- Severe flattening- when flattening is observed in the cortical bone and extends below the
32
A four point rating scale (0 to 3) was used to define the severity of sclerosis in the
condylar head as follow (Figure 6):
0- Absence of sclerosis
1- Mild sclerosis- when sclerosis is observed only in the cortical bone.
2- Moderate sclerosis- when sclerosis is observed in the cortical bone and extends to the
upper layers of the adjacent subcortical bone
3- Severe sclerosis- when sclerosis is observed in the cortical bone and extends below the
upper layers of the adjacent subcortical bone.
A four point rating scale (0 to 3) was used to define the severity of osteophyte in the
condylar head as follow (Figure 7):
0- Absence of osteophyte
1- Mild, when marginal bony outgrowth on the condyle was less than 0.5 mm
2- Moderate, when marginal bony outgrowth on the condyle was 0.5- 1 mm
3- Severe, when marginal bony outgrowth on the condyle was more than 1 mm.
A three point rating scale (0 to 2) was used to define the severity of erosion in the
condylar head as follow (Figure 8):
0- Absence of subchondral cyst
1- Presence of single subchondral cyst.
33
FOR GLENOID FOSSA OSSEOUS CHANGES
A four point rating scale (0 to 3) was used to define the severity of erosion in the glenoid
fossa as follow:
0- Absence of erosion
1- Mild erosion- when decreased density is observed only in the cortical bone.
2- Moderate erosion- when decreased density is observed in the cortical bone and extends
to the upper layers of the adjacent subcortical bone
3- Severe erosion- when decreased density is observed in the cortical bone and extends
below the upper layers of the adjacent subcortical bone.
A four point rating scale (0 to 3) was used to define the severity of flattening in the
glenoid fossa as follow (Figure 10):
0- Absence of flattening
1- Mild flattening- when flattening is observed only in the cortical bone.
2- Moderate flattening- when flattening is observed in the cortical bone and extends to the
upper layers of the adjacent subcortical bone.
3- Severe flattening- when flattening is observed in the cortical bone and extends below the
upper layers of the adjacent subcortical bone.
A four point rating scale (0 to 3) was used to define the severity of sclerosis in the
glenoid fossa as follow:
0- Absence of sclerosis
34
2- Moderate sclerosis- when sclerosis is observed in the cortical bone and extends to the
upper layers of the adjacent subcortical bone
3- Severe sclerosis- when sclerosis is observed in the cortical bone and extends below the
upper layers of the adjacent subcortical bone.
JOINT SPACE
The measurement between the condyle and mandibular fossa was performed on
lateral slices at the subjectively closest distance between condyle and mandibular fossa
using measurement tool in the CBCT software (Figure 9).
1- Normal – when the distance between the condylar head and mandibular fossa was
between 1.5 mm and 4 mm.
2- Reduced- when the distance between the condylar head and mandibular fossa was less
than 1.5 mm.
35
STATISTICAL ANALYSIS-
The statistical analysis was done using the computer software program SPSS
version 18.01. All data are expressed as mean rank scores. Descriptive statistics for
various clinical and radiographic parameters was present as percentage for qualitative
data. Arithmetic mean and standard deviation were estimated for quantitative data. The
percentage of distribution of age groups and sex was also calculated.
Comparison of radiographic features based on clinical finding and Statistical
significance was determined using the Mann-Whitney test.
Comparison of frequency of radiographic parameters like erosion, flattening,
sclerosis, subchondral cyst and osteophyte in different CBCT sections like axial, coronal,
sagittal and 3D reconstructed view was performed by Pearson chi square test.
The smaller the p value, the more significant the result was said to be. All p
values are two tailed, and confidence intervals were calculated at the 95% level. In the
PHOTOGRAPHS
FIGURE 1: ARMAMENTARIUM
FIGURE 2: CLINICAL EXAMINATION OF TMJ
[image:50.595.185.411.433.725.2]
FIGURE 3A : CBCT MACHINE
[image:51.595.188.409.520.691.2]FIGURE 4 : CBCT REVEALING CONDYLAR EROSION
Mild erosion
Moderate erosion
FIGURE 5 : CBCT REVEALING CONDYLAR FLATTENING
Mild flattening
Moderate flattening
FIGURE 6 : CBCT REVEALING CONDYLAR SCLEROSIS
Mild sclerosis
Moderate sclerosis
FIGURE 7 : CBCT REVEALING CONDYLAR OSTEOPHYTE
Mild osteophyte
Moderate osteophyte
FIGURE 8 : CBCT REVEALING SUBCHONDRAL CYST
Single subchondral cyst
[image:56.595.217.377.558.731.2]Multiple subchondral cysts
FIGURE 10 : CBCT REVEALING GLENOID FOSSA FLATTENING
Mild flattening
Moderate flattening
CHART 1: Sex distribution
CHART 2- Distribution of severity of erosion
In left condyles
FEMALE, 94% MALE, 6%
0 10 20 30 40 50 60 70 80
ABSENCE MILD
MODERATE SEVERE
ER
O
S
IO
N
SEVERITY
LEFT CONDYLE
AXIAL
CORONAL
CHART 3- Distribution of severity of sclerosis
In left condyles
CHART 4- Distribution of severity of subchondral in left
condyles
0 20 40 60 80 100
S
C
LER
O
S
IS
Severity
LEFT CONDYLE
AXIAL
CORONAL
SAGITTAL 3D
0 20 40 60 80 100
ABSENCE SINGLE
MULTIPLE
S
U
BC
H
O
N
D
R
A
L
C
Y
S
T
Severity
LEFT CONDYLE
AXIAL
CORONAL SAGITTAL
CHART 5- Distribution of severity of osteophyte in left
condyles
CHART 6- Distribution of severity of erosion in right condyles
010 20 30 40 50 60 70 80 90 100
ABSENCE MILD
MODERATE
O
S
TEO
P
H
Y
TE
Severity
LEFT CONDYLE
AXIAL
CORONAL SAGITTAL
3D
0 20 40 60 80
ERO
SIO
N
SEVERITY
RIGHT CONDYLE
AXIAL CORONAL
SAGITTAL
CHART 7- Distribution of severity of sclerosis in right
condyles
CHART 8- Distribution of severity of subchondral cyst in right
condyles
0 20 40 60 80 100
SCLE
R
OSI
S
SEVERITY
RIGHT CONDYLE
AXIAL
CORONAL SAGITTAL
3D
0 20 40 60 80 100
ABSENCE SINGLE
MULTIPLE
SUBCH
OND
R
AL CYST
SEVERITY
RIGHT CONDYLE
AXIAL CORONAL
CHART 9- Distribution of severity of osteophyte in right
condyles
CHART 10- Distribution of severity of erosion in left glenoid
fossa
0 20 40 60 80 100
OSTE
OP
H
YTE
SEVERITY
RIGHT CONDYLE
AXIAL
CORONAL SAGITTAL
3D
0 20 40 60 80 100
ERO
SIO
N
SEVERITY
LEFT GLENOID FOSSA
AXIAL
CORONAL