Department of Mathematics and Gonda Brain Research Center, Bar-Ilan University, Ramat Gan 52900, Israel; Laboratoire
d’Immunoge´ne´tique Mole´culaire, EA3034, Faculte´ de Me´decine Purpan, Universite´ Paul Sabatier, Toulouse 3,
IFR150 (INSERM), CHU de Toulouse, 1 avenue Jean Poulhes, TSA 50032, Toulouse 31059 Cedex 9, France2; and
The Mina and Everard Goodman Faculty of Life Sciences, Bar-Ilan University, Ramat Gan, Israel3
Received 11 October 2010/Accepted 1 February 2011
Viruses employ various means to evade immune detection. Reduction of CD8ⴙT cell epitopes is one of the common strategies used for this purpose. Hepatitis B virus (HBV), a member of theHepadnaviridaefamily, has four open reading frames, with about 50% overlap between the genes they encode. We computed the CD8ⴙT cell epitope density within HBV proteins and the mutations within the epitopes. Our results suggest that HBV accumulates escape mutations that reduce the number of epitopes. These mutations are not equally distributed among genes and reading frames. While the highly expressed core and X proteins are selected to have low epitope density, polymerase, which is expressed at low levels, does not undergo the same selection. In overlapping regions, mutations in one protein-coding sequence also affect the other protein-coding sequence. We show that mutations lead to the removal of epitopes in X and surface proteins even at the expense of the addition of epitopes in polymerase. The total escape mutation rate for overlapping regions is lower than that for nonoverlapping regions. The lower epitope replacement rate for overlapping regions slows the evolutionary escape rate of these regions but leads to the accumulation of mutations more robust in the transfer between hosts, such as mutations preventing proteasomal cleavage into epitopes.
Viral evolution is affected by the need to escape destruction by lymphocytes. B cells recognize free virions through their external surface molecules, inducing escape mutations in viral surface proteins, such as hemagglutinin and neuraminidase in influenza and GP120 in human immunodeficiency virus (HIV) (8, 14, 45). CD8⫹ T cells (cytotoxic T lymphocytes [CTL]) recognize viruses through peptides presented on major histo-compatibility complex class I (MHC-I) molecules on the sur-face of infected cells or dendritic cells (DC) (53). The CTL response is associated with a rapid selection of viral CTL escape variants (20, 24), driven by a high viral mutation rate (9). This high mutation rate coupled with a short viral life cycle (24 to 72 h for many viruses [20]) allows viruses to modify their epitope repertoire within a short time to maximize their sur-vival probability. Note that a parallel evolution occurs over the human population through the selection of hosts with HLA alleles that provide optimal protection against viruses. How-ever, the rate of human adaptation is much slower than the rate of viral adaptation. It is thus reasonable to assume that the viral population’s epitope distribution reaches an optimal equi-librium within the current distribution of human HLA alleles. We have recently shown that the epitope density in many viruses is indeed optimized, with proteins critical for the viral survival having a low number of epitopes (http://peptibase.cs .biu.ac.il/peptibase/help.htm) (47–49).
Viral genomes are complex, and often different proteins overlap in their coding sequence and are encoded in different
reading frames. Gene overlap exists, among others, in papillo-maviruses, Microviridae, bacteriophages, simian immunodefi-ciency virus (SIV), HIV, and hepatitis B virus (HBV) (16, 29, 31, 36). Utilizing a short nucleotide sequence to encode more than one protein allows these viruses to be more compact but forces each protein sequence to follow the restrictions of its overlapping counterpart. Mutations in overlapping genes affect two different proteins simultaneously, and a mutation that re-moves an epitope in one protein can affect the other protein by either adding an epitope or harming the protein functionality. Such cases represent an interesting evolutionary situation of competition between overlapping proteins. We analyze the epitope distribution in overlapping genes when the immune response against one protein is more potent than it is against an overlapping protein. We show that the protein that poten-tially induces a stronger response is changed, even if the over-lapping protein may be negatively affected by these changes.
Beyond the specific issue of immune evasion in HBV, this analysis can be used as a prototype for the effect of evolution in different proteins sharing the same genetic material. This evolution is affected by two main elements: the structural or functional limitations on each of the proteins and the fitness advantage induced by mutations. We show that at least in the case of CTL epitope removal, the fitness advantage induces large differences between the two overlapping genes. The pres-ence of two overlapping genes limits the mutation rate. From the viral point of view, this limitation has a negative aspect, being the limited rate of evolution, and a positive aspect, being the stabilization of advantageous mutations, as opposed to transient mutations.
The Hepadnaviridae (hepatitis DNA viruses) contain two
genera: the orthohepadnaviruses that infect mammals and the * Corresponding author. Mailing address: Department of
Mathe-matics and Gonda Brain Research Center, Bar-Ilan University, Ramat Gan 52900, Israel. Phone: 972-3-5317610. Fax: 972-3-7384057. E-mail: [email protected].
䌤Published ahead of print on 9 February 2011.
4558
on November 7, 2019 by guest
http://jvi.asm.org/
avihepadnaviruses that infect birds (19). These viruses have genomes of 3 to 3.3 kbp, which are extremely small compared with those of other DNA viruses (18). HBV, the only member of theHepadnaviridaefamily that infects humans, is a small, enveloped virus with a partially double-stranded circular DNA genome of 3.2 kbp. HBV has a high prevalence—with about 350 million carriers of HBV worldwide (http://www.who.int /mediacentre/factsheets/fs204/en/). The HBV genome contains the following four protein-coding open reading frames. (i) The precorecore reading frame codes for the capsid protein (core) and for the hepatitis B e antigen (HBeAg) protein whose function is not fully clear. HBeAg is known to be secreted and is thought to have a role in the regulation of the immune response (5, 6, 12, 33, 34). (ii) In the same transcript (called pregenomic RNA [pgRNA]), which also acts as a template for the virus replication, there is the open reading frame for poly-merase, which has reverse transcriptase activity (4, 11). (iii) The pre-SS open reading frame codes for surface proteins: large, middle, and small intermembrane proteins located on the endoplasmic reticulum (ER) membrane. The large surface protein is probably the protein that interacts with the receptor on the hepatocyte membrane and has a role in the release of the virus from the cell (4, 11). (iv) The fourth open reading frame codes for the X protein, which is thought to have tran-scription regulation activity in some studies (15, 27, 51). It is also proposed to have a cytosolic function as a regulator of the proteasome cleavage of some proteins (44). The entire surface gene, the C terminus of precore/core, and the N terminus of X overlap with polymerase (Fig. 1) (19).
In general, it is more advantageous for the virus to remove epitopes in proteins with high copy numbers than in proteins with low copy numbers. The latter would have a low total epitope number even if each protein copy has a high epitope density. Epitope generation from degraded molecules occurs at a rate of about 1/10,000 epitope/molecule (39). Thus, if a protein has a low copy number in the cell, it will practically never produce epitopes. Similarly, immune recognition of early proteins can lead to viral destruction before budding/bursting can occur, while the detection of late-expressed proteins may not affect the infected-cell survival. Thus, viruses have a clear advantage in hiding early or highly expressed proteins more than late- or lowly expressed ones (13, 47–49). If two proteins are encoded (at least partially) by the same DNA sequence in different reading frames, mutations resulting in epitope dele-tion in one reading frame may also affect the other reading frame. For such a case, we hypothesize that the selection
against epitopes will occur in proteins whose detection induces a stronger danger to the virus. We here test this hypothesis using the HBV epitope repertoire as a test case.
MATERIALS AND METHODS
Viral sequences.HBV and nonhuman hepadnaviruse (ground squirrel hepa-titis virus [GSHV], woodchuck hepahepa-titis virus [WHV], duck HBV [DHBV], and goose HBV [GHBV]) gene sequences were used for this analysis. The sequences were obtained from the NCBI (http://www.ncbi.nlm.nih.gov/) database. We used genotype A (HBV-A) to represent human HBV and used 107 sequences of each protein of HBV-A. These proteins were taken from complete genome data, so all protein sets contain proteins from the same sources. For WHV, we used 9 core sequences, 26 polymerase sequences, 23 X sequences, and 19 surface sequences. For GSHV, we used 5 core sequences, 5 polymerase sequences, 5 X sequences, and 2 surface sequences. For GHBV, we used 10 core sequences, 10 polymerase sequences, and 10 surface sequences, and for DHBV, we used 18 core sequences, 26 polymerase sequences, and 21 surface sequences. In all proteins, we used only sequences that have at least 80% of the consensus sequence length.
SIR score.We have analyzed the ratio between the numbers of epitopes presented in viral genes and their random counterparts. This ratio was defined as the size of the immune repertoire (SIR) score. The epitope number was com-puted using the sequential application of three algorithms: a homemade protea-somal cleavage algorithm (13), a TAP binding algorithm developed by Peters et al. (38), and the BIMAS MHC binding algorithm (35). Each such algorithm produced a score for each peptide. Thresholds were defined for each stage (proteasomal cleavage, TAP binding, and MHC-I binding), and peptides that passed all three thresholds were defined as epitopes. The proper thresholds for the cleavage and TAP binding were learned for each stage separately by the use of experimental measurements appropriate for that relevant stage.
For the MHC-I binding algorithm, epitopes were computed for 33 common HLA alleles. The average epitope number of a protein was computed as the weighted average of the number of epitopes per HLA allele, using the human HLA frequencies as weights. Note that although genotype A of HBV is present mainly in the western population, the allele frequency of the Caucasian popu-lation is not very different from the average sampled allele distribution in the dbMHC (http://www.ncbi.nlm.nih.gov/projects/gv/mhc/ihwg.cgi). The qualities of the algorithms were systematically validated against epitope databases, and the algorithms were found to have high specificities and sensitivities. A detailed description of the algorithms, their validation, and the SIR score can be found in previous work (e.g., reference 48). For a given HLA allele, the total fraction of epitopes in a given protein is typically around 1% of all possible 9-mers (17), which is also the approximate fraction of epitopes predicted by the algorithm. Since we detect most published epitopes, we can reasonably assume that most epitopes predicted by the algorithm are indeed true epitopes. Still, at this stage, we have no definite measure of the fraction of true positives among all peptides defined as positive.
Statistical analysis.A two-wayttest with unknown and unequal variance was used to compare the SIR scores of viral proteins in human and nonhuman hosts, as well as the SIR score of viral proteins and their scrambled version. When comparing viruses one to another, the average SIR score of the virus was used. When comparing proteins, the SIR score of each protein was used.
[image:2.585.138.451.69.163.2]A chi-square test was used to compare the replacement and silent mutation rates, as well as the fraction of mutations leading to epitope removal. FIG. 1. Scheme of HBV genomic structure. Each HBV protein was divided into overlapping regions (C2, P1, P3, P5, Surface (the whole gene), and X1) and nonoverlapping (C1, P2, P4, X2) regions. All reading frames are transcribed in the same direction (left to right), but one reading frame has a shift of 1 nucleotide.
on November 7, 2019 by guest
http://jvi.asm.org/
sequence from WHV was added to properly position the root of the tree and reconstruct the ancestral sequences. To avoid ambiguous nucleotides in internal nodes, when both child sequences had a gap in a certain locus, the parental nucleotide was changed to a gap as well. If one of the child sequences had a nonambiguous nucleotide, the parental nucleotide was changed accordingly. Note that given the random sampling of sequences, the observed “mutations” are not real mutations occurring in a given virus, but rather the accumulation of mutations (probably back and forth) in many viruses. The vast majority of sequences had no insertions or deletions, and in none of the sequences (except for the outgroup) were there any large (more-than-3-amino acid) insertions or frame shifts. Sequences containing an early stop codon were removed from the analysis. All DNA sequences in the tree were translated to amino acids (includ-ing sequences in internal nodes). The result(includ-ing amino acid sequences were then used to compute epitopes for all alleles in our study using the Peptibase web-server (http://peptibase.cs.biu.ac.il/peptibase/).
For each protein, the following classification of mutations was performed for all human HLA alleles in our study: (i) a mutation occurring inside an epitope, within the septuplet of nonflanking amino acids (for example, in the 11-mer A-CGRTIKLMQ-T, a mutation occurring in GRTIKLM); (ii) a mutation oc-curring in the flanking regions of an epitope (the leftmost and rightmost amino acids of the epitope and the first N- and C-flanking positions (for example, in the 11-mer A-CGRTIKLMQ-T, a mutation occurring in A-C or Q-T); and (iii) a mutation occurring in a region without epitopes. Note that if more than one mutation occurred in the same amino acid, these mutations were considered a single mutation.
Each mutation was then classified into one of the following 8 mutation types: (i) silent mutation; (ii) F2F, a mutation occurring inside the flanking region of an epitope, without eliminating it; (iii) E2E, a mutation occurring inside an epitope, without eliminating it; (iv) N2F, a mutation occurring outside an epitope, cre-ating a new epitope by changing the flanking region; (v) N2E, a mutation occurring outside an epitope, creating a new epitope by changing the internal septuplet; (vi) N2N, a nonsilent mutation that neither abolished an existing epitope nor created a new one; (vii) F2N, a mutation occurring in a flanking region that abolished the epitope; and (viii) E2N, a mutation occurring inside a septuplet that abolished the epitope. An amino acid that had more than one classification (e.g., amino acids that are a part of two overlapping epitopes) was accounted for twice. Epitopes shared between two adjacent segments of the same protein were not taken into account.
The fraction of epitopes in each category was computed for each allele. The total fraction of each category was defined as the weighted average over the relevant HLA alleles, using the same weighting as that used for the SIR score.
RESULTS
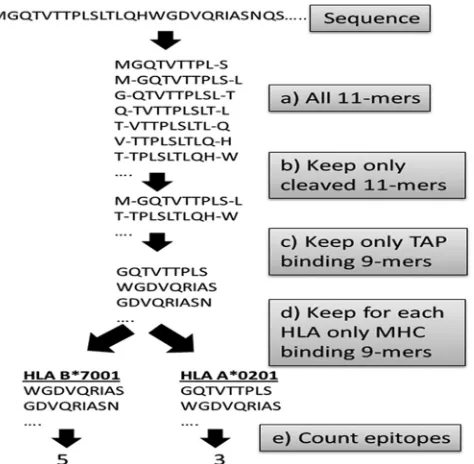
SIR score.We have previously conducted a systematic anal-ysis of the predicted CTL epitope repertoire in human and foreign proteins and defined the normalized epitope density as the size of the immune repertoire (SIR) score (13, 25, 26, 47–50). The number of predicted CTL epitopes from a se-quence was computed by applying a sliding window of nine amino acids and computing for each 9-mer (and its two flank-ing residues) whether it is cleaved by the proteasome and whether it binds to TAP channels and to a given MHC-I allele (Fig. 2). The SIR score was defined as the ratio between the computed CTL epitope density (fraction of 9-mers that were predicted to be epitopes) and the epitope density expected within the same number of random 9-mers. These random 9-mers were taken from a long random peptide built using the amino acid distribution calculated over the sequences of all fully sequenced viruses available and taking into account the
correlation between the frequencies of neighboring amino ac-ids in these viruses (48). An average SIR score of less than 1 represents an underpresentation of epitopes, whereas an aver-age SIR score of more than 1 represents an overpresentation of epitopes. For example, assuming a hypothetical sequence of 1,008 amino acids (1,000 9-mers) containing 15 HLA A*0201 predicted epitopes, if the average epitope density of HLA A*0201 in a large number of random proteins with an amino acid distribution typical of viruses was 0.01 (i.e., 10 epitopes in 1,000 9-mers), then the SIR score of the sequence for HLA A*0201 would be 1.5 (15/10). The average SIR score of a protein was defined as the average of the SIR scores for each HLA allele, weighted by the allele’s frequency in the average human population. Note that this normalization factor can perhaps bias the results. We thus use in all following results a comparative analysis of the SIR scores that is not sensitive to the denominator of the SIR score.
Epitope prediction validation. The precision of the SIR score was validated in multiple studies (47–49). Here again, before performing a systematic analysis of the HBV epitope repertoire, we tested our epitope detection methodology on all published HBV epitopes in the IEDB database (correct as of 14 January 2010) (http://iedb.org/). Among 70 published HBV epitopes, 65 exceeded our binding score cutoff (see Table S1 posted at http://peptibase.cs.biu.ac.il/frames/JVI-2142-10.doc). Note that most MHC-I binding studies are in vitro binding experiments, and thus, the epitopes are not naturally pro-FIG. 2. Algorithm for SIR score computation. (a) Each protein is divided into all 9-mers and the appropriate flanking regions, except for the first and last 9-mers, which have a single flanking position. (b) For each 11-mer a cleavage score is computed, and only peptides with a positive cleavage score are maintained. (c) We compute for all remain-ing 9-mers a TAP bindremain-ing score and choose only suprathreshold pep-tides. (d) The MHC binding score of all TAP binding and cleaved 9-mers is computed. (e) 9-mers passing all these stages are defined as epitopes. We then compute the number of epitopes per protein per HLA allele. The ratio between the number of predicted epitopes and the parallel number for a random sequence is defined as the SIR score.
on November 7, 2019 by guest
http://jvi.asm.org/
[image:3.585.305.542.69.301.2]cessed. Therefore, they may have proteasomal cleavage or TAP binding scores below our cutoff. Among the 5 epitopes that did not pass our binding score cutoff, 3 had scores very close to the cutoff, while 2 had suspiciously low binding scores: SAICSVVRR and STNRZSGRQ had scores of 0.0005 and 3e⫺5, respectively, for A*0201 (with a cutoff of 1.2572). We checked the source of these epitopes and found that although they were reported as positive epitopes, they had very low binding affinity. SAICSVVRR has an 50% inhibitory concen-tration (IC50) of 1,429 nM (while the other epitopes predicted
in this study have an IC50score of 5 to 79 nM) (1). STNRZ SGRQ binding was measured by biotinylating the peptide and measuring the fluorescence compared with background fluo-rescence (MHC in the absence of bound biotinylated peptide). There was not much difference between the MHC-peptide complex and the background (21). Thus, we conclude as in previous studies that the false-negative rate is less than 10%. On average 1 to 2% of all 9-mers are predicted to be epitopes in our analysis (depending on the allele), and the total number of epitopes in a protein is typically 1 to 2% of that of candidate 9-mers, so we expect that the majority of predicted epitopes are true epitopes, although we cannot provide a formal limit on the fraction of false positives. In the following sections, we use multiple controls to ensure that our results truly represent a biological phenomenon.
HBV versus nonhuman hepadnaviruses.We first tested for a general decrease in the epitope density in HBV. We used the SIR score to evaluate the epitope density in each protein compared to the score of the same protein in nonhuman or-thologues. The SIR baselines defined by random viruses can bias the result, since different proteins have different amino acid compositions. While the basic characters of a protein are conserved during evolution, the immunological characters are species specific. Nonhuman hosts have different MHC and TAP molecules (although they share a similar proteasome) (3, 23, 28, 46). Thus, if a specific evolutionary pressure induces epitope removal in HBV, its SIR score should be lower than the ones of nonhuman hepadnaviruses. The average HBV SIR score as well as the scores of the HBV surface, core, and X proteins are indeed significantly lower than those in other
hepadnaviruses (t test, P ⬍ 5e⫺3) (Fig. 3) (note that X is expressed exclusively in mammalian hepadnaviruses). In poly-merase, however, the SIR score of the HBV protein is similar to or even higher than the nonhuman hepadnaviruses protein (ttest,P⬍5e⫺3). Thus, evolutionary pressure seems to affect the epitope number in core, surface, and X proteins, but not in polymerase. The high epitope density in polymerase can be due either to a high fitness cost of mutations or to the weak immune pressure induced by polymerase, as shall be further discussed.
As mentioned above, core and polymerase are both trans-lated from the same transcript. However, since core is a struc-tural protein, it exists in 240 copies per virion, while polymer-ase has one copy per virion. The ribosome usually starts to translate from the precore start codon and is shunted to the initiation codon for polymerase only once every 200 to 300 cases (40). The precore gene encodes the HBeAg, a secreted protein that shares most of its sequence with core. This pro-tein, being secreted, was proposed to cause a “split tolerance,” which consists of a Th2-type immune response, with promotion of antibody production limiting the Th1 response. On the other hand, a CD8⫹T-cell response against core-derived epitopes has been shown (7, 22, 41, 42, 52, 55). One can thus assume that in the HBeAg region, selection against the CD8⫹T cell epitope is taking place.
X can accumulate 10,000 to 50,000 copies per cell in WHV-hepadnavirus infected woodchucks (10). We assume that the protein copy number in HBV is not very different. Surface is a structural protein. It also exists in multiple copies per virion. By the same logic, the virus should attempt to hide it. Thus, based simply on the copy number, it is indeed expected that X, core, and surface should be subject to a more stringent pres-sure than polymerase.
[image:4.585.133.451.70.219.2]Since the above SIR score is averaged over the 33 most frequent HLA alleles, we further tested the SIR score of HBV for each allele separately and compared it to those of all other hepadnaviruses in our study (GSHV, WHV, DHBV, and GHBV) for the same allele. As expected, the same pattern (namely, a lower SIR score for the average of all HBV proteins as well as, specifically, core, surface, and X proteins, and a FIG. 3. SIR score of hepadnavirus proteins. SIR score of hepadnavirus (hepatitis B virus [HBV], ground squirrel hepatitis virus [GSHV], woodchuck hepatitis virus [WHV], duck hepatitis B virus [DHBV], goose hepatitis B virus [GHBV]) proteins. Avihepadnaviruses (DHBV and GHBV) lack the X protein. Asterisks represent aPvalue of⬍0.005 versus the average of the others. In all proteins but polymerase, the HBV score is significantly lower than its nonhuman counterparts in all cases.
on November 7, 2019 by guest
http://jvi.asm.org/
higher SIR score for polymerase in HBV than those of other hepadnaviruses) was shown in most alleles, mainly in the al-leles with a higher frequency in the human population (ttest,
P⬍0.05).
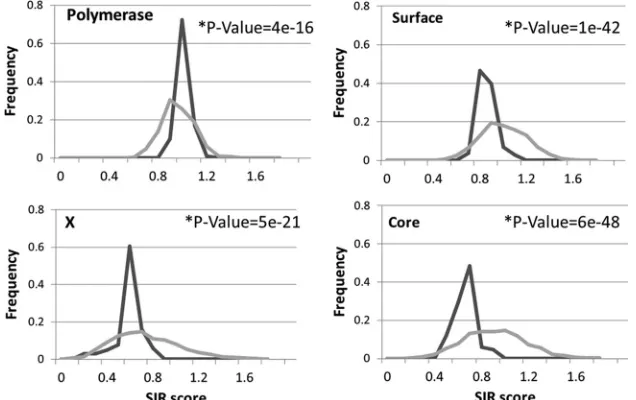
Inherent limitations and selection. Among the proteins found to have low SIR scores in HBV, the SIR score of surface is relatively high, while core and X proteins have significantly lower scores (ttest,Pvalue⬍1.e⫺33) (Fig. 3). This difference can originate from differences in the immune pressure induced by these proteins or by inherent limitations on the amino acid composition. To differentiate between the two mechanisms, we tested the “neutral” SIR score of each protein. We define the neutral SIR score as the SIR score of random sequences de-rived from scrambling each protein. In other words, instead of scrambling full viral genomes, we scrambled each viral protein by itself 1,000 times and compared the scrambled sequences’ SIR score distribution to the SIR score distribution of 107 nonscrambled sequences of the same protein (Fig. 4). The real sequences of core, surface, and X have a lower average SIR score than the scrambled sequences (ttest,P⬍1.e⫺20). Real polymerase sequences have higher SIR scores (P ⬍1.e⫺15) than their scrambled version. Note that the differences be-tween core, X, and surface proteins disappear when a compar-ison is performed between the real SIR score and the neutral SIR score. Thus, core, surface, and X proteins seem to induce similar immune responses.
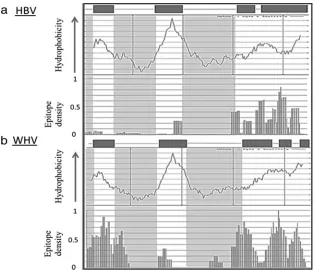
Structural limitations.Surface is an intermembrane protein, and the reason for the high absolute SIR score in surface (and its scrambled versions) may simply be its hydrophobicity. If this is indeed the case, we expect that most of the differences seen between HBV surface and its nonhuman orthologues will be in the hydrophilic, outermembrane regions. It is shown in Fig. 5 that this is indeed the case. The hydrophobic regions contain many more epitopes than the hydrophilic regions in both the HBV and WHV regions. In the hydrophilic regions, HBV has
almost no epitopes, while WHV surface has a large number of epitopes. These results suggest that the relatively high epitope density in HBV surface is due to an inherent character, namely, the hydrophobic amino acid composition.
Overlap between genes.HBV polymerase has a higher SIR score than its nonhuman counterparts as well as its own scram-bled sequence. Thus, not only did HBV not evolve to reduce the epitope number in polymerase, it actually increased it. The simplest reason for this increase could be the overlap of poly-merase with other proteins (Fig. 1) and the effect that muta-tions in other proteins could have on polymerase. Core over-laps with polymerase in 50 amino acids in its C terminus (25% of its length). Surface fully overlaps with polymerase. X over-laps with polymerase in its N terminus half (slightly more than 50% of its length). We divided each protein into overlapping and nonoverlapping regions. Polymerase was divided into 5 regions (P1 to P5), core and X were divided into 2 regions each (C1 and C2 and X1 and X2, respectively), and surface fully overlaps with polymerase and thus was not divided (Fig. 1).
Polymerase has a higher SIR score than core and x in the overlapping regions (ttest,P⬍1e⫺41) and a lower SIR score than surface (P⬍1.e⫺35), for which structural limitations may play a role (Fig. 5). Moreover, the net difference in SIR scores between human and nonhuman (WHV) counterparts in all genes, except for polymerase, is either practically null or sig-nificantly negative (P ⬍ 1e⫺4 and P ⬍ 1e⫺18 for X and surface, respectively; C2 in both human and nonhuman viruses has practically the same SIR score, as will be discussed later). In polymerase it is positive in some regions (P3, P4, and P5) (P ⬍ 1e⫺10) (Fig. 6). The most significant increase in the polymerase epitope density between HBV genes and WHV can be observed for the region in which it overlaps with surface and X (P3 and P5 in Fig. 6) (ttest,P⬍2e⫺22 andP⬍2e⫺35, respectively).
[image:5.585.133.451.71.271.2]To further test the correlation between the increase in the FIG. 4. SIR score versus neutral SIR score in HBV proteins. Histogram of SIR score distribution of HBV sequences (dark lines) and that of the same sequences, but scrambled (gray lines). X, core, and surface have lower epitope densities than their scrambled counterparts, while polymerase has a higher one.Pvalues are presented for each plot. Thexaxis is the SIR score, and theyaxis is the probability of observing such a score in the sequences.
on November 7, 2019 by guest
http://jvi.asm.org/
polymerase epitope density and the parallel decrease in the surface and X epitope densities in the overlapping regions, we performed a linear regression of the SIR scores of polymerase isolates versus the SIR score of either the surface and X pro-teins taken from the same HBV sequence. The surface versus polymerase regression showed no significant correlation. How-ever, in the X-versus-polymerase case, a strong negative cor-relation was observed between the X and polymerase SIR scores, with a correlation coefficient of⫺0.38 (P⬍1.e⫺4) (see Fig. S1 posted at http://peptibase.cs.biu.ac.il/frames/JVI-2142 -10.doc). This clear negative correlation supports the tradeoff hypothesis: in overlapping regions, in which the same mutation affects two proteins, epitope deletion mutations will be se-lected in one preferable protein, even at the cost of adding epitopes in the other protein.
The limited reduction in the epitope number in core prob-ably results from its amino acid composition in the overlapping region. About one third of the core sequence in this region is composed of arginines. This arginine-rich region is a conserved region responsible for pgRNA binding of the virion (32). The epitope density of 1,000 scrambled sequences with the same amino acid composition leads to an SIR score of 0.4, suggest-ing that this amino acid composition does not allow the cre-ation of many epitopes. Moreover, both HBV and WHV share the exact same epitope sequence in this sequence (RTPSPRR RR). Thus, the epitope density in this region of core is affected mainly by functional constraints.
Direct computation of mutations.To directly check the pres-ence of escape mutations, we built phylogeny trees of se-FIG. 6. Overlapping versus nonoverlapping regions. (A) SIR score
[image:6.585.134.449.68.338.2]of overlapping and nonoverlapping proteins, in HBV. The gray col-umns are surface, X, and core, and the dark ones are polymerase. In regions overlapping with core and X (P1 and P5), polymerase has a higher SIR score, while in the region overlapping with surface (P3), polymerase has a lower score (P⬍1.e⫺35 for all SIR score differences in overlapping regions), probably due to the hydrophobicity of surface (see the text). (B) SIR score differences between HBV and WHV. The difference is significantly negative (less epitopes in HBV) or null for X, core, and surface. In polymerase areas, the difference can be either significantly negative (in P1 and P2) or significantly positive (in P3, P4, and P5) (P⬍1.e⫺4 for all regions except C2).
FIG. 5. Hydrophobicity-epitope density correlation in surface. Epitope number (normalized by HLA allele frequency) and hydrophobicity score (by the Kyte and Doolittle hydrophobicity scale) per position in the surface protein of HBV (a) and WHV (b). The grey squares above each diagram represent transmembrane domains. Epitope densities were averaged over all alleles. The darker areas are outermembrane domains. In transmembrane domains, the epitope densities are similar in HBV and WHV. However, in outer domains, almost all epitopes were removed from the HBV.
on November 7, 2019 by guest
http://jvi.asm.org/
[image:6.585.77.247.425.616.2]quences from each protein and checked the effect of each mutation. Mutations were classified as silent or replacement. Among replacement mutations, a distinction was made be-tween mutations affecting epitopes (either creating or destroy-ing epitopes) and mutations not affectdestroy-ing epitopes. We com-pared each sequence with its direct ancestor so that each mutation was counted only once, even if it affected a large number of sequences in its progeny.
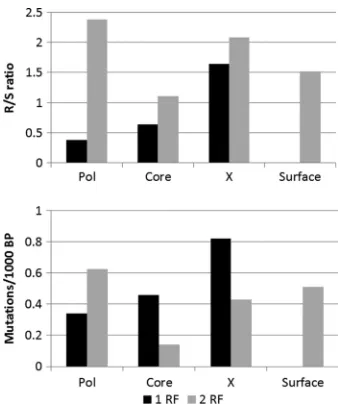
As expected in overlapping regions, the replacement-to-si-lent (R/S) rate is higher than in nonoverlapping regions, since many silent mutations in one reading frame result in replace-ment mutations on the other reading frame and it is harder to find silent mutations that will not induce damage in the over-lapping gene. Comparing mutation types in each protein re-veals that polymerase has a significantly higher silent mutation rate in its nonoverlapping regions than all other HBV proteins (chi-square test,P⬍1.e⫺3) and the obvious resulting lower R/S ratio. Thus, if selection is taking place in polymerase, it probably is a negative selection against mutations (43) rather than a positive selection for sequences with a low epitope number. However, in the overlapping regions, poly-merase actually has the highest R/S ratio, showing again that positive selection in the overlapping genes induces muta-tions in polymerase too. This strengthens the proposed model that positive selection affects mainly X, core, and surface and not polymerase.
To further validate this model, we analyzed the rate of epitope replacement. Since the virus transfers between hosts, often epitopes removed in one host lead to new epitopes in a different host. Thus, instead of looking at the net epitope removal rate, we analyzed the total epitope turnover. Again, as
expected by the model, polymerase has the lowest fraction of replacement mutations affecting epitopes in the nonoverlap-ping regions. Thus, not only does polymerase have few replace-ments, but within the replacereplace-ments, very few affect epitopes. In the other proteins, the results are as expected, with a higher epitope turnover (Fig. 7b) in the nonoverlapping regions than in the overlapping ones (Fig. 7a and b).
To summarize, the balance between mutations in polymer-ase and in other proteins in the overlapping regions can be observed not only at the epitope density level, but also through the direct measurement of mutations affecting epitopes.
Between-host evolution. The advantage induced by an epitope-removing mutation is usually lost when transferring to a new host since different hosts usually differ in their HLA alleles. Only mutations affecting epitopes in a non-HLA-de-pendent manner can be transferred and accumulated. Such mutations must affect the preprocessing stage of the epitopes, mainly the destruction of proteasomal cleavage sites. There is evidence that viruses do attempt to remove cleavage sites (30). We have checked whether the fraction of peptides that can be cleaved and passed through TAP is indeed low in the HBV proteins. We compared this fraction in HBV to the fraction in the scrambled version of the same proteins. The fraction of preprocessed peptides was indeed either similar or lower in the real proteins (no significant difference in core and polymerase [10.8% versus 10.6% and 11.6% versus 11.9%, respectively] and a highly significant decrease in X and surface [7% versus 9% and 11% versus 12%, respectively, andP⬍1e⫺31]).
To further check the reduction in the fraction of prepro-cessed epitopes, we compared the number of mutations that remove and add proteasome cleavage sites in pairs of parent-son sequences in the HBV phylogenic tree. Again, in practi-cally all tested regions of the HBV coding sequences (except for one region in polymerase), there is a significantly higher number of mutations that reduce cleavage sites than of muta-tions adding cleavage sites (P⬍0.01 for all regions except P1 and P2) (Fig. 8). This net removal of proteasome cleavage sites along the history of HBV may be the solution that viruses have FIG. 7. R/S ratio and epitope turnover in overlapping and
[image:7.585.77.246.67.270.2]nonover-lapping regions in HBV. (Top) The R/S ratio in each region; (bottom) the number of mutations per 1,000 nucleotides either adding or re-moving an epitope between a father sequence and its son in the phylogenic tree. Black bars represent a single reading frame (1 RF), and gray bars represent overlapping reading frames (2 RF). The R/S ratio is significantly higher in regions with two reading frames (P⬍ 0.01), since there are few mutations that are simultaneously silent in the two reading frames. The epitope turnover is higher in the over-lapping frames, except for polymerase.
FIG. 8. Net decrease in the number of epitopes through mutations affecting the cleavage site (epitope removal/1,000 nucleotides in fa-ther-son pair). In each region, we computed the difference between the number of epitopes removed through mutations at the cleavage site and the number of epitopes added the same way. The difference is significantly positive in all regions (P⬍0.01) except for P1 and P2. The epitopes removed this way are not sensitive to the host HLA allele. This may be the HBV method of avoiding the host HLA polymor-phism.
on November 7, 2019 by guest
http://jvi.asm.org/
[image:7.585.335.507.69.184.2]developed against the barrier to transmission imposed by the human HLA polymorphism.
DISCUSSION
The effect of the overlap between viral genomic regions has traditionally been analyzed in the context of a genetic mecha-nism to maintain the protein function in the two overlapping genes. Pavesi et al. (37) have shown, for example, an increased frequency of amino acid residues with a high level of degen-eracy (arginine, leucine, and serine) in the proteins encoded by overlapping genes. Beyond the codon usage, the relative posi-tions of the codons have been proposed to be important. Zaai-jer et al. (54) have shown that the overlapping surface and polymerase genes of HBV evolve independently. They showed that most of the replacement mutations occur in P1/S3 (the nucleotide in the first position in polymerase codons and in the third position in surface codons) and P3/S2, while P2/S1 mu-tations are very rare.
We have here shown an interesting imbalance in the evolu-tion of overlapping genes against the external threat of the immune response. In order for a virus to survive in the pres-ence of a CTL immune response, it must minimize the total number of exposed epitopes. Given the high number of protein copies required to produce an epitope, proteins with low ex-pression levels present practically no epitopes and pose no threat to the virus. In each replication cycle, HBV produces several polymerase copies and hundreds to thousands of its structural proteins (surface and core) (20). X, as a transcrip-tion regulator, also has to be replicated in multiple sequences, as suggested by some studies. We have shown that HBV is evolving to avoid epitopes in core, surface, and X in general and in their overlapping regions specifically. All genes overlap with polymerase, but since polymerase does not constitute a significant threat, most of the immune-induced evolution is taking place in the other genes and not in polymerase. The difference between polymerase and the other proteins can be observed at the following multiple levels. (i) The absolute epitope density is lower in other proteins than in polymerase. (ii) The predicted human epitope density in HBV polymerase is higher than that in its nonhuman counterparts, while for other proteins it is lower. (iii) The predicted human epitope density in polymerase is higher than that in scrambled se-quences of the same gene, while it is lower for all other pro-teins. (iv) The epitope turnover along a phylogeny tree is lower in polymerase’s nonoverlapping regions than in those of other proteins, and the R/S ratio is higher. (vi) In regions in which polymerase does not overlap with other genes, it has few re-placement mutations and even fewer epitope-replacing muta-tions. Taken together, these results highlight the preferential hiding of epitopes in specific proteins.
We have previously shown with other viruses that the ex-pression pattern has a significant effect on the epitope density in viral proteins (47–49). In HIV and some herpesviruses, early proteins contain much fewer candidate epitopes than the late ones. There is currently no precise information regarding the HBV protein order of expression. However, core and polymer-ase are expressed approximately simultaneously (with a 250:1 copy number ratio). Thus, in HBV, the protein copy number
more than the expression time seems to affect the epitope density.
Within each protein the comparison between the overlap-ping and nonoverlapoverlap-ping regions raises an interesting issue. The extra cost of mutating overlapping regions can actually be an advantage. Since the virus is transferred between hosts with differing HLA alleles, a precise adaptation to the current host can be detrimental for the adaptation to the average-popula-tion HLA binding motifs. Thus, regions that can mutate too easily may lose the evolutionary advantage obtained at the total population level. This can be seen, for example, with consistently lower SIR scores for overlapping regions than for nonoverlapping regions (obviously except for polymerase). The advantage of having a high mutation cost in the presence of fluctuating environments may actually be a generic feature in evolution that has implications beyond the current example. Some mutations are, however, consistently advantageous. These mutations affect the preprocessing stages of epitope presentation. We have shown in two complementary ways that such mutations are systematically preferred along the HBV evolution.
The final element affecting the epitope density in HBV is structural limitations. Surface, for example, is a membrane-bound protein and thus has many hydrophobic residues. Thus, in surface, most epitope-reducing mutations are in the nonhy-drophilic regions. Similar results can be observed with the arginine-rich regions of core.
Taken together, these results highlight the main elements affecting viral evolution in general: genetic constraints, func-tional constraints, and the stress induced by the environment. HBV epitopes show a complex mixture of these three ele-ments.
A possible caveat with these results is that the length of the proteins may affect the selective force. In a previous work (47), we showed that in HIV, early-expressed proteins have a SIR score lower than that of later-expressed proteins. In HIV, the largest proteins that are expressed later have a relatively high score (more than 0.75 for pol, env, and gag). However, nef, 207 amino acids in length, has a SIR score higher than those of pol and env (1,000- and 850-amino acid-length proteins, respec-tively). Thus, the effect of length on epitope density is not straightforward. A correlation may exist between the length of proteins and other features. For example, in many cases, and particularly in HBV, the size of a protein reflects its character and, consequently, its expression level. This subject will now be studied in detail over a large number of viruses.
REFERENCES
1.Bertoni, R., et al.1998. Human class I supertypes and CTL repertoires extend to chimpanzees. J. Immunol.161:4447–4455.
2. Reference deleted.
3.Burgevin, A., et al.2008. A detailed analysis of the murine TAP transporter substrate specificity. PLoS One3:e2402.
4.Cattaneo, R., H. Will, and H. Schaller.1984. Hepatitis B virus transcription in the infected liver. EMBO J.3:2191–2196.
5.Chang, C., et al.1987. Expression of the precore region of an avian hepatitis B virus is not required for viral replication. J. Virol.61:3322–3325. 6.Chen, H. S., et al.1992. The precore gene of the woodchuck hepatitis virus
genome is not essential for viral replication in the natural host. J. Virol.
66:5682–5684.
7.Chen, M. T., et al.2004. A function of the hepatitis B virus precore protein is to regulate the immune response to the core antigen. Proc. Natl. Acad. Sci. U. S. A.101:14913–14918.
8.Cleveland, S. M., H. P. Taylor, and N. J. Dimmock.1997. Selection of neutralizing antibody escape mutants with type A influenza virus HA-specific
on November 7, 2019 by guest
http://jvi.asm.org/
verse transcriptase is terminally redundant. Cell 297–308.
12.Garcia, P. D., J. H. Ou, W. J. Rutter, and P. Walter.1988. Targeting of the hepatitis B virus precore protein to the endoplasmic reticulum membrane: after signal peptide cleavage translocation can be aborted and the product released into the cytoplasm. J. Cell Biol.106:1093–1104.
13.Ginodi, I., T. Vider-Shalit, L. Tsaban, and Y. Louzoun.2008. Precise score for the prediction of peptides cleaved by the proteasome. Bioinformatics
24:477–483.
14.Gulati, U., et al.2002. Antibody epitopes on the neuraminidase of a recent H3N2 influenza virus (A/Memphis/31/98). J. Virol.76:12274–12280. 15.Haviv, I., M. Shamay, G. Doitsh, and Y. Shaul.1998. Hepatitis B virus pX
targets TFIIB in transcription coactivation. Mol. Cell. Biol.18:1562–1569. 16.Hughes, A. L., K. Westover, J. da Silva, D. H. O’Connor, and D. I. Watkins.
2001. Simultaneous positive and purifying selection on overlapping reading frames of the tat and vpr genes of simian immunodeficiency virus. J. Virol.
75:7966–7972.
17.Istrail, S., et al.2004. Comparative immunopeptidomics of humans and their pathogens. Proc. Natl. Acad. Sci. U. S. A.101:13268–13272.
18.Kidd-Ljunggren, K.1996. Variability in hepatitis B virus DNA: phylogenetic, epidemiological and clinical implications. Scand. J. Infect. Dis.28:111–116. 19.Knipe, D. M. et al. (ed.)2007. Fields virology, 5th ed. Lippincott Williams &
Wilkins, Philadelphia, PA.
20.Knipe, D. M., et al. (ed.).2001. Fields virology, 4th ed. Lippincott Williams & Wilkins, Philadelphia, PA.
21.Kobayashi, H., et al.1995. Analysis of naturally processed human histocom-patibility leukocyte antigen class I-bound peptides from hepatocellular car-cinoma tissues in vivo. Jpn. J. Cancer Res.86:962–968.
22.Kuho¨ber, A., et al.1996. DNA immunization induces antibody and cytotoxic T cell responses to hepatitis B core antigen in H-2b mice. J. Immunol.
156:3687–3695.
23.Kuma´novics, A., T. Takada, and K. F. Lindahl.2003. Genomic organization of the mammalian MHC. Annu. Rev. Immunol.21:629–657.
24.Lichterfeld, M., X. G. Yu, S. Le Gall, and M. Altfeld.2005. Immunodomi-nance of HIV-1-specific CD8(⫹) T-cell responses in acute HIV-1 infection: at the crossroads of viral and host genetics. Trends Immunol.26:166–171. 25.Louzoun, Y., and T. Vider.2004. Score for proteasomal peptide production
probability. Immunology1:45–50.
26.Louzoun, Y., T. Vider, and M. Weigert.2006. T-cell epitope repertoire as predicted from human and viral genomes. Mol. Immunol.43:559–569. 27.Maguire, H. F., J. P. Hoeffler, and A. Siddiqui.1991. HBV X protein alters
the DNA binding specificity of CREB and ATF-2 by protein-protein inter-actions. Science252:842–844.
28.Miller, M. M., et al.2004. 2004 Nomenclature for the chicken major histo-compatibility (B and Y) complex. Immunogenetics56:261–279.
29.Mizokami, M., et al.1997. Constrained evolution with respect to gene over-lap of hepatitis B virus. J. Mol. Evol.44(Suppl. 1):S83–S90.
30.Mu¨nz, C.2004. Epstein-Barr virus nuclear antigen 1: from immunologically invisible to a promising T cell target. J. Exp. Med.199:1301–1304. 31.Narechania, A., M. Terai, and R. D. Burk.2005. Overlapping reading frames
in closely related human papillomaviruses result in modular rates of selec-tion within E2. J. Gen. Virol.86:1307–1313.
32.Nassal, M.1992. The arginine-rich domain of the hepatitis B virus core
vidual peptide side-chains. J. Immunol. 163–175.
36.Pavesi, A.2006. Origin and evolution of overlapping genes in the family Microviridae. J. Gen. Virol.87:1013–1017.
37.Pavesi, A., B. De Iaco, M. I. Granero, and A. Porati.1997. On the informa-tional content of overlapping genes in prokaryotic and eukaryotic viruses. J. Mol. Evol.44:625–631.
38.Peters, B., S. Bulik, R. Tampe, P. M. V. Endert, and H. G. Holzhutter.2003. Identifying MHC class I epitopes by predicting the TAP transport efficiency of epitope precursors. J. Immunol.171:1741–1749.
39.Princiotta, M. F., et al.2003. Quantitating protein synthesis, degradation, and endogenous antigen processing. Immunity18:343–354.
40.Sen, N., F. Cao, and J. E. Tavis.2004. Translation of duck hepatitis B virus reverse transcriptase by ribosomal shunting. J. Virol.78:11751–11757. 41.Sendi, H., et al.2009. CTL escape mutations of core protein are more
frequent in strains of HBeAg negative patients with low levels of HBV DNA. J. Clin. Virol.46:259–264.
42.Shi, T. D., Y. Z. Wu, Z. C. Jia, L. Y. Zou, and W. Zhou.2004. Therapeutic polypeptides based on HBV core 18–27 epitope can induce CD8⫹ CTL-mediated cytotoxicity in HLA-A2⫹human PBMCs. World J. Gastroenterol.
10:1902–1906.
43.Shlomchik, M. J., A. H. Aucoin, D. S. Pisetsky, and M. G. Weigert.1987. Structure and function of anti-DNA autoantibodies derived from a single autoimmune mouse. Proc. Natl. Acad. Sci. U. S. A.84:9150–9154. 44.Sirma, H., et al.1998. Cytosol is the prime compartment of hepatitis B virus
X protein where it colocalizes with the proteasome. Oncogene16:2051–2063. 45.Stevceva, L., V. Yoon, D. Anastasiades, and M. C. Poznansky.2007. Immune responses to HIV Gp120 that facilitate viral escape. Curr. HIV Res.5:47–54. 46.Tanaka, K., and C. Tsurumi. 1997. The 26S proteasome: subunits and
functions. Mol. Biol. Rep.24:3–11.
47.Vider-Shalit, T., M. Almani, R. Sarid, and Y. Louzoun.2009. The HIV hide and seek game: an immunogenomic analysis of the HIV epitope repertoire. AIDS23:1311–1318.
48.Vider-Shalit, T., V. Fishbain, S. Raffaeli, and Y. Louzoun.2007. Phase-dependent immune evasion of herpesviruses. J. Virol.81:9536–9545. 49.Vider-Shalit, T., et al.2009. Viruses selectively mutate their CD8⫹T-cell
epitopes—a large-scale immunomic analysis. Bioinformatics25:i39–i44. 50.Vider-Shalit, T., S. Raffaeli, and Y. Louzoun.2007. Virus-epitope vaccine
design: informatic matching the HLA-I polymorphism to the virus genome. Mol. Immunol.44:1253–1261.
51.Wang, Y. E., C. Zhang, J. Berzofsky, and C. DeLisi.2005. Selecting stable molecular targets for treatment and prevention of AIDS. Genome Inform.
16:254–261.
52.Wheeler, D. L., et al.2005. Database resources of the National Center for Biotechnology Information. Nucleic Acids Res.33:D39–D45.
53.Williams, A., C. A. Peh, and T. Elliott.2002. The cell biology of MHC class I antigen presentation. Tissue Antigens59:3–17.
54.Zaaijer, H. L., F. J. van Hemert, M. H. Koppelman, and V. V. Lukashov.
2007. Independent evolution of overlapping polymerase and surface protein genes of hepatitis B virus. J. Gen. Virol.88:2137–2143.
55.Zhang, Y., et al.2007. Hepatitis B virus core antigen epitopes presented by HLA-A2 single-chain trimers induce functional epitope-specific CD8⫹ T-cell responses in HLA-A2.1/Kb transgenic mice. Immunology121:105–112.
![FIG. 3. SIR score of hepadnavirus proteins. SIR score of hepadnavirus (hepatitis B virus [HBV], ground squirrel hepatitis virus [GSHV],woodchuck hepatitis virus [WHV], duck hepatitis B virus [DHBV], goose hepatitis B virus [GHBV]) proteins](https://thumb-us.123doks.com/thumbv2/123dok_us/156601.33745/4.585.133.451.70.219/hepadnavirus-hepadnavirus-hepatitis-hepatitis-woodchuck-hepatitis-hepatitis-hepatitis.webp)