A National Statistics publication
National Statistics are produced to high professional standards set out in the National Statistics Code of
Statistical First Release
Provisional GCSE and equivalent results in England,
2013 to 2014
Reference SFR 41/2014
Date 23 October 2014
Coverage England
Theme GCSEs (key stage 4)
Issued by Department for Education, Sanctuary Buildings, Great Smith Street, London SW1P 3BT
Press office 020 7783 8300
Public enquiries 0370 000 2288
Statistician David Bartholomew
Email Attainment.STATISTICS@education.gsi.gov.uk
Internet Statistics: GCSEs (key stage 4)
CHANGES TO THE PRODUCTION OF THESE STATISTICS
Two major reforms have been implemented which effect the calculation of key stage 4 (KS4) performance measures data:
1. Professor Alison Wolf’s Review of Vocational Education recommendations which; restrict the qualifications counted
prevent any qualification from counting as larger than one GCSE
cap the number of non-GCSEs included in performance measures at two per pupil
1. 2. An early entry policy to only count a pupil’s first attempt at a qualification.
Readers of this statistical first release (SFR) should review sections 2 and 3 to understand the nature and rationale of these changes before drawing conclusions from the data presented. In particular comparisons between 2013/14 and earlier years should not be made before reading
Headline results
This SFR focuses on two main measures of performance. These measures are based on the same rules used to produce the measures shown in school performance tables.
5+ A*-C grades (including English & mathematics): The percentage of pupils achieving 5 or more GCSEs or equivalent at grade A* to C (including English and mathematics).
English Baccalaureate (EBacc): Pupils achieving or entering the relevant subjects for the English Baccalaureate. The EBacc is made up of GCSEs, AS levels and Level 1/2 Certificates (which are a combination of established IGCSEs and newly developed IGCSE-style qualifications) in English, mathematics, sciences, a language and a humanities subject.
All schools
52.6
per cent
The percentage of pupils achieving 5 or more GCSEs or equivalent at grade A* to C (including English and mathematics), is 52.6 per cent in 2013/14 (Table 1a). Comparisons over time are affected by the changes outlined in sections 2 and 3. For details on the impact of these changes see section 4.1.36.1 per cent
The percentage of pupils entered for all subject areas of the English Baccalaureate increased to 36.1 per cent in 2013/14. This compares to 34.9 per cent in 2012/13 (Table 1b).22.5 per cent
22.5 per cent of pupils at the end of KS4 achieved the English Baccalaureate in 2013/14. (Table 1b). Comparisons over time are affected by the changes outlined in sections 2 and 3.State-funded schools only
55.9 per cent
The percentage of pupils achieving 5 or more GCSEs orequivalent at grade A* to C (including English and mathematics) is 55.9 per cent in 2013/14 (Table 1a). Comparisons over time are affected by the changes outlined in sections 2 and 3.
38.7 per cent
The percentage of pupils entered for all subject areas of the English Baccalaureate increased to 38.7 per cent in 2013/14. This compares to 35.5 per cent in 2012/13 (Table 1b).1.
Introduction
This statistical first release (SFR) shows GCSE and equivalent results in England. The data covers pupils at the end of key stage 4 in the 2013/14 academic year.
The Department for Education receives examination results data from awarding body organisations. The data in this SFR is provisional as, whilst it has been quality assured by the department, the underlying data has yet to be checked by schools. A revised SFR with updated data will be published in January 2015, alongside the secondary school performance tables.
GCSE and equivalent qualifications:
Each regulated qualification has a level between entry level and level eight. Qualifications which are at the same level are judged to be of a similar difficulty. This SFR only includes GCSE and equivalent qualifications approved for pre-16 teaching and eligible for inclusion in school performance measures. This includes AS levels. More information can be found on the Ofqual website.
Pupils at the end of key stage 4:
The results shown in this SFR are based on pupils reaching the end of key stage 4, typically those starting the academic year aged 15 (i.e. age of the pupil on 31 August 2013).
2.
Major reforms that affect performance measures
As outlined previously, there are two major reforms that have an impact on the 2013/14 GCSE and equivalent results. These should be taken in to consideration when looking at the latest results alongside previous years. These changes only apply to figures shown for 2013/14. The new methodology has not been applied to previous years.
Reform of vocational qualifications
The recommendations adopted from Professor Alison Wolf’s Review of Vocational Education1 take effect for the first time in the calculation of the data underpinning this SFR:
1) Only include qualifications in performance measures which meet the new quality criteria. This has led to the removal of around 3,000 unique qualifications from the performance measures between 2012/13 and 2013/14. A full list of the qualifications that can count in 2013/14 performance measures can be found here: inclusion of qualifications in 2014.
2) Adjust the associated point scores for non-GCSEs so that no qualification will count as larger than one GCSE in size. For example, where a BTEC may have previously counted as four GCSEs it will now be reduced to the equivalence of a single GCSE in its contribution to performance measures.
Introduction of early entry policy
In the past, school performance measures have been calculated using the best result that a pupil achieved in a subject, regardless of the number of times they may have been entered for it.
In September 2013, to address the significant increase in early entries, the department announced2 that only the first result a pupil achieved would count in performance measures from 2013/14. This new rule came into effect immediately with regard to English Baccalaureate subjects and will be expanded to apply to all subjects in 2014/15. This new rule only affects a school’s performance measure calculations; pupils will still be accredited with every grade achieved, regardless of the number of entries.
Further guidance on the new early entry policy and its application to the calculation of performance measures can be found here: RAISEonline: Early entry guidance.
Understanding the impact of these reforms
The above reforms have had a significant impact on the 2013/14 GCSE and equivalent results data. To aid users in understanding this impact additional data has been calculated. This is presented where appropriate in this SFR and in the underlying data tables.
This additional ‘2013 methodology’ data removes the rules regarding the Wolf Review
recommendations and early entry policy from the calculation of performance measures. It is intended to provide a point of comparison, using a proxy set of results based on 2012/13 rules. However, there are limitations to this data. It cannot reverse the behaviour of some schools that happened in
response to the policy changes nor can it mitigate for any cohort effect (differences in the abilities of pupils between years).
For example, whilst we can change the rules and count best rather than first entries, some schools will have adjusted their behaviours and stopped entering pupils for qualifications in the same patterns that they may have done before the policy was introduced. In these cases a pupil’s first entry may be their only entry. This means their result will not change when the ‘2013 methodology’ is applied to the 2013/14 data. Since the early entry policy was announced after the summer 2013 exam season, the behaviour change for early entries may be less pronounced in the 2013/14 results than the behaviour change linked to the Wolf reforms.
For ease of reference, within this statistical release, this year’s results (which will be published in the school performance tables in January) are referred to as the ‘new 2014 methodology’ results. The additional results are referred to as the ‘2013 methodology’ results.
The data sets referenced in this release apply the reforms as follow:
Performance measures using the ‘new 2014 methodology’
The 2014 performance measures will be published on the basis of only including qualifications which were identified as part of the Wolf review and also applying the rules regarding the changes in early entry policy.
Performance measures using the ‘2013 methodology’
The proxy ‘2013 methodology’ will be used to create a version of the performance measures (using the 2013/14 data), where the effects of both the Wolf review and early entry rules have been removed. This rule set will assist the department and commentators in analysing what would have happened in the absence of policy changes.
Unregulated IGCSEs, which no longer count in performance measures, as detailed in paragraph 30 in the 2011 Performance Tables Statement of intent, have been removed from both the 2013/14 results in the ‘2013 methodology’ and ‘new 2014 methodology’. This means that the ‘2013 methodology’ will differ from the exact approach used to construct the performance measures in 2012/13
Data set Applies Wolf rules Applies early entry rules
New 2014 methodology
2013 methodology
Wolf and best entry3
3.
Other changes from last year’s release
In addition to the major reforms outlined in section 2 there are a number of other changes that have been made in the 2013/14 academic year. Again these do not apply to 2012/13 or earlier years.
Discounting across qualification type
Qualification discounting ensures that, where a pupil has taken two or more qualifications with an overlap in curriculum, the performance measures only give credit once to the school for teaching a single course of study (qualification discounting does not impact on the
individual results achieved by pupils). For the first time this year, discounting will be applied across qualification types. For example, where there is an overlap in curriculum, a GCSE can now discount against a BTEC and vice versa. This may reduce the total number of
qualifications a pupil is shown as achieving or entered for on the performance measures. Further information on discounting can be found in guidance available at:
RAISEonline: Discounting guidance.
Move to linear GCSE formats
In 2010 the Government set out its education policy aims in the White Paper, The Importance of Teaching. One of these was to reform GCSE qualifications and, in particular, course
structures so that examinations are taken at the end of the course, as opposed to a
modularised approach4. Ofqual consulted upon and implemented this reform5. For two-year
GCSE courses starting in September 2012 all examinations had to be sat at the end of the
3
Two of the national level results, presented in Figures 1 and 2, are estimated using a rule set which applies only Wolf reforms and not early entry changes – further information is provided in section 4.1.
4
course, in summer 2014. This affects the cohort of pupils that this SFR is based upon and may have had an impact on the grades they achieved.
Removal of the speaking and listening component from English examinations
Ofqual also reformed the constitution of GCSE English and GCSE English language results6.
From summer 2014, performance in speaking and listening no longer contributes to the overall grade achieved by a pupil but is separately reported. The GCSE grade is now calculated from the other component parts of the qualification.
Ofqual considered the impact, noting that overall results in these qualifications would fall because pupils generally do better in speaking and listening than in the rest of the
qualification. To mitigate for this, Ofqual have used a comparable outcomes approach to setting standards. This means that where the group of pupils is basically the same from one year to the next, their results should look broadly the same7. However, individual schools and
pupils may have been affected differently depending on their strengths and weaknesses in the skills being assessed.
4.
Detailed Results Analysis
These measures are based on the same rules used to produce the measures shown in the school performance tables.
As outlined in sections 2 and 3 there are a wide range of changes to the calculation of performance measures in 2013/14. These mean it is not possible to compare 2013/14 with previous years. In line with previous SFRs, this section provides a time series of results for the selected measures. This allows readers to understand the trends up to 2012/13 and the see the 2013/14 results following the break in the time series.
4.1
Comparison of policy impacts
Further to the additional data calculated on the 2013 methodology, the department has produced an estimated national 5 or more GCSEs or equivalent at grade A* to C (including English and mathematics) figure which includes the Wolf recommendation rules, but which counts a pupil’s best entry result instead of first entry. This has been done to further help users understand the impact of the major reforms on the 2013/14 data. The comparison figures are indicative and are intended only for use as an indication of the potential effect of reforms.
We will provide further information on the impact of these reforms in the revised SFR in January 2015. In addition to this, school level data will be made available by early March to help explain the effects of the early entry rules and the Wolf reforms on headline results.
6
Changes to GCSE English and English language (Ofqual)
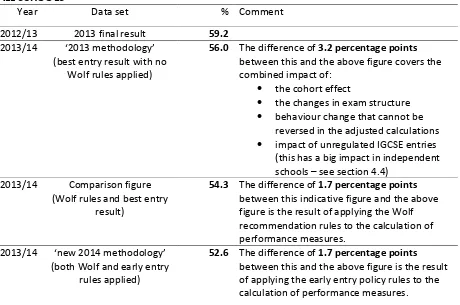
Figure 1: Pupils achieving 5+ A*-C grades (including English and mathematics) –
ALL SCHOOLS
Year Data set % Comment
2012/13 2013 final result 59.2
2013/14 ‘2013 methodology’ (best entry result with no
Wolf rules applied)
56.0 The difference of 3.2 percentage points
between this and the above figure covers the combined impact of:
the cohort effect
the changes in exam structure behaviour change that cannot be
reversed in the adjusted calculations impact of unregulated IGCSE entries
(this has a big impact in independent schools – see section 4.4)
2013/14 Comparison figure (Wolf rules and best entry
result)
54.3 The difference of 1.7 percentage points
[image:7.595.70.541.437.711.2]between this indicative figure and the above figure is the result of applying the Wolf recommendation rules to the calculation of performance measures.
2013/14 ‘new 2014 methodology’ (both Wolf and early entry
rules applied)
52.6 The difference of 1.7 percentage points
between this and the above figure is the result of applying the early entry policy rules to the calculation of performance measures.
Figure 2: Pupils achieving 5+ A*-C grades (including English and mathematics) –
ALL STATE-FUNDED SCHOOLS
Year Data set % Comment
2012/13 2013 final result 60.6
2013/14 ‘2013 methodology' (best entry result with no
Wolf rules applied)
59.6 The difference of 1.0 percentage points
between this and the above figure covers the combined impact of:
the cohort effect
the changes in exam structure behaviour change that cannot be
reversed in the adjusted calculations impact of unregulated IGCSE entries 2013/14 Comparison figure
(Wolf rules and best entry result)
57.7 The difference of 1.9 percentage points
between this indicative figure and the above figure is the result of applying the Wolf recommendation rules to the calculation of performance measures.
2013/14 ‘new 2014 methodology’ (both Wolf and early entry
rules applied)
55.9 The difference of 1.8 percentage points
4.2
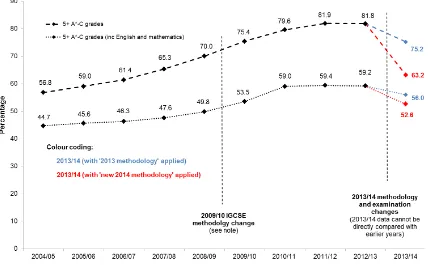
5+ A*-C grades results over time (Table 1a)
[image:8.595.79.508.150.415.2]Figure 3 shows the trend in GCSE achievement from 2004/05 to 2012/13 and the beginning of the new time series in 2013/14.
Figure 3: Time series of key GCSE and equivalent indicators (Table 1a):
England, 2004/05 – 2013/14 (all schools)
Figure 3 note: 2009/10 IGCSE methodology change: from 2009/10 unregulated IGCSEs were counted as GCSE equivalents. These unregulated versions were gradually replaced by new regulated Level 1/2 Certificates. The final unregulated IGCSEs counted for the last time in 2012/13. Further information on Level 1/2 Certificates can be found in the Qualification Abbreviations/Descriptions section on page 23.
4.3
State-funded school type breakdowns (Table 3a)
This SFR, like other statistics published by the department, shows some of the key measures broken down by type of establishment. The changes that have been implemented in 2013/14 have had an impact across all types of school and it means that it is not possible to make direct comparisons between 2013/14 and earlier years. Readers of the SFR should review sections 2 and 3 to understand the nature of these changes.
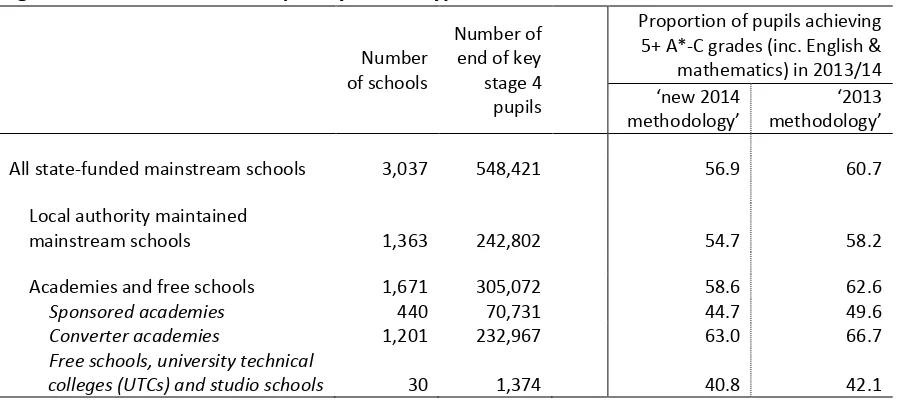
Figure 4: Attainment in 2013/14 by school type
of schools Number
Number of end of key stage 4 pupils
Proportion of pupils achieving 5+ A*-C grades (inc. English & mathematics) in 2013/14
‘new 2014
methodology’
‘2013 methodology’
All state-funded mainstream schools 3,037 548,421 56.9 60.7
Local authority maintained
mainstream schools 1,363 242,802 54.7 58.2
Academies and free schools 1,671 305,072 58.6 62.6
Sponsored academies 440 70,731 44.7 49.6
Converter academies 1,201 232,967 63.0 66.7
Free schools, university technical
colleges (UTCs) and studio schools 30 1,374 40.8 42.1
Even without the reforms that were introduced in 2013/14, care would need to be taken when comparing performance by school type across years. This is because the group of schools included in each category changes from one year to the next – for example local authority maintained schools changing to converter academies or new provision schools having results published for the first time. This is demonstrated in figure 5 which shows the number of schools included in attainment measures in each year.
Figure 5: Schools in 2012/13 and 2013/14 by school type
School type
Number of schools with results in 2012/13
Number schools with results in 2013/14
Local authority maintained
mainstream schools 1,602 1,363
Sponsored academies 360 440
Converter academies 1,045 1,201
Total 3,007 3,004
Source: 2013/14 figures are in Table 3a, 2012/13 figures available in ‘GCSE and equivalent results in England 2012 to 13 (revised) SFR’ (Table 3a). Not all school types are shown in this table.
This means that comparing the headline figures for any of these groups captures not only the change in performance and the reforms introduced in 2013/14, but also the change in
composition. For example, if the additional schools to a group all had attainment that was below the average for the group, the effect would be to lower the average for the group even if each individual school saw no change in its own results.
[image:9.595.87.505.409.552.2]In calculating these figures there are two key differences from other statistics in this provisional SFR:
Statistics are based on school level data from the 2013 performance tables and 2013/14 data sent to schools as part of the performance tables checking exercise. There are small differences between the pupils that are included in national level calculations and those included in school level calculations; and
Schools are only included in the calculation if they have a valid result in both years, thus excluding schools without results in 2012/13.
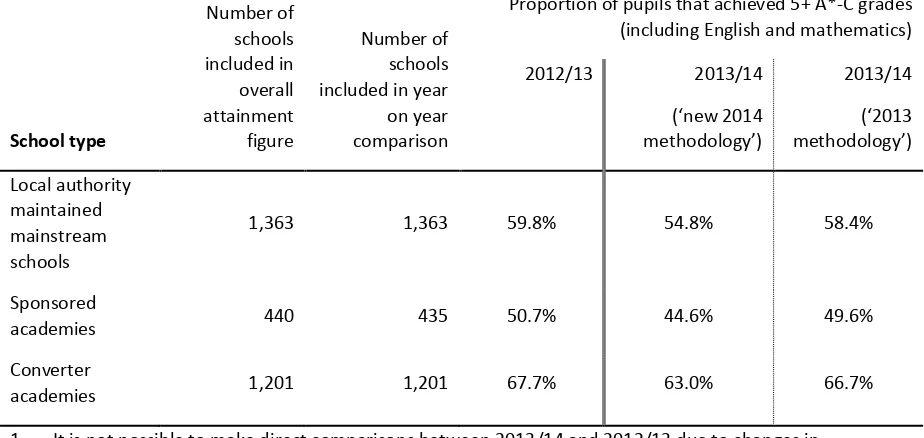
Figure 6 sets out the results for 2012/13 and 2013/14 by school type on this basis. Note that on this data, only sponsored academies are affected by the restriction of needing results in both years.
Figure 6: Schools in 2012/13 and 2013/14 by school type
[image:10.595.67.529.300.519.2]Number of schools included in overall attainment figure Number of schools included in year on year comparison
Proportion of pupils that achieved 5+ A*-C grades (including English and mathematics)
School type
2012/13 2013/14
(‘new 2014 methodology’) 2013/14 (‘2013 methodology’) Local authority maintained mainstream schools
1,363 1,363 59.8% 54.8% 58.4%
Sponsored
academies 440 435 50.7% 44.6% 49.6%
Converter
academies 1,201 1,201 67.7% 63.0% 66.7%
1. It is not possible to make direct comparisons between 2013/14 and 2012/13 due to changes in methodology, examinations and behaviour.
2. Some of the figures in this table differ from those in figure 5. This is due to differences in the underlying datasets. See the preceding paragraphs for more information on this.
3. Analysis is restricted to those schools with results in 2012/13 and 2013/14. Not all school types are shown in this table.
4. Figures for 2013/14 are based on provisional data. Figures for all other years are based on final data. 5. Includes mainstream sponsored academies and mainstream converter academies which opened on or
before 12 September 2013 only.
In calculating a time series there are again two key differences from other statistics in this SFR:
Statistics are based on school level data from historic data in performance tables and 2013/14 data sent to schools as part of the performance tables checking exercise. There are small differences between the pupils that are included in national level calculations and those included in school level calculations; and
Schools are only included in these statistics if they have a valid result in every year to which the time series refers.
Figure 7: Time series of attainment in academies by length of time open
Proportion of pupils that achieved 5+ A*-C grades (including English and mathematics)
Number of
schools 2009/10 2010/11 2011/12 2012/13
2013/14 (new 2014 methodology)
2013/14 (2013 methodology)
Sponsored academies
Open 1 year 77 46.9 40.9 46.8
Open 2 years 59 46.2 48.6 41.2 46.3
Open 3 years 41 43.5 46.4 48.8 42.7 46.8
Open 4 years 62 36.8 42.6 46.6 49.1 42.2 46.8
Open 5 years 183 43.3 48.5 51.4 53.5 47.6 52.8
Converter academies
Open 1 year 158 63.3 56.5 60.3
Open 2 years 365 63.4 65.3 60.7 64.3
Open 3 years 653 68.5 68.3 69.9 65.5 69.3
Open 4 years 25 73.1 75.8 75.3 73.6 71.0 74.2
Local authority maintained
mainstream 1,357 54.3 57.3 57.9 59.8 54.8 58.4
1. It is not possible to make direct comparisons between 2013/14 and earlier years due to changes in methodology, examinations and behaviour.
2. Analysis restricted to those schools with results in every year of time series. Shaded cells refer to results of predecessor schools
3. Figures for 2013/14 are based on provisional data. Figures for all other years are based on final data. 4. Includes mainstream sponsored academies and mainstream converter academies which opened on or
4.4 Independent schools (Table 3a)
The proportion of pupils achieving 5+ A*-C grades (including English and mathematics) has changed significantly between 2012/13 and 2013/14 due primarily to changes related to IGCSEs. The result was 54.4 per cent in 2012/13 and 28.0 per cent in 2013/14 (using the ‘new 2014 methodology’). The result calculated using the ‘2013 methodology’ proxy on 2013/14 data is 28.4 per cent. The small change between applying the ‘new 2014
methodology’ and ‘2013 methodology’ indicates that this dramatic change between years is not primarily due to the introduction of Wolf and early entry reforms.
This large change in attainment of 5+ A*-C grades (including English and mathematics) is predominantly due to independent school use of unregulated IGCSEs. In 2010, new regulated versions of IGCSEs were approved. This allowed them to be taken in state schools and included in the performance measures for the first time. At the same time, any results achieved by pupils in the legacy unregulated IGCSEs in these subjects were also valid for inclusion in performance indicators.
The period for inclusion of the legacy qualifications in measures was set for two years, commencing from the point at which the replacement regulated certificates became available for teaching, with the expectation being that pupils should be moved to the regulated certificates after this period.
In independent schools, pupils have continued to be entered for unregulated qualifications that do not count in performance measures and they have not been moved across to the regulated certificate versions. The effect of this has been enhanced in 2013/14 by the final group of unregulated IGCSEs reaching the end of their grace period and not being included in results. This means that the results for 2013/14 cannot be directly compared to earlier years.
4.5
Floor standards
Schools will be deemed to be underperforming by the department if their performance on the 2013/14 data is below the ‘floor standard’. A school is below this minimum expected level if:
less than 40
per cent
of pupils at the end of key stage 4 achieve 5 or more GCSEs or equivalent at grade A* to C, including English and mathematics GCSEsand
the proportion of pupils making expected progress in English and mathematics is below the median percentage for all state-funded mainstream schools
4.6
English Baccalaureate entries and achievement
These measures are based on the same rules used to produce the measures shown in school performance tables.
The EBacc was first introduced into the performance tables in 2009/10. It aims to recognise pupils’ achievements across a core of selected academic subjects; English, mathematics, at least two sciences, a language and humanities (history or geography).
Entries for English Baccalaureate (EBacc) subjects are less affected by methodological and examination changes than other measures in this SFR. As such comparisons between 2012/13 and 2013/14 EBacc entries are more suitable here than for other measures.
An increase in entries into the English Baccalaureate (Table 3)
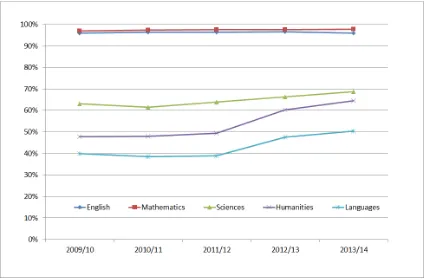
It is compulsory for pupils to study English, mathematics and one science. All of the other subjects within the EBacc (more than one science, languages and humanities) have shown an increase in entries since 2009/10.
Looking at the data for state-funded schools, the greatest percentage increase in pupil entries was in humanities where a rise of 4.4 percentage points from 60.2 per cent to 64.6 per cent has been seen. Languages increased by 2.9 percentage points from 47.6 per cent to 50.5 per cent.
[image:13.595.72.498.463.743.2]The figures for all schools are slightly lower than these. This is related to large numbers of entries on unregulated IGCSEs in independent schools. These unregulated IGCSEs do not count towards the EBacc. This has had greater impact in 2013/14 than in previous years.
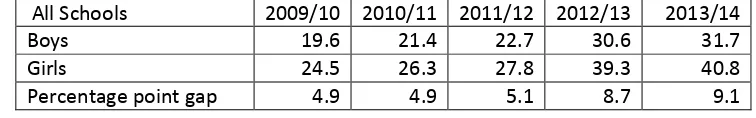
The gap between the percentage of girls and boys entering all of the EBacc subjects has widened as shown in figure 9.
Figure 9: EBacc entries by gender
All Schools 2009/10 2010/11 2011/12 2012/13 2013/14
Boys 19.6 21.4 22.7 30.6 31.7
Girls 24.5 26.3 27.8 39.3 40.8
Percentage point gap 4.9 4.9 5.1 8.7 9.1
Proportion of pupils achieving the EBacc (Table 1b)
Increase from
2009/10 to 2012/13
of 7.4 percentage
points
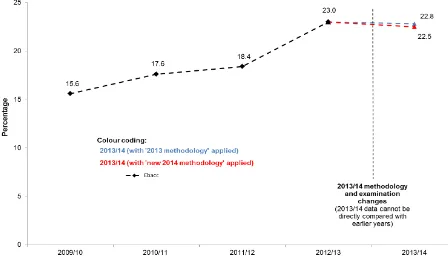
The proportion of pupils achieving the EBacc in all schools was 15.6 per cent in 2009/10 and 23.0 per cent in 2012/13.
The 2013/14 result
for “all schools”
The result in 2013/14 using the ‘new 2014 methodology’ is 22.5 per cent. This cannot be directly compared with the 2012/13 figure due to the changes in methodology, examinations and behaviour as set out in sections 2 and 3.
If we apply the 2013 methodology to the 2013/14 data the result is 22.8 per cent. The examination and behaviour changes in 2013/14 still affect this figure meaning it is not produced on a like-for-like basis with 2012/13.
The 2013/14 result
for “state
-funded
schools”
The proportion of pupils achieving the EBacc in state-funded schools was 22.8 per cent in 2012/13 and 23.9 per cent in 2013/14 (on the ‘2014 methodology’). Again, the two figures cannot be directly compared due to the changes in 2013/14.
Figure 10: Time series for the proportion of pupils at the end of key stage 4 achieving the
EBacc
(Table 1b): England, 2009/10 – 2013/14 (all schools)
5.
Entry patterns to English Baccalaureate subjects (Table 20)
The following table outlines the changes to the number of entries in EBacc subjects.There are fewer
pupils in this year’s
cohort
The number of pupils in all schools completing key stage 4 was 632,397 in 2012/13 and 620,166 in 2013/14. This is a reduction of 1.9 per cent. (table 1b)
Exam entries fell by more than pupil numbers
The overall number of entries into examinations included in the performance tables for pupils finishing KS4 fell from 7,634,929 in 2012/13 to 6,010,827 in 2013/14, a fall of 21.3 per cent. The behaviour changes linked to early entry policy and the restrictions on qualifications counted in performance measures, including unregulated IGCSEs, will have been a factor in this reduction.
The largest drops in exam entries are in non-EBacc subjects
The number of entries in examinations for non-EBacc qualifications fell from 3,403,660 in 2012/13 to 1,939,536 in 2013/14. This is a reduction of 43.0 per cent. This could be linked to the impact of the Wolf reforms and wider changes to performance measures.
Early entries for EBacc qualifications increased
The percentage of EBacc qualifications taken in a pupil’s
English
Entries for qualifications in the English pillar of the EBacc have increased by 55,578 from 2012/13 to 2013/14, an increase of around 5 per cent. There was a shift from combined English (a drop of 42,586) towards the separate language and literature qualifications (note: combined English covers both a literature and language element within a single course of study).
Mathematics
The overall number of entries to mathematics qualifications in 2013/14 has fallen by 238,213 – a decrease of over 21 per cent. As outlined in the previous section this does not mean that fewer pupils are taking mathematics, just that the total number of exam entries per pupil is lower.
This reduction was due to a fall in numbers in the last year of KS4. This may be linked to behaviour changes relating to early and multiple entry patterns, where pupils who had already taken mathematics early did not resit.
Science
The overall number of EBacc science entries has remained very similar from 2012/13 to 2013/14. There has been a notable shift towards core science and additional science
qualifications8. These can be taken alongside each other and both cover biology, chemistry and
physics.
60,169 more entries into core science
24,778 more entries into additional science
11,523 more entries to computer science (first year this subject counts in the science pillar of the EBacc).
4,746 fewer entries into double science (this could be linked to the cap on qualifications counting as larger than 1 GCSE).
27,186 fewer entries into biology 28,639 fewer entries into chemistry 29,133 fewer entries into physics
Humanities
The overall number of entries in the humanities pillar increased slightly between 2012/13 and 2013/14
4,277 more entries in history – an increase of 1.8 per cent
7,486 more entries in geography – an increase of 3.6 per cent
8
Languages
The languages with the largest proportion of entries in 2013/14 were:
French (166,110 entries in 2013/14, down by 163 from 2012/13)
Spanish (89,949 entries in 2013/14, up by 3,553 from 2012/13)
German (60,372 entries in 2013/14, down by 1,812 from 2012/13)6.
Local authority achievement (Tables 15-19)
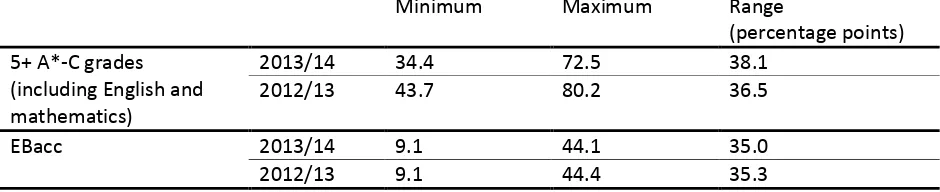
There is considerable variation between local authorities in attainment levels. Figure 11 shows the minimum and maximum local authority percentages achieving 5+ A* - C grades
[image:17.595.67.537.355.451.2](including English and mathematics) and achievement of the EBacc at key stage 4 (excluding the City of London and Isles of Scilly which only have two and one schools, respectively).
Figure 11: Range in local authority achievement, minimum and maximum percentages of
pupils achieving 5+ A*-C grades (including English and mathematics) and the EBacc:
England, (state-funded schools only)
Minimum Maximum Range
(percentage points) 5+ A*-C grades
(including English and mathematics)
2013/14 34.4 72.5 38.1
2012/13 43.7 80.2 36.5
EBacc 2013/14 9.1 44.1 35.0
2012/13 9.1 44.4 35.3
7.
Accompanying tables
The following tables are available in excel format on the department’s statistics website alongside this SFR: Statistics: GCSEs (Key Stage 4).
National tables
1a Time series of GCSE and equivalent entries and achievements, 1995/96 to 2013/14 1b Time series of the English Baccalaureate
entries and achievements, 2009/10 to 2013/14
1c Expected progress between key stage 2 and key stage 4 by gender, 2007/08 to 2013/14 1d Expected progress by key stage 2
attainment and key stage 4 outcome
2 Level 1 and 2 attainment (including English and mathematics), 2005/06 to 2013/14 3a GCSE and equivalent entries and
achievements by school type and gender 3b GCSE and equivalent entries and
achievements by admission basis and gender
3c GCSE and equivalent entries and achievements in sponsored academies by length of time opened
3d GCSE and equivalent entries and achievements in converter academies by length of time opened
4a Average point scores and achievement of GCSE English and mathematics by grade, school type and gender
4b Average point scores and achievement of GCSE English and mathematics by grade, admission basis and gender
5a Level 2 achievement by qualification family, school type and gender
5b Level 2 achievement by qualification family, admission basis and gender
6a Attainment by prior attainment band, school type and gender
6b Attainment by prior attainment band, admission basis and gender
Subject tables
7 GCSE attempts and achievements by subject in schools (number)
8 GCSE attempts and achievements by subject (percentage of pupils attempting subject) 9 GCSE attempts and achievements by subject
in schools (percentage of all pupils) 10a GCSE attempts by subject by school type 10b GCSE attempts by subject and admissions
basis
11 GCSE Full Course results by subject and grade
12 Cambridge International Certificate and Edexcel Level1/2 Certificate results by subject and grade
13 Results of GCSEs in applied subjects by subject and grade
14 Other qualification results by qualification type
Local authority tables
15 GCSE and equivalent results by gender for each local authority and region
16 GCSE and equivalent results for each local authority and region, 2005/06 to 2013/14 17 The English Baccalaureate by local authority
and region
18 Expected progress in English and in mathematics between key stage 2 and key stage 4 in state-funded mainstream schools, by local authority and region, 2008/09 to 2013/14
19 Expected progress in English and in mathematics between key stage 2 and key stage 4 in state-funded schools, by local authority and region, 2008/09 to 2013/14
Multiple entries table
20 Non-discounted examination entries in EBacc and non-EBacc subjects in 2013 and 2014
21 Time series of GCSE results by subject, grade and gender, 2007/08 to 2013/14
When reviewing the tables, please note the following:
We preserve confidentiality
The Code of Practice for Official Statistics requires us to take reasonable steps to ensure that our published or disseminated statistics protect confidentiality.
so we suppress some figures,
Values of 1 or 2, or a percentage based on 1 or 2 pupils who achieved; or 0, 1 or 2 pupils who did not achieve a particular level are suppressed. Some additional figures have been suppressed to prevent the possibility of a suppressed figure being revealed.
This suppression is consistent with our Statistical policy statement on confidentiality.
adopt symbols to help identify this
Symbols are used in the tables as follows:
0 zero
. not available
x publication of that figure would be disclosive
and round numbers Percentages in this SFR are given to one decimal place.
This is provisional data 2013/14 figures in this publication are provisional. We will publish revised figures in the revised ‘GCSE and equivalent results in England 2013/14’ SFR in January 2015.
Figures from 2012/13 have been updated to reflect the changes made to the data by the end of March 2014.
Any unplanned revisions will be made in accordance with our Statistical policy statement on revisions.
coverage of the data The statistics in this first release cover the data collated for the 2014 secondary school performance tables. From 2005 the performance tables reported results based on pupils at the end of key stage 4. This publication includes tables only for pupils at the end of key stage 4.
The coverage of the local authority (LA) and regional statistics is state-funded schools only in England. This includes city technology colleges and academies but excludes hospital schools, pupil referral units and alternative provision.
8. Further information is available
School level figures School level data will be published in the secondary school performance tables in January 2015.
Characteristics breakdowns
attainment by pupil characteristics.
Previously published figures
SFR01/2014: GCSE and equivalent results in England, 2012 to 2013 (revised)
Secondary School Performance Tables 2013
Attainment for other key stages
SFR43/2013: Early years foundation stage profile results: 2012 to 2013
SFR47/2013: EYFSP attainment by pupil characteristics: 2013
SFR37/2013: Phonics screening check and national curriculum assessments at key stage 1 in England: 2013
SFR 30/2014: National curriculum assessments at key stage 2 in England, 2014 (Provisional)
SFR02/2014 A level and other level 3 results: academic year 2012 to 2013 (revised)
SFR42/2014 A level and other level 3 results: academic year 2013 to 2014 (provisional) (this SFR will be published alongside the GCSE and equivalent SFR on the 23rd October 2014 and will be available
here: Attainment at 19 years statistics).
Pupil numbers SFR15/2014: Schools, Pupils and their Characteristics: January 2014
Attainment in Wales, Scotland and Northern Ireland
Information on educational attainment for secondary schools in Wales is available from the Welsh Government website.
Information on educational attainment for secondary schools in Scotland is available from the Scottish Government website.
Information on educational attainment for secondary schools in Northern Ireland is available from the Department for Education Northern Ireland (DENI) website.
Methodology document to support SFR41/2014
9. National Statistics
The United Kingdom Statistics Authority has designated these statistics as National Statistics, in accordance with the Statistics and Registration Service Act 2007 and signifying compliance with the Code of Practice for Official Statistics.
Designation can be broadly interpreted to mean that the statistics:
meet identified user needs;
are well explained and readily accessible;
are produced according to sound methods, and
are managed impartially and objectively in the public interest.
Once statistics have been designated as National Statistics it is a statutory requirement that the Code of Practice shall continue to be observed.
The department has a set of statistical policies in line with the Code of Practice for Official Statistics.
10. Technical information
Academic Age
Academic age used for reporting examinations and awards is the age at the start of the academic year. For the majority of pupils at the end of key stage 4, this will be age 15. From 2005, the secondary school performance tables reported examination results for pupils at the end of key stage 4, rather than those aged 15. This shift to stage-based reporting removes any barriers to more flexible rates of learning.
Level
In order to incorporate other regulated qualifications into measures, such as the percentage of pupils achieving 5 or more GCSEs or equivalent at grade A* to C, the contribution that a qualification makes towards the end of each level is used. The levels can be defined as follows:
Level 1 – The pupil has achieved 5 or more GCSEs or equivalent at grade A* to G.
Level 2 – The pupil has achieved 5 or more GCSEs or equivalent at grade A* to C.
Qualification Abbreviations/Descriptions
The following qualifications are reported within this SFR and the abbreviations used throughout stand for the following:
GCE/Applied GCE – General Certificate of Education/Applied General Certificate of Education (Advanced Supplementary (AS) level qualifications only).
GCSE – General Certificate of Secondary Education.
Level 1/2 Certificates – These are a combination of established IGCSEs and newly developed IGCSE-style qualifications. Established IGCSEs are accredited versions of qualifications which were being offered as ‘IGCSE’ and were being taken in independent and/or international schools before June 2010 when Ministers announced that they would allow the use of accredited IGCSE qualifications in maintained schools. More information on established IGCSEs is available at: Established IGCSE qualifications.
Newly developed level 1/level 2 certificates included in performance tables have been assessed and meet the criteria for inclusion within the list of other ‘Qualifications for 14-16 Year Olds and Performance Tables’, also known as the ‘Wolf list’. Since the introduction of the Wolf list, only a maximum of two qualifications per pupil that are not GCSEs, established IGCSEs or AS levels will count towards the headline measures in 2014 – these newly developed level 1/level 2 certificates will count towards this two qualification maximum. In May 2013 a limited number of the newly developed level 1/level 2 qualifications were also included in the EBacc list (from 2014). They remain subject to the two qualification maximum as described above.
VRQ – Vocationally Related Qualifications.
BTEC – A qualification originally developed by the Business and Technology Education Council.
English and mathematics skills at level 2
A pupil will fulfil this by achieving 5 or more GCSEs or equivalent at grade A* to C (Level 2) in both English and mathematics.
English and mathematics skills at level 1
English Baccalaureate (EBacc)
This was introduced into the performance tables in 2010 with the aim of recognising pupils’ achievements across a core of selected academic subjects. The EBacc covers achievement in GCSE (or regulated IGCSE) English, mathematics, sciences, a language (including Latin, classical Greek or ancient Hebrew) and a humanities subject (history or geography). Further information and the exact qualifications included in the measures are available here: Technical Guides and Documents
The 2010 performance tables also, for the first time, included the percentage of pupils achieving good GCSE grades (A* to C) in English and maths. This covers the same qualifications that qualify for the English and maths components of the 5 or more GCSEs at A* to C or equivalent including English and mathematics GCSEs measure. Unlike the English subject area for the EBacc, this measure includes achievements in the GCSE English studies qualification.
Qualifications included in GCSE and equivalent results
List of qualifications
The qualifications included in the 2014 key stage 4 performance measures are contained within the following document: inclusion of qualifications in 2014.
Further information on qualification accreditation, contributions to pupil level and point scores of qualifications can be found through Ofqual’s Register of Regulated Qualifications.
Independent schools – pupils at the end of key stage 4
Results for pupils in independent schools are subject to a degree of uncertainty because the department does not have pupil-level census records to tell us exactly who is registered at the school and to which year group they belong. Data from awarding organisations are used to match entrants to independent schools but some of these entrants might not be enrolled with the school or might not be at the end of key stage 4.
Instead, the pattern of KS4 exams taken and the years in which key stage 2 and key stage 3 tests were taken (if known) are used to determine which year group is most likely for the pupil. If a pupil does not enter any qualifications they do not appear in the data.
This SFR attempts to report on all pupils who reach the end of key stage 4 and not just those who are entered for exams, so the figures for the total number of pupils in independent schools are derived from the aggregate of school-level census returns across all independent schools.
From 2011, any independent school which submitted a school census return for year 11 pupils having fewer pupils than identified as being at the end of key stage 4 in exam data has had their number of pupils adjusted to the higher number. These results have been published in this SFR. As it is possible for a pupil to achieve no qualifications, where a school has fewer pupils identified as being at the end of key stage 4 in the exams data than in the census, then the school census return is used to identify the number of pupils at the end of key stage 4. For a small number of schools, the school census appears to be over inflating the number of pupils actually at the end of key stage 4.
Academies
For the purposes of this SFR, the date of 12 September 2013 has been used to determine the status of a school. Any schools which converted to an academy before this date have been published as an academy and those that have converted on or after this date have been treated as their predecessor school type. This policy has also been adopted in the performance tables and in other school level releases.
Independent schools converting to free schools
Due to the expansion of the Academies Act in 2010, there have been a small number of independent schools that have chosen to become free schools.
11. Got a query? Like to give feedback?
If from the media Press Office News Desk, Department for Education, Sanctuary Buildings, Great Smith Street, London SW1P 3BT. 020 7783 8300
If non-media David Bartholomew, Education Data Division, Department for Education, 2 St Paul’s Place, 125 Norfolk Street, Sheffield S1 2FJ.
© Crown copyright 2014
You may re-use this information (excluding logos) free of charge in any format or medium, under the terms of the Open Government Licence. To view this licence, visit Open Government Licence or e-mail: psi@nationalarchives.gsi.gov.uk.
Where we have identified any third party copyright information you will need to obtain permission from the copyright holders concerned.
Any enquiries regarding this publication should be sent to us at David Bartholomew, Education Data Division, Department for Education, 2 St Paul’s Place, 125 Norfolk Street, Sheffield S1 2FJ.