S O F T W A R E
Open Access
CompGO: an R package for comparing and
visualizing Gene Ontology enrichment
differences between DNA binding experiments
Ashley J. Waardenberg
1,2*, Samuel D. Bassett
1, Romaric Bouveret
1,3and Richard P. Harvey
1,3,4,5Abstract
Background:Gene ontology (GO) enrichment is commonly used for inferring biological meaning from systems biology experiments. However, determining differential GO and pathway enrichment between DNA-binding experiments or using the GO structure to classify experiments has received little attention.
Results:Herein, we present a bioinformatics tool, CompGO, for identifying Differentially Enriched Gene Ontologies, called DiEGOs, and pathways, through the use of a z-score derivation of log odds ratios, and visualizing these differences at GO and pathway level. Through public experimental data focused on the cardiac transcription factor NKX2-5, we illustrate the problems associated with comparing GO enrichments between experiments using a simple overlap approach.
Conclusions:We have developed an R/Bioconductor package, CompGO, which implements a new statistic normally used in epidemiological studies for performing comparative GO analyses and visualizing comparisons from .BED data containing genomic coordinates as well as gene lists as inputs. We justify the statistic through inclusion of experimental data and compare to the commonly used overlap method. CompGO is freely available as a R/Bioconductor package enabling easy integration into existing pipelines and is available at: http://www.bioconductor.org/packages/release/bioc/ html/CompGO.html packages/release/bioc/html/CompGO.html
Background
Gaining biological insight from high-throughput data under-pins systems biology. However, determining biological “func-tion” or indeed “relevance” from lists of genes or DNA regions (loci) remains problematic. Ashburner et al. proposed a structured Gene Ontology (GO) approach for grouping genes into conceptual“ontologies”based on their annotated or predicted biological functions [1]. GOs are organized into a hierarchical network where broad functionality sits at the top (e.g. cell) and fine functionality at the bottom (e.g. cal-cium ion binding). Individual genes can have multiple GOs. The accumulation of gene annotations and subsequent classification of thousands of ontologies has seen the devel-opment of a number of tools using a range of statistical approaches to identify “semantic” patterns, or GO enrich-ment, within a given list of genes [2]. GO enrichment is
typically determined using a hypergeometric test (or modi-fied version) or similar over-representation test based on gene sets alone or, for example, signatures derived from the correlation of gene expression profiles [3–5].
However, few methods have been developed to determine how similar or different experiments are using a GO ap-proach; most are focused on different visualization methods and are not adaptable to existing pipelines, requiring users to reformat and manually input data into third party web ser-vices. For instance, WebGestalt [6] and GOEAST [7] are webservers that visualize multiple gene list inputs by overlay-ing their individual statistics onto a GO directed acyclic graph. Enrichment maps visualize GO enrichment from multiple gene lists as a network; edges derived from the Jaccard coefficient (JC) of GO gene set overlap [8]. However, enrichment maps are difficult to resolve when more than two experiments are compared and do not indicate overall differences between experiments. Comparative GO [9], a web based GO tool, via the Kolmogorov-Smirnov statistic, compares observed GOs to an expected GO distribution, * Correspondence:[email protected]
1Victor Chang Cardiac Research Institute, Darlinghurst, NSW 2010, Australia 2
Present Address: Children’s Medical Research Institute, Westmead, NSW 2145, Australia
Full list of author information is available at the end of the article
however is limited to bacterial gene lists and visualization of pairwise comparisons.
Motivated by our interest in DNA binding experiments (e.g. ChIP-seq or DamID) and their similarities/differ-ences, we developed a tool that would enable rapid com-parison of multiple experiments unconstrained by input type (gene list or loci) or species, and taking advantage of existing unsupervised clustering and dimensionality re-duction methods (e.g. hierarchical clustering and principle component analysis), implemented in R for classification of experiments based on GO. We present an open-source implementation of a comparative GO approach, CompGO, which is readily adaptable to existing analysis pipelines for performing these functions and implement a log odds ratio [10, 11] normally applied to epidemiological studies for comparing GO enrichment directly. We justify the use of this statistic for direct comparisons by assessing experimen-tal data recently published [12].
Implementation
GO enrichment
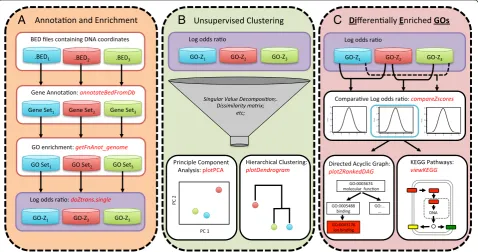
We developed an R package, CompGO, to assess similar-ities and differences between experiments using a log odds ratio scoring (z-score) [10, 11] of GO enrichment (Eqs. 1– 4); the pipeline is outlined in Fig. 1. CompGO is compliant
to R/Bioconductor [13] standards (available in Bioconduc-tor version 2.14 onwards) and therefore takes advantage of prebuilt statistical and visualization functions already in-cluded in R [14]. CompGO enables users to input data of either annotated gene symbols/identifiers or BED file for-mat. CompGO utilizes existing packages in Bioconductor, rtracklayer, to annotate loci using transcript coordinates de-rived from UCSC genome databases [15], RDAVIDWeb-Service [16] to interrogate the DAVID GO database and KEGG.db to visualize enrichment of annotated pathways [17]. We use DAVID (The Database for Annotation, Visualization and Integrated Discovery) [4] as a GO refer-ence dataset, but the principles and method could be ap-plied to any GO database.
Differential GO enrichment
GO count data was derived from the 2x2 contingency table for each GO term returned by RDAVIDWebService. In addition to the statistics returned by DAVID, we implement a log odds-ratio,δ, [10, 11] scoring for determination of GO enrichment (Eq. 1). Extension to a comparative log odds-ratio (Eq. 3) enables differential GO enrichment for each GO term to be calculated by direct comparison of 2x2 contin-gency tables derived from different experiments, also enab-ling comparison of experiments with different background
-4 -2 0 2 4
0.0
0.1
0.2
0.3
0.4
Density
-4 -2 0 2 4
0.0
0.1
0.2
0.3
0.4
Density
-4 -2 0 2 4
0.0
0.1
0.2
0.3
0.4
Density
A
B
C
[image:2.595.59.538.403.655.2]distributions or coverage. Here ziis the z-score for the i-th
GO term:
zi¼ SElogð Þδδi i
ð Þ ð1Þ
given a Standard Error, SE (δi), for each term, i, where
n1to n4are the four components (observed counts, total
genes, background counts, background genes tested) of the i-th 2x2 contingency table.
SEð Þ ¼δi
ffiffiffiffiffiffiffiffiffiffiffiffiffiffiffiffiffiffiffiffiffiffiffiffiffiffiffiffiffiffiffiffiffiffiffiffi 1
n1þ
1 n2þ
1 n3þ
1 n4
r
ð2Þ
p-values are not derived from log odds ratios, but 95 % confidence intervals could be assigned to enrichment scores as zi± 1.96SE (δi). The greater the absolute zi, the greater
the odds a term was enriched than by chance alone. When computing differential enrichment between two sets of GO terms, we employ a comparative log odds ra-tio, zk, derived from the difference of two non-zero log
odds ratios, log (δi) and log (δj), for the k-th term:
zk¼ logð Þδi −log δj
SE δij ð3Þ
given the total Standard Error, SE (δik), for each term,
k, where SEiand SEjare derived as per Eq. 2:
SE δij ¼
ffiffiffiffiffiffiffiffiffiffiffiffiffiffiffiffiffiffiffiffiffi SE2
i þSE2j
q
ð4Þ
Scoring of Differentially Enriched Gene Ontologies (DiE-GOs) can then be inferred from their z-scores. The greater the absolute zk, the greater the odds a term was differentially
enriched than by chance alone. p-value’s can be inferred using R assuming normal approximations and multiple methods are available for correcting for multiple hypotheses.
Overlap of genes between GOs
To assess gene overlap within a GO category (enriched in two gene lists), we utilize the Jaccard coefficient (JC) [18] of any two gene sets (A, B) from two comparisons contributing to term k. We include this statistic as similar levels of GO enrichment can be achieved be-tween experiments even though the genes contribut-ing to a GO can be distinct. The JC is the ratio of the intersection and the union of these sets:
JC¼AA∩∩BB ð5Þ
Example of CompGO Code
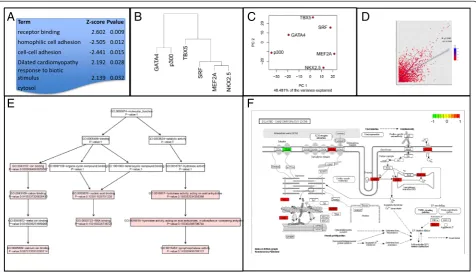
cardiomyocytes: NKX2-5, MEF2A, GATA4, p300, SRF and TBX5 [19]. This example data is included with the CompGO package and example code for running core CompGO functions is provided below (Fig. 2a-f ) . For more example code and updated functionality, see the CompGO Reference Manual and accompanying Vignette on the Bioconductor website.
Results and discussion
To determine the utility of the methods proposed in CompGO we downloaded DNA targeted regions (peaks)
for a number of wild-type (WT) and mutated cardiac TFs identified by Bouveret et al. [12] using the DamID method, and compare the outcomes using a simple over-lap approach. Bouveret et al. surveyed DNA binding re-gions for the WT NKX2-5 cardiac transcription factor twice (independent experiments with 3–4 replicates each performed 2 years apart; data sets hereafter named NKX2-51 and NKX2-52) and in addition surveyed three
NKX2-5 mutants - NKX2-5Y191C is a congenital heart disease-causing mutation [20, 21], while NKX2-5ΔHD and NKX2-5YRDY-Aare synthetic mutations with a dis-rupted homeodomain (involved in both DNA-binding and cofactor interactions) and Tyrosine-Rich Domain (YRD; cofactor interactions), respectively. DNA binding regions of the muscle-enriched TF serum response fac-tor (SRF) and the ubiquitously-expressed ETS-domain TFs ELK1 and ELK4, were also considered [12] .
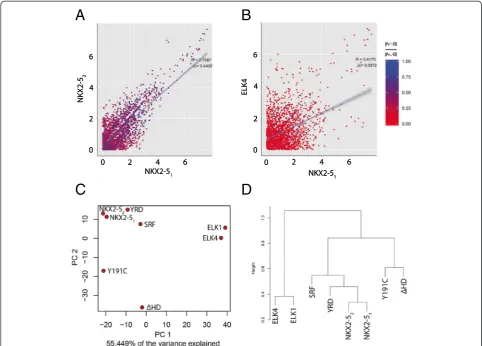
All results reported were using CompGO default settings. Peak coordinates were annotated and GO term counts obtained as per the process outlined in Fig. 1a. Direct comparison of z-score-transformed GO enrich-ments (Eq. 1) illustrated that repeated NKX2-5 expe-riments were highly correlated (R= 0.76) and had a high average JC (0.44) (Fig. 3a) of individual GO terms in contrast to ELK4 (R= 0.42; JC = 0.10; Fig. 3b), ELK1
A
E
F
B
C
D
[image:4.595.60.537.413.685.2](R= 0.39; JC = 0.10), SRF (R= 0.62; JC = 0.18) or NKX2-5 mutations (R= 0.47-0.67; JC = 0.15-0.40) (graphical rep-resentations not shown). Unsupervised principle compo-nent analysis and hierarchical clustering placed NKX2-51 and NKX2-52 next to each other and close to SRF
and the NKX2-5YRDY-A mutation, while ELK1 and
ELK4, and the other NKX2-5 mutations, were located at greater distance (Fig. 3c and d). The related ELK TFs were also placed next to each other. We then computed DiEGOs as per Eq. 3 for each comparison. Using a p-value threshold of 0.05 we did not identify any DiEGOs for the two repeated NKX2-5 experiments, but identified 43/44, 31/37, 18/21, 1/11, 15/10 and 0/0 DiEGOs when comparing NKX2-51/NKX2-52 to ELK4, ELK1,
NKX2-5ΔHD, SRF, NKX2-5Y191C and NKX2-5YRDY-A,
respectively.
These results suggest that ELK TFs regulate distinct although overlapping sets of biological processes com-pared to NKX2-5. Furthermore, while SRF and the mu-tation NKX2-5YRDY-A largely target genes with similar
GO terms as WT NKX2-5, the mutations NKX2-5ΔHD and NKX2-5Y191C, predicted to be the more severe mutations among those studied here, targeted sets of genes representing distinct biological processes [12]. Notably the average JC, a metric representing overall concordance of genes belonging to the same GO term, varied, indicating that distinct sets of target genes could belong to the same GO term. Of the DiEGOs from the NKX2-51 versus ELK4 comparison, those unique to
ELK4 included metabolic and generic GO terms such as GO:0006396 ~ RNA processing (z-scores: 0.13 vs. 5.41; p-value: 0.001) and GO:0034470 ~ ncRNA processing (z-scores: -0.09 vs. 3.60; p-value: 0.028), whereas those for NKX2-51 included muscle related terms such as
GO:0043292 ~ contractile fiber (z-scores: 6.50 vs. 1.70; p-value: 0.035) and GO:0048514 ~ blood vessel morpho-genesis (z-scores: 4.00 vs. 0.26; p-value: 0.043). This is consistent with the known roles for NKX2-5 in muscle and vasculature development and the ubiquitous expres-sion of ELK TFs [22].
A
B
C
D
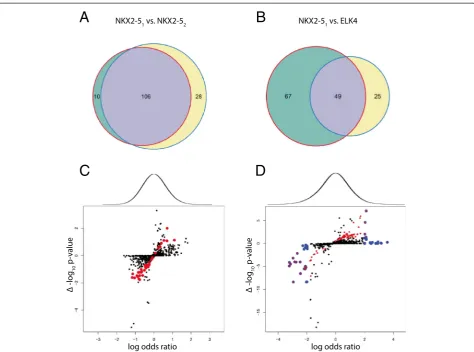
Fig. 3Application of CompGO to experimental data. Direct comparison of z-scores with Jaccard Coefficient overlaid onto terms foraNKX2-51vs.
[image:5.595.56.539.89.435.2]We then compared results of 1) NKX2-51 versus
NKX2-52; and 2) NKX2-51 versus ELK4 using a simple
overlap method of thresholding each GO term (p< 0.05) using the statistic returned by DAVID (Benjamini & Hoschberg adjusted). This reported 38 GO terms as be-ing specifically enriched in either group for NKX2-51
versus NKX2-52 (Fig. 4a) and 92 for NKX2-51 versus
ELK4 (Fig. 4b). However, upon closer inspection many of the differences could be attributed to“hard threshold-ing”. That is, many GO terms in the comparison experi-ment had a significance value just beyond the 0.05 threshold imposed, falsely making it appear to be differ-entially enriched due to the selection of the significance threshold. In addition, many of the GO terms only chan-ged their group membership by a few genes. For ex-ample, “GO:0003824 ~ catalytic activity” would have been reported as differentially enriched using this
overlap approach, having a p-value of 0.066 in one ex-periment and 0.011 in the other, whilst only changing counts by less than 1 %, from 420 to 417. However, this effect was more pronounced in the lower count range. For example,“GO:0044448 ~ cell cortex part”reported a p-value of 0.420 in one experiment and 0.025 in the other, whilst only changing counts from 10 to 14. Both of these examples were reported as non-significant when directly compared using the log odd ratios proposed in Eq. 3 with p-values of 0.763 and 0.399, respectively. This suggests that differences observed using the overlap method are likely to be false-positives as a consequence of specificity issues (i.e. proportion of correctly classified negative results).
To better illustrate the differences, we compared the overlap method to the log odds ratio method by directly computing the differential of p-values (scored as the
A
B
C
D
Fig. 4Comparison of CompGO to the overlap method. Differentially enriched GO terms using the overlap method (p≤0.05) foraNKX2-51vs. NKX2-52
andbNKX2-51vs. ELK4.cLog odds ratio of NKX2-51vs. NKX2-52versus differential p-values returned from DAVID, scored as the difference between –log10 transformed vales.dLog odds ratio of NKX2-51vs. ELK4 versus differential p-values returned from DAVID, scored as the difference between–log10
[image:6.595.61.536.87.439.2]difference between –log10 transformed p-values or
sim-ply ‘Δ –log10 p-value’) returned by DAVID to the log
odds ratio returned from direct comparison using CompGO for NKX2-51 versus NKX2-52 (Fig. 4c) and
NKX2-51 versus ELK4 (Fig. 4d). For NKX2-51 versus
NKX2-52, this illustrated that GO terms reported by the
overlap method did not approximate to the tails of the distribution where differences would be expected to occur if compared directly as per the log odds ratio in Eq. 3. When comparing NKX2-51 to ELK4 some concordance
was observed, but there was still a large number of differ-entially enriched GO terms identified using CompGO that were 1) not detected using the overlap method; and 2) not approximating to the tails of the logodds distribution -likely to be false positives (Fig. 4d). In addition to hard thresholding, DieGOs identified by CompGO and not detected using the overlap method arose as a result of “under-representation”. This is because the log odds ratio (Eq. 3) considers both tails of the distribution, in contrast to the single-tailed modified Fishers exact test im-plemented in DAVID which only considers over-representation. For example, DAVID returned p-values of 0.54 and 1.00 for GO:0006811 ~ ion transport indicating that this GO term was not significantly over-represented in either set, however CompGO returned a p-value of 0.0003 which reflected an under-representation of this term for ELK4 targets (z-scores: 1.57 vs. -3.23). Therefore, the approach of hard thresholding of individual GO statis-tical results from each comparison and performing over-laps introduces many false positives as well as missing potential differences. This illustrates how CompGO comes the issue of hard thresholding implicit in the over-lap method by directly computing differential enrichment via a log odds ratio, thereby reducing the number of false positive results.
Conclusions
CompGO enables rapid identification, comparison and visualization of differentially enriched GO terms calcu-lated from multiple lists of genetic loci. Through experi-mental data we illustrate the problems associated with comparing GO enrichment between experiments using a simple overlap method in contrast to the proposed log odds ratio. CompGO provides methods to address the questions of “how significant are GO enrichment differ-ences?”and“how similar are multiple experiments based on GO enrichments”. Input data can be .BED files or gene identifiers. CompGO is applicable to any species where a reference genome assembly is available. As CompGO is implemented in R, it is accessible to a broad range of users and can readily be incorporated into exist-ing pipelines. CompGO is an easy and fast comparative package for GO enrichments from experimentally identi-fied DNA regions or genes.
Availability
Project name:CompGO
Project home page: http://www.bioconductor.org/pack-ages/release/bioc/html/CompGO.html
Operating system(s):Platform independent Programming language:R
Other requirements:BioC 2.14 (R-3.1) License:GPL-2
Abbreviations
GO:Gene Ontology; DiEGOs: Differentially Enriched Gene Ontologies; JC: Jaccard coefficient; DAVID: The Database for Annotation, Visualization and Integrated Discovery; HD: NKX2-5 homeodomain; YRD: NKX2-5 tyrosine-rich domain; TFs: Transcription factors.
Competing interests
The authors declare that they have no competing interests.
Authors’contributions
AJW conceived the project, carried out development and implementation of the software, and drafted the manuscript. SB carried out development and implementation of the software. RB provided valuable discussion and helped draft the manuscript. RPH helped draft the manuscript. All authors read and approved the final manuscript.
Acknowledgements
The authors would like to thank Marc Carlson for helpful comments when building and submitting CompGO to Bioconductor.
Funding
This work was funded by grants from the National Health and Medical Research Council, Australia (NHMRC; 573705, 573703, 1061539), Australia Research Council Strategic Initiative in Stem Cell Science (Stem Cells Australia; 110001002), the Australian-India Strategic Research Fund (BF020084) and Foundation Leducq.
Author details
1Victor Chang Cardiac Research Institute, Darlinghurst, NSW 2010, Australia. 2
Present Address: Children’s Medical Research Institute, Westmead, NSW 2145, Australia.3St. Vincent’s Clinical School, University of New South Wales,
Kensington 2052, Australia.4School of Biotechnology and Biomolecular Sciences, University of New South Wales Faculty of Science, New South Wales 2052, Australia.5Stem Cells Australia, Melbourne Brain Centre, University of Melbourne, Victoria 3010, Australia.
Received: 14 March 2015 Accepted: 13 August 2015
References
1. Ashburner M, Ball CA, Blake JA, Botstein D, Butler H, Cherry JM, et al. Gene ontology: tool for the unification of biology. The Gene Ontology Consortium. Nat Genet. 2000;25(1):25–9.
2. Blake JA, Dolan M, Drabkin H, Hill DP, Li N, Sitnikov D, et al. Gene Ontology annotations and resources. Nucleic Acids Res. 2013;41(Database issue):D530–535.
3. McLean CY, Bristor D, Hiller M, Clarke SL, Schaar BT, Lowe CB, et al. GREAT improves functional interpretation of cis-regulatory regions. Nat Biotechnol. 2010;28(5):495–501.
4. da Huang W, Sherman BT, Lempicki RA. Systematic and integrative analysis of large gene lists using DAVID bioinformatics resources. Nat Protoc. 2009;4(1):44–57.
5. Subramanian A, Tamayo P, Mootha VK, Mukherjee S, Ebert BL, Gillette MA, et al. Gene set enrichment analysis: a knowledge-based approach for interpreting genome-wide expression profiles. Proc Natl Acad Sci U S A. 2005;102(43):15545–50.
7. Zheng Q, Wang XJ. GOEAST: a web-based software toolkit for Gene Ontology enrichment analysis. Nucleic Acids Res. 2008;36(Web Server issue):W358–363.
8. Merico D, Isserlin R, Stueker O, Emili A, Bader GD. Enrichment map: a network-based method for gene-set enrichment visualization and interpretation. PLoS One. 2010;5(11):e13984.
9. Fruzangohar M, Ebrahimie E, Ogunniyi AD, Mahdi LK, Paton JC, Adelson DL. Comparative GO: a web application for comparative gene ontology and gene ontology-based gene selection in bacteria. PLoS One.
2013;8(3):e58759.
10. Morris JA, Gardner MJ. Calculating confidence intervals for relative risks (odds ratios) and standardised ratios and rates. Br Med J (Clin Res Ed). 1988;296(6632):1313–6.
11. Katz D, Baptista J, Azen SP, Pike MC. Obtaining Confidence Intervals for the Risk Ratio in Cohort Studies. Biometrics. 1978;34(3):469–74.
12. Bouveret R, Waardenberg AJ, Schonrock N, Ramialison M, Doan T, Jong D, et al. NKX2-5 mutations causative for congenital heart disease retain functionality and are directed to hundreds of targets. eLife 2015, http:// elifesciences.org/content/early/2015/07/06/eLife.06942
13. Gentleman RC, Carey VJ, Bates DM, Bolstad B, Dettling M, Dudoit S, et al. Bioconductor: open software development for computational biology and bioinformatics. Genome Biol. 2004;5(10):R80.
14. Ihaka R, Gentleman R. R: A Language for Data Analysis and Graphics. J Comput Graph Stat. 1996;5(3):299–314.
15. Lawrence M, Gentleman R, Carey V. rtracklayer: an R package for interfacing with genome browsers. Bioinformatics. 2009;25(14):1841–2.
16. Fresno C, Fernandez EA. RDAVIDWebService: a versatile R interface to DAVID. Bioinformatics. 2013;29(21):2810–1.
17. Carlson M. KEGG.db: A set of annotation maps for KEGG. R package version 3.1.2. http://www.bioconductor.org/packages/release/data/annotation/html/ KEGG.db.html.
18. Levandowsky M, Winter D. Distance between Sets. Nature. 1971;234(5323):34–5.
19. He A, Kong SW, Ma Q, Pu WT. Co-occupancy by multiple cardiac transcription factors identifies transcriptional enhancers active in heart. Proc Natl Acad Sci U S A. 2011;108(14):5632–7.
20. Benson DW, Silberbach GM, Kavanaugh-McHugh A, Cottrill C, Zhang Y, Riggs S, et al. Mutations in the cardiac transcription factor NKX2.5 affect diverse cardiac developmental pathways. J Clin Invest. 1999;104(11):1567–73.
21. Costa MW, Guo G, Wolstein O, Vale M, Castro ML, Wang L, et al. Functional characterization of a novel mutation in NKX2-5 associated with congenital heart disease and adult-onset cardiomyopathy. Circ Cardiovasc Genet. 2013;6(3):238–47.
22. Hollenhorst PC, Jones DA, Graves BJ. Expression profiles frame the promoter specificity dilemma of the ETS family of transcription factors. Nucleic Acids Res. 2004;32(18):5693–702.
Submit your next manuscript to BioMed Central and take full advantage of:
• Convenient online submission
• Thorough peer review
• No space constraints or color figure charges
• Immediate publication on acceptance
• Inclusion in PubMed, CAS, Scopus and Google Scholar
• Research which is freely available for redistribution