2
About the author
Rebecca Johnes, Senior Researcher. Rebecca is principal author of EPI’s report, Widening the gap? The impact of the 30-hour entitlement on early years education and childcare, and co-author of a number of other EPI publications, including Grammar schools and social mobility, and Faith schools, pupil performance, and social selection. Before joining EPI in 2015, she worked in schools in both Japan and the UK, and also for a social integration charity, The Challenge.
Acknowledgements
This report was completed independently by the Education Policy Institute, with funding from Arts Council England and the City of London Corporation.
The author would like to thank Jon Andrews for his support with quality assurance and final drafting, Natalie Perera and David Laws for their editorial advice, and Sam Pither, Ieuan Bennett, and Jack Tarrant for their support with proof-reading.
About the Education Policy Institute
The Education Policy Institute is an independent, impartial, and evidence-based research institute that aims to promote high quality education outcomes, regardless of social background.
Education can have a transformational effect on the lives of young people. Through our research, we provide insights, commentary, and critiques about education policy in England – shedding light on what is working and where further progress needs to be made. Our research and analysis spans a young person's journey from the early years through to higher education and entry to the labour market. Because good mental health is vital to learning, we also have a dedicated mental health team which considers the challenges, interventions, and opportunities for supporting young people's wellbeing.
Our core research areas include: Accountability and Inspection Benchmarking English Education Curriculum and Qualifications
Disadvantaged, SEND, and Vulnerable Children Early Years Development
School Funding
School Performance and Leadership Teacher Supply and Quality
Children and Young People’s Mental Health
3
This publication includes analysis of the National Pupil Database (NPD):
https://www.gov.uk/government/collections/national-pupil-database
The Department for Education is responsible for the collation and management of the NPD and is the Data Controller of NPD data. Any inferences or conclusions derived from the NPD in this publication are the responsibility of the Education Policy Institute and not the Department for Education.
Published September 2017 Education Policy Institute.
4
Contents
Foreword ... 6
Executive summary ... 7
Overall entries to arts subjects ... 7
Factors influencing arts entries ... 8
Arts entries by region ... 9
Arts entries by pupil attainment ... 10
Arts entries by pupil characteristics ... 11
Part 1: Introduction ... 14
Policy context ... 14
Methodology ... 17
Structure of report ... 18
Part 2: Overall entries to subjects at Key Stage 4 ... 19
Summary ... 19
Entries to arts subjects at Key Stage 4 ... 20
Entries to design and technology subjects at Key Stage 4 ... 26
Entries to non-arts subjects at Key Stage 4 ... 28
Part 3: Entries to arts subjects by region ... 30
Summary ... 30
Entries to arts subjects by region ... 30
Part 4: Entries to arts subjects by school characteristics ... 33
Summary ... 33
State-funded and independent schools ... 33
School cohort size ... 34
Part 5: Entries to arts subjects by pupil attainment ... 36
Summary ... 36
Prior attainment ... 36
Attainment of five or more GCSEs or equivalent at grades A*-C including English and maths ... 38
EBacc entry and attainment... 40
Total number of exam entries ... 42
Part 6: Entries to arts subjects by pupil characteristics ... 44
Summary ... 44
Gender ... 44
5
Special educational needs and disabilities ... 47
Ethnicity ... 49
English as an additional language ... 51
Part 7: Factors impacting on uptake of arts subjects ... 53
Summary ... 53
Variation between schools ... 54
EBacc ... 54
Progress 8 ... 55
Financial pressures ... 57
School leadership ... 58
Parents and pupils... 58
Part 8: Conclusion ... 60
Annex 1 ... 61
Annex 2 ... 62
Annex 3 ... 64
Annex 4 ... 65
6
Foreword
The Education Policy Institute is an independent, impartial, and evidence-based research institute that aims to promote high quality education outcomes for all, through analysis that both informs and influences the policy debate in England and internationally.
Over recent years, the government has sought to incentivise the take-up of certain ‘traditional’ academic subjects at Key Stage 4 – through both incentives in the school accountability system and by restricting the range of qualifications which are counted in this system.
These changes have led to some concerns that certain subjects are ‘losing out’ in terms of student take-up. In this report, EPI looks at the recent trends in relation to take-up of arts subjects by Key Stage 4 cohorts. We also consider how arts take-up varies by region, and by pupil characteristics – such as prior attainment, socio-economic status, and gender.
The detailed picture which emerges from this report will help policy makers and others to understand the recent trends, and consider whether any actions need to be taken to address the issues highlighted in our report.
As ever, we welcome comment on the analysis and conclusions of this report, which will help inform future work in this area.
Rt. Hon. David Laws
7
Executive summary
Changes to school accountability measures in recent years have focused on increasing the take-up of a group of core academic subjects. The introduction of the English Baccalaureate (EBacc) and of Progress 8 has prompted concerns that arts subjects may be at risk, as they are not included in the EBacc. This report offers new insights into this issue by analysing trends in entries to arts subjects by Key Stage 4 cohorts between 2007 and 2016. It includes comparisons between different regions, and variations by pupil characteristics, such as gender, socio-economic status, and prior attainment.
Overall entries to arts subjects
Accounting for variation in cohort size, entries to arts subjects by Key Stage 4 cohorts have declined over the past couple of years, following several years of gradual increases.1 The
2016 entry rates are the lowest of the decade.
The average number of arts entries per pupil has fallen since 2013, standing at 0.70 in 2016; this is lower than at any other time in the period under review and comes after an increase between 2010 and 2013 from 0.75 to 0.80.
Similarly, the proportion of pupils taking at least one arts subject fell in both 2015 and 2016, reaching 53.5 per cent in the latter year. Again, this is the lowest figure for the decade and follows an increase between 2010 and 2014, from 55.6 per cent to 57.1 per cent.
If in 2016 the same proportion of pupils had taken at least one arts entry as in 2014, then this would have resulted in around 19,000 more pupils accessing an arts subject; if the same proportion had been evident as in 2007 then this would have meant just over 11,000 more pupils doing so.
1 In this report, arts qualifications are defined as those which relate to the following subject areas: art and
design; drama and theatre; media, film, and TV studies; music; dance; and performing arts. Any qualification recorded in the Department for Education’s exam entry files as having been taken by a pupil by the end of Key Stage 4 was included in the analysis, with the exception of those which are discounted from school
8
Figure 1.1: Percentage of pupils with at least one arts entry, 2007-16
Provisional data relating to 2017 exam entries indicate that the decline observed in the most recent years is continuing.
The nature of arts entries has changed substantially over the past decade. Between 2007 and 2012, entries to arts GCSEs fell, whilst entries to non-GCSE level 1/2 qualifications rose. These trends have since reversed, with a more recent shift away from non-GCSE level 1/2 qualifications and back towards GCSEs. This is likely to be due to the reduction of the number of non-GCSE qualifications included in school performance tables in 2014.
Factors influencing arts entries
Evidence from teachers and school leaders indicates that various factors are placing
pressure on arts subjects, including the EBacc, Progress 8, and financial issues. However, the extent to which this pressure impacts on a school’s arts provision depends on the precise combination of these factors within the school’s specific context, and the extent to which school leaders are able or willing to prioritise arts subjects under these circumstances.
The EBacc was introduced and expanded with the intention of raising the quality of academic education available to all pupils. Existing research suggests that it may be achieving these aims, with pupils at schools that substantially increased their EBacc rates showing higher average attainment in GCSE English and maths and lower probabilities of leaving education after the age of 16. In addition, pupils eligible for pupil premium funding
55.6% 55.7% 55.5% 55.6% 55.8% 56.4%
56.6% 57.1% 55.9%
53.5%
45% 50% 55% 60% 65%
2007 2008 2009 2010 2011 2012 2013 2014 2015 2016
Perc
en
ta
ge
o
f
p
u
p
9
benefited most from the change in curriculum at these schools.2 Yet at the same time, the
EBacc is often cited as a key threat to arts subjects.3
It is likely that it is the EBacc element of Progress 8 which is currently particularly putting pressure on arts subjects, by limiting the number of option subject slots that can be filled by non-EBacc subjects. Progress 8 reserves a total of five slots for EBacc subjects, although it does not require pupils to be entered for all components of the EBacc.4 It is therefore likely
to be considered accessible for a greater number of pupils. In addition, unlike the EBacc, Progress 8 is used to assess whether a school has met the minimum floor standard. This means that the incentives are stronger for schools to ensure that pupils fulfil its
requirements. In 2016, the year that Progress 8 was first used across all schools, the proportion of pupils entered for four EBacc components rose by 10.8 percentage points, compared to a 1 percentage point increase in the proportion of pupils entered for the full EBacc. Schools currently appear to be entering pupils for a greater number of EBacc
subjects, but not in a way that is increasing the proportion that are entered for the full EBacc – in other words, the behaviour seems to be in response to improving Progress 8 outcomes rather than improving the EBacc measure itself.
However, Progress 8 also provides an element of protection for arts subjects, as it includes three slots which can be filled by a variety of subjects including the arts. This means that the measure incentivises schools to limit the number of option slots available to pupils at Key Stage 4 whilst continuing to offer a variety of arts subjects if high grades are achieved by pupils who do choose to take them.
Arts entries by region
There is a clear and consistent North-South divide in entries to arts subjects, with Southern regions showing higher entry rates than Northern regions.
In 2016, the North East experienced a particularly sharp drop in arts entries. The
proportion of pupils entering at least one arts subject now ranges from 57.3 per cent in the South West to 47.8 per cent in the North East, a gap of 9.5 percentage points.
2 R. Allen and D. Thomson, Changing the subject: How are the EBacc and Attainment 8 reforms changing results?, The Sutton Trust, July 2016: https://www.suttontrust.com/wp-content/uploads/2016/07/Changing-the-subject_V4.pdf.
3 The Bacc for the Future campaign, led and supported by over 200 arts and education organisations, has been
particularly prominent in criticism of the impact of the EBacc on arts subjects:
http://www.baccforthefuture.com/. In addition, the EBacc was commonly cited as causing a decline in the take-up of arts subjects by the small sample of teachers surveyed and interviewed for this report.
4 For example, a pupil with entries in English, mathematics, geography, and double award science would have
10
Figure 1.2: Percentage of pupils with at least one arts entry, by region, 2016
Arts entries by pupil attainment
Before 2013, pupils with high prior attainment were more likely than those with medium or low prior attainment to enter at least one arts subject. This pattern has since been reversed, and those with medium or low prior attainment are now more likely to have at least one arts entry. In 2016, the gap was 3.5 percentage points (54.4 per cent for pupils with medium and low prior attainment, compared with 50.9 per cent for those with high prior
attainment).
The proportion of pupils with at least one arts entry has been falling since 2011 for those with high prior attainment, and since 2014 for those with medium or low prior attainment.
This could be because high attaining pupils were the first to be encouraged by their schools to enter the EBacc. In contrast, those with medium or low prior attainment may have initially been guided towards arts subjects, away from vocational qualifications, which the Coalition Government committed to reform soon after taking office. More recently, these pupils may have shifted away from arts subjects as schools focus on ensuring that they fulfil the EBacc element of Progress 8, even if they do not take the full set of EBacc subjects.
57.3% 57.0% 56.7%
55.4%
53.5% 53.0%
52.1%
51.3% 51.1% 50.9%
47.8%
30% 35% 40% 45% 50% 55% 60%
South West
South East
Inner London
East England Outer London
Yorkshire and the Humber
East Midlands
North West
West Midlands
North East
Perc
en
ta
ge
o
f
p
u
p
11
Figure 1.3: Percentage of pupils with at least one arts entry, by prior attainment, 2010-16
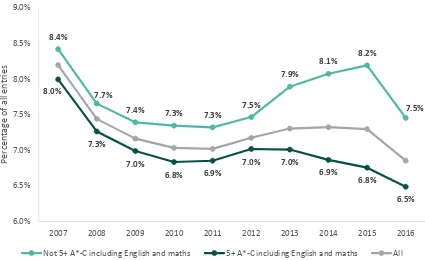
Pupils who do not enter the EBacc are more likely to take at least one arts subject than those who do fulfil its requirements. In 2016, this gap stood at 7.3 percentage points (56.5 per cent for pupils who do not enter the EBacc, compared with 49.2 per cent for those who do). Therefore, although EBacc entrants are less likely to take an arts subject, nearly half of them nevertheless do so.
Figure 1.4: Percentage of pupils with at least one arts entry, by EBacc entry, 2011-16
Arts entries by pupil characteristics
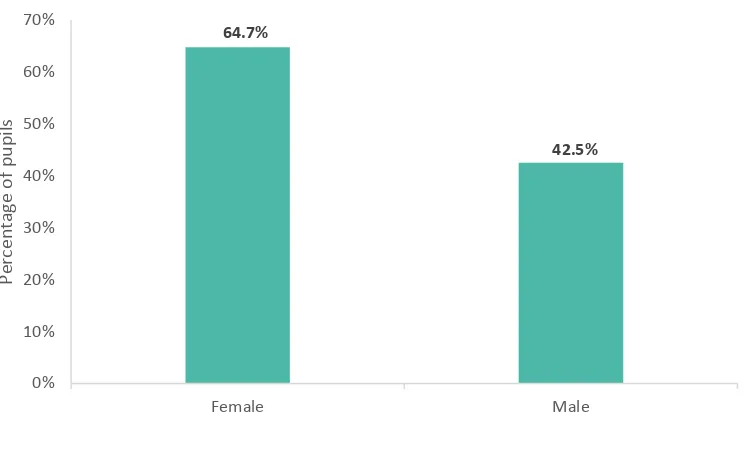
There is a very large gender gap in entries to arts subjects. In 2016, 64.7 per cent of girls took at least one arts subject, compared with 42.5 per cent of boys, a gap of 22.3
percentage points.
54.9% 57.9% 54.4% 57.6% 54.9%
50.9%
0% 10% 20% 30% 40% 50% 60% 70%
Medium or low prior attainment High prior attainment
Perc
en
ta
ge
o
f
p
u
p
ils
2010 2014 2016
57.2%
51.0% 60.1%
52.7% 56.5%
49.2%
0% 10% 20% 30% 40% 50% 60% 70%
Non-EBacc entry EBacc entry
Perc
en
ta
ge
o
f
p
u
p
ils
12
Figure 1.5: Percentage of pupils with at least on arts entry, by gender, 2016
[image:12.595.88.461.87.321.2] Until 2014, pupils eligible for free school meals (FSM) were less likely to enter at least one arts subject than were their peers. Since 2014, the proportion of pupils with at least one arts entry has fallen for both groups of pupils, but it remains slightly higher for FSM pupils. In 2016, the gap stood at 0.5 percentage points (53.9 per cent of FSM pupils, compared with 53.4 per cent of non-FSM pupils).
Figure 1.6: Percentage of pupils with at least one arts entry, by FSM eligibility, 2010-16
At the start of the decade, pupils with special educational needs and disabilities (SEND) were much less likely to enter at least one arts subject, but this gap has narrowed over the years. In 2016, pupils with SEND were marginally more likely to have at least one arts entry, with 53.9 per cent doing so, compared with 53.4 per cent of their peers.
64.7%
42.5%
0% 10% 20% 30% 40% 50% 60% 70%
Female Male
Perc
en
ta
ge
o
f
p
u
p
ils
56.0%
52.7%
57.1% 57.3%
53.4% 53.9%
0% 10% 20% 30% 40% 50% 60% 70%
Non-FSM FSM
Perc
en
ta
ge
o
f
p
u
p
ils
13
There are substantial gaps in arts entries between pupils from different ethnic
backgrounds. Black Caribbean pupils have particularly high entry rates, whilst pupils from Indian and Pakistani backgrounds are much less likely to have at least one arts entry than those from other ethnic groups.
14
Part 1: Introduction
The state of arts subjects in England has been subject to heated debate in recent years. A number of organisations, including lobbyists from the arts sector and teaching unions, have warned that changes to school accountability measures and funding pressures have led to a decline in access to arts subjects in schools.5 Other organisations, however, including the Department for Education,
have contested these claims and have pointed to evidence that this is not the case.6
This report seeks to provide clarity to this debate. It provides new analysis on trends in entries to arts subjects between 2007 and 2016, taking into account all types of qualification entered by pupils by the end of Key Stage 4, and providing breakdowns according to a variety of school and pupil characteristics. In order to identify potential causes of the patterns identified, the statistical analysis is supplemented by small-scale qualitative research obtained via a survey and interviews with current secondary school teachers.
Policy context
Changes experienced by schools in two key areas have been cited as having an impact on pupils’ access to arts subjects: performance measures and funding. The English Baccalaureate (EBacc) was introduced as a school performance measure by the Coalition Government in 2010, with the intention of increasing pupil take-up of core academic subjects at Key Stage 4. A pupil is deemed to have achieved the EBacc if they attain a pass in a GCSE or equivalent qualification in its five
components: English, maths, history or geography, the sciences, and a language.7 Subsequently, the
Conservative Government which came to power in 2015 committed to extending the scope and significance of the measure.8 A government consultation launched in November 2015 outlined its
aspiration that, ultimately, at least 90 per cent of pupils in mainstream secondary schools should enter the EBacc.9 The government has recently published its response to this consultation; this sets
5 Cultural Learning Alliance, ‘Technical Briefing: English Baccalaureate’, October 2016, p.5:
https://www.culturallearningalliance.org.uk/images/uploads/Cultural_Learning_Alliance_EBacc_Technical_Bri efing_Oct_2016.pdf; NSEAD, The National Society for Education in Art and Design Survey Report 2015-16, February 2016: http://www.nsead.org/downloads/survey.pdf; ASCL, ASCL funding survey, March 2017:
https://www.ascl.org.uk/utilities/document-summary.html?id=679589DE-3D92-4B00-9DACDFAC88914AB0.
6 N. Gibb, ‘The claim that EBacc squeezes out the arts is wrong’, The Telegraph, 21 January 2016:
http://www.telegraph.co.uk/education/leaguetables/12110986/The-claim-that-EBacc-squeezes-out-the-arts-is-wrong.html; Department for Education, Trends in arts subjects in schools where English Baccalaureate entry
has increased, July 2017:
https://www.gov.uk/government/uploads/system/uploads/attachment_data/file/630223/Trends_in_arts_sub jects_in_schools_where_English_Baccalaureate_entry_has_increased.pdf; E. Fellows, The Two Cultures: Do
schools have to choose between the EBacc and the arts?, New Schools Network, February 2017:
http://www.newschoolsnetwork.org/sites/default/files/NSN%20Arts%20Report%20-%20The%20Two%20Cultures_0.pdf.
7 Department for Education, ‘English Baccalaureate (EBacc)’, gov.uk website, February 2016:
https://www.gov.uk/government/publications/english-baccalaureate-ebacc/english-baccalaureate-ebacc.
8 R. Long and P. Bolton, ‘English Baccalaureate’, House of Commons Library Briefing Paper 06045, June 2017: http://researchbriefings.parliament.uk/ResearchBriefing/Summary/SN06045.
9 Department for Education, Consultation on implementing the English Baccalaureate, launched 3 November
2015:
15
national targets for 75 per cent of pupils in state-funded mainstream schools to be starting EBacc courses by 2022 (entering exams for the full EBacc in 2024) and 90 per cent by 2025 (entering exams for the full EBacc in 2027).10
In addition, two new headline performance measures were introduced in 2016: Attainment 8 and Progress 8. Attainment 8 measures a pupil’s achievement in eight subjects: English, maths, three EBacc qualifications, and three further subjects (which can be either EBacc subjects or other approved qualifications). Progress 8 measures the progress made by a pupil in the same eight subjects between Key Stage 2 and Key Stage 4.11 Progress 8 is used to determine whether or not a
school is liable for intervention as a consequence of being defined as coasting or as falling below the floor standard. EBacc subjects have therefore assumed greater significance under this measure, although it does not require pupils to be entered for the full EBacc.
The proportion of pupils entered for the EBacc in state-funded schools has increased from 21.8 per cent in 2010 to 39.7 per cent in 2016, although the majority of this increase took place between 2012 and 2013.12
In addition to changes in performance measures, schools are experiencing funding pressures. Following large annual increases in per pupil spending during the 2000s (reaching around 5 per cent per year in real terms), school spending per pupil was broadly maintained at the same level in real terms from 2010-11 until 2015-16, since when school spending per pupil has been frozen in cash terms. Until recently, government spending commitments were such that, due to inflationary pressures and cuts to the Education Services Grant, it was unlikely that any school in England would avoid a real terms cut in per pupil funding between 2016-17 and 2019-20, and that approximately half of primary and secondary schools would experience large, real terms losses in per pupil funding of between 6 and 11 per cent by 2019-20.13 In July 2017, however, the government announced an
additional £1.3 billion in funding for schools over 2018-19 and 2019-20, ensuring that per pupil funding will be maintained in real terms up to 2019-20.14 Nevertheless, the Institute for Fiscal
Studies has stated that over the period between 2015 and 2020, school budgets will have fallen in real terms by 4.6 per cent.15
10 Department for Education, Implementing the English Baccalaureate: Government consultation response, July
2017, pp.8-9:
https://www.gov.uk/government/uploads/system/uploads/attachment_data/file/630713/Implementing_the_ English_Baccalaureate_-_Government_consultation_response.pdf.
11 Department for Education, Progress 8 and Attainment 8: Guide for maintained secondary schools, academies and free schools, January 2017:
https://www.gov.uk/government/uploads/system/uploads/attachment_data/file/583857/Progress_8_school_ performance_measure_Jan_17.pdf.
12 Department for Education, Revised GCSE and equivalent results in England: 2015 to 2016, January 2017: https://www.gov.uk/government/statistics/revised-gcse-and-equivalent-results-in-england-2015-to-2016.
13 N. Perera, J. Andrews, and P. Sellen, The implications of the National Funding Formula for schools, Education
Policy Institute, March 2017, p.7: https://epi.org.uk/wp-content/uploads/2017/03/170314.NFFReportv_FINAL.pdf.
14 Department for Education, ‘Justine Greening statement to parliament on school funding’, July 2017: https://www.gov.uk/government/speeches/justine-greening-statement-to-parliament-on-school-funding.
16
According to critics, these factors have resulted in a decline in pupils studying arts subjects at Key Stage 4.16 Evidence for this has been derived from a combination of official statistics of exam entries
from the Joint Council for Qualifications and Ofqual on the one hand,17 and surveys of teachers on
the other.18 In contrast, the government has denied that arts subjects are suffering.19 Recent analysis
by the Department for Education, based on data from the National Pupil Database, showed that the proportion of pupils entering at least one arts subject has remained generally stable between 2010-11 and 2015-16, both for schools which have experienced a large increase in EBacc entry rates and for other schools.20 Moreover, a report published by the New Schools Network, based on
Department for Education statistics, identified a small increase in the average number of arts GCSEs entered per pupil between 2011-12 and 2015-16.21
Some of the apparent contradictions in this debate have arisen due to differences in the types of statistics being used. Many of the concerns expressed about a decline in the arts have been based on raw entry numbers, whereas those defending the government position tend to take account of cohort sizes. In both cases, the use of entry numbers may result in a delayed identification of changes, as pupils tend to select their Key Stage 4 options two or three years before taking exams; this means that evidence from teacher surveys may highlight changes in access to arts subjects before such trends are evident in entry figures. Equally, however, such surveys may suffer from the self-selection of respondents who have particularly strong views on the issues covered in the survey and may therefore not necessarily be representative of the experience at a national level. On the other hand, the reports cited above which indicate stability or even increases in entry rates to arts
16 Criticism specifically of the impact of the EBacc on arts subjects has been voiced particularly strongly by the
Bacc for the Future campaign, led and supported by over 200 arts and education organisations:
http://www.baccforthefuture.com/.
17 Cultural Learning Alliance, ‘Patterns in GCSE entries 2010 to 2016’, August 2016:
http://www.culturallearningalliance.org.uk/images/uploads/Patterns_in_GCSE_entries_2010_to_2016_Englan d_only.pdf; Cultural Learning Alliance, ‘Technical Briefing: English Baccalaureate’, October 2016, p.5:
https://www.culturallearningalliance.org.uk/images/uploads/Cultural_Learning_Alliance_EBacc_Technical_Bri efing_Oct_2016.pdf; L. Hill, ‘Arts in schools plummets, new figures show’, Arts Professional, 21 June 2016:
http://www.artsprofessional.co.uk/news/exclusive-arts-schools-plummets-new-figures-show; S. Merritt, ‘Squeezing out arts for more ‘useful’ subjects will impoverish us all’, The Guardian, 26 June 2016:
https://www.theguardian.com/commentisfree/2016/jun/25/squeezing-out-arts-for-commercially-useful-subjects-will-make-our-culture-poorer.
18 University of Sussex, ‘Teachers blame EBacc for decline in Music student numbers’, 9 March 2017:
http://www.sussex.ac.uk/broadcast/read/39525; NSEAD, The National Society for Education in Art and Design
Survey Report 2015-16, February 2016: http://www.nsead.org/downloads/survey.pdf; ASCL, ASCL funding
survey, March 2017: https://www.ascl.org.uk/utilities/document-summary.html?id=679589DE-3D92-4B00-9DACDFAC88914AB0; ATL and NUT, School Cuts – Harming Education, April 2017:
https://www.atl.org.uk/sites/www.atl.org.uk/files/April%206%20for%2010%202017%20NUT%20ATL%20MEM BER%20SURVEY%20ON%20SCHOOL%20FUNDING%20report.pdf.
19 N. Gibb, ‘The claim that EBacc squeezes out the arts is wrong’, The Telegraph, 21 January 2016:
http://www.telegraph.co.uk/education/leaguetables/12110986/The-claim-that-EBacc-squeezes-out-the-arts-is-wrong.html.
20 Department for Education, Trends in arts subjects in schools where English Baccalaureate entry has increased, July 2017, pp.3-5:
https://www.gov.uk/government/uploads/system/uploads/attachment_data/file/630223/Trends_in_arts_sub jects_in_schools_where_English_Baccalaureate_entry_has_increased.pdf.
21 E. Fellows, The Two Cultures: Do schools have to choose between the EBacc and the arts?, New Schools
Network, February 2017, p.12:
17
subjects are based on entries at Key Stage 4 to GCSEs only, or to GCSEs, level 1/2 certificates, and AS levels, rather than taking into account all of the different types of qualifications which pupils may take by this point in their education. Finally, it is not clear from existing research the extent to which access to arts subjects varies by different school and pupil characteristics.
Methodology
This report attempts to overcome these issues. Its conclusions are based on quantitative analysis of data supplied by the Department for Education from the National Pupil Database (NPD) and exam entry files for each cohort of pupils reaching the end of Key Stage 4 over the decade between 2007 and 2016.
The exam entry files record each qualification taken by each pupil by the end of Key Stage 4, and therefore include not only GCSEs, but a large variety of other qualifications, ranging from entry level to level 3 (equivalent to AS and A level). Qualifications which were discounted from school
performance tables were excluded from the analysis so as to avoid double-counting similar qualifications taken by the same pupil.
Qualifications were grouped into various subject categories. For the purposes of this report, arts qualifications are defined as those which relate to the following subject areas: art and design; drama and theatre; media, film, and TV studies; music; dance; and performing arts. The analysis does not classify design and technology as an arts subject. This is in contrast to some of the existing analysis which criticises the impact of the EBacc on arts subjects and particularly on design and technology.22
However, design and technology has been excluded from the category of arts qualifications in this report because it includes subjects which have very little overlap with the arts, such as systems and control, and electronic products. It is also categorised separately from art and design in official publications by the Department for Education, including the national curriculum and statistical releases.
For each cohort, the exam entry files were matched with data contained within the NPD on school and pupil characteristics. Only pupils enrolled at mainstream schools were included in the analysis, which also focuses mainly on state-funded schools. This is because accountability measures that may be influencing entries are unlikely to have the same impact on non-mainstream and independent schools: proposals to extend the EBacc to more pupils have focused on those in mainstream schools,23 and Progress 8 data are not published for independent schools; independent schools,
special schools, pupil referral units, alternative provision, and hospital schools are also not subject to floor standards.24
22 L. Hill, ‘Arts in schools plummets, new figures show’, Arts Professional, 21 June 2016:
http://www.artsprofessional.co.uk/news/exclusive-arts-schools-plummets-new-figures-show; Cultural Learning Alliance, ‘Patterns in GCSE entries 2010 to 2016’, August 2016:
http://www.culturallearningalliance.org.uk/images/uploads/Patterns_in_GCSE_entries_2010_to_2016_Englan d_only.pdf.
23 Department for Education, Consultation on implementing the English Baccalaureate, launched 3 November
2015:
https://www.gov.uk/government/uploads/system/uploads/attachment_data/file/473455/Consultation_on_i mplementing_the_English_Baccalaureate.pdf.
18
Access to arts subjects was then tracked for each year between 2007 and 2016 using the following two measures:
Percentage of all entries taken by the cohort that were in arts subjects; Percentage of pupils in the cohort with at least one arts entry.
In addition to overall trends for each category of arts subject at a national level, these measures were used to identify patterns in arts entries in different regions and according to different school and pupil characteristics.
This data analysis is supplemented by small-scale qualitative evidence obtained directly from secondary school teachers and leaders via an online survey which was promoted via social media. A number of schools were also specifically targeted via email and (in some cases) telephone in order to request a survey response; these were selected on the basis of schools for which the percentage of exam entries in the arts showed a relatively high increase or decrease, or a high level of stability, when comparing 2010 with 2015. In total, 51 individuals submitted responses to the online survey. Of these, 11 people participated in follow-up telephone interviews in order to discuss their
experiences and views in more detail. The evidence obtained from this exercise is used in the report to point to possible explanations for the patterns identified in the data analysis. It provides
contextual information only and is not used to quantify the extent to which the various experiences and views of respondents are shared by teachers more widely.
Structure of report
This report proceeds as follows. The next section examines overall trends in entries to different arts subjects between 2007 and 2016, and compares these with entries to non-arts subjects over the same period. The third chapter compares differences in arts entries between the various regions in England, whilst the fourth provides breakdowns by different school characteristics, including size of school and whether it is located in the independent or state sector. The fifth chapter assesses entries by pupil attainment and overall entry patterns; the sixth section then considers variations in entries by different pupil demographic groups, including eligibility for free school meals, ethnicity, first language other than English, and gender. The seventh chapter discusses possible causes of the patterns identified in the preceding sections, drawing on the evidence obtained from secondary school teachers and leaders. The final section concludes by considering the implications of this research for future policy.
19
Part 2: Overall entries to subjects at Key Stage 4
Summary
Accounting for variation in cohort size, entries to arts subjects by Key Stage 4 cohorts have declined over the past couple of years, following several years of gradual increases.25 The
2016 entry rates are the lowest of the decade.
The average number of arts entries per pupil has fallen since 2013, standing at 0.70 in 2016; this is lower than at any other time in the period under review and comes after an increase between 2010 and 2013 from 0.75 to 0.80.
Similarly, the proportion of pupils taking at least one arts subject fell in both 2015 and 2016, reaching 53.5 per cent in the latter year. Again, this is the lowest figure for the decade and follows an increase between 2010 and 2014, from 55.6 per cent to 57.1 per cent.
If in 2016 the same proportion of pupils had taken at least one arts entry as in 2014, then this would have resulted in around 19,000 more pupils accessing an arts subject; if the same proportion had been evident as in 2007 then this would have meant just over 11,000 more pupils doing so.
Provisional data relating to 2017 exam entries indicate that the decline observed in the most recent years is continuing.
The nature of arts entries has changed substantially over the past decade. Between 2007 and 2012, entries to arts GCSEs fell, whilst entries to non-GCSE level 1/2 qualifications rose. These trends have since reversed, with a more recent shift away from non-GCSE level 1/2 qualifications and back towards GCSEs. This is likely to be due to the reduction of the number of non-GCSE qualifications included in school performance tables in 2014.
25 In this report, arts qualifications are defined as those which relate to the following subject areas: art and
design; drama and theatre; media, film, and TV studies; music; dance; and performing arts. Any qualification recorded in the Department for Education’s exam entry files as having been taken by a pupil by the end of Key Stage 4 was included in the analysis, with the exception of those which are discounted from school
20
Entries to arts subjects at Key Stage 4
[image:20.595.87.511.156.410.2]Overall entries to arts subjects at Key Stage 4 for pupils in state-funded mainstream schools are outlined in the chart below for each year between 2007 and 2016.26
Figure 2.1: Entries to all arts subjects, 2007-16
The number of entries to all arts subjects fluctuated around 430,000 most years between 2007 and 2014, with the exception of a particularly high number of entries (nearly 447,000) in 2013. In 2015, there was a notable fall in entries to just over 408,000, followed by a much larger decrease in 2016 to just over 371,000. These overall figures, however, conceal variation in the nature of entries during this period: the years 2007 to 2012 saw a decline in entries to GCSE arts qualifications, and a
concomitant rise in non-GCSE level 1/2 arts qualifications. Between 2012 and 2015, the number of entries to arts GCSEs increased, whilst since 2013, the number of entries to non-GCSE level 1/2 arts qualifications has been falling. It is likely that these shifts have been driven by changes to school performance tables, introduced in 2014 in response to the Wolf Review of 2011. New quality criteria were applied to qualifications in order to determine inclusion in these performance tables; this led to a substantial reduction in the number of non-GCSE qualifications included. In addition, under the new system, no qualification can be counted as equivalent to more than one GCSE. A drop in non-GCSE level 1/2 qualifications is first evident in 2014 (the year that these changes were first applied to
26 Unless otherwise stated, this analysis looks at pupils in state-funded mainstream schools only. In Figures 2.1
to 2.11, total numbers of entries are in each case rounded to the nearest thousand. The qualification types included are: entry level; level 1/2 – GCSE (including short, full, and double GCSEs, and vocational GCSEs); level 1/2 – graded exam (graded drama, music, literature, speech, and dance exams at grades 1 to 5); level 1/2 – all other level 1/2 qualifications (any level 1/2 qualification not included in the previous two categories); level 3 – AS/A level (including full and double AS and A levels, and vocational and applied AS and A levels); level 3 – graded exam (graded drama, music, literature, speech, and dance exams at grades 6 to 8); level 3 – all other level 3 qualifications (any level 3 qualification not included in the previous two categories); and qualification without specified level (level of qualification not given in exam entry files).
431,000 435,000 424,000 428,000 430,000 436,000 447,000 432,000408,000 371,000
8.2% 7.4%
7.2% 7.0% 7.0% 7.2% 7.3% 7.3% 7.3% 6.9%
0% 5% 10% 15% 20% 25%
0 50,000 100,000 150,000 200,000 250,000 300,000 350,000 400,000 450,000 500,000
2007 2008 2009 2010 2011 2012 2013 2014 2015 2016
Perc
en
ta
ge
o
f
all
exa
m
en
tries
N
u
m
b
er
en
tries
Entry level Level 1/2 - GCSE
Level 1/2 - Graded exam Level 1/2 - All other level 1/2 qualifications Level 3 - AS/A level Level 3 - Graded exam
21
school performance tables) and this decline appears to be ongoing. In 2016, entries to both GCSE and non-GCSE level 1/2 qualifications fell, meaning that the number of arts GCSE entries was lower than for any other year in the past decade.
Looking only at raw numbers of entries, however, does not allow for variations in the total number of exam entries each year. Focusing on the percentage of all exam entries which are arts subjects accounts for such variation. Following a drop between 2007 and 2008, this figure remained stable until 2015, and stood at 7.3 per cent for three consecutive years between 2013 and 2015; this is because the move away from non-GCSE level 1/2 qualifications was accompanied by a rise in GCSE entries. In 2016, however, entries to both GCSE and non-GCSE level 1/2 entries fell, meaning that the percentage of arts qualifications dropped by 0.4 percentage points to 6.9 per cent; this is lower than for any other year in the period under examination, although it is only slightly below the equivalent figure for 2010.
Controlling for the size of the pupil cohort, the average number of arts entries per pupil increased slightly up to 2013, but has since fallen. Between 2015 and 2016, it dropped by 0.05 from, 0.75 to 0.70; again, this is the lowest figure for the past decade, but not substantially below the level evident in 2010.
Figure 2.2: Average number arts entries per pupil, 2007-16
Provisional data released by Ofqual on 2017 exam entries to GCSE, level 1/2 certificates, and AS and A levels indicate that the drop seen in 2016 is ongoing. As a percentage of all entries for pupils in Year 11, the data indicate that arts qualifications fell from 7.6 per cent in 2015 to 7.1 per cent in 2016 and, most recently, to 6.7 per cent in 2017.27
27 These figures are calculated from data published in: Ofqual, ‘Summer 2017 exam entries: GCSEs, level 1/2
certificates, AS and A levels in England’, June 2017: https://www.gov.uk/government/statistics/summer-2017-exam-entries-gcses-level-1-2-certificates-as-and-a-levels-in-england. They differ from those presented in
431,000 435,000 424,000 428,000 430,000 436,000 447,000 432,000 408,000
371,000
0.74 0.75 0.75 0.75 0.77 0.79 0.80 0.79 0.75
0.70 0.0 0.2 0.4 0.6 0.8 1.0 1.2 1.4 1.6 1.8 2.0 0 50,000 100,000 150,000 200,000 250,000 300,000 350,000 400,000 450,000 500,000
2007 2008 2009 2010 2011 2012 2013 2014 2015 2016
Av era ge n u m b er en tries p er p u p il N u m b er en tries
Entry level Level 1/2 - GCSE
Level 1/2 - Graded exam Level 1/2 - All other level 1/2 qualifications Level 3 - AS/A level Level 3 - Graded exam
22
Entries to individual arts subject groupings have largely followed the overall pattern for arts qualifications, with numbers of entries to GCSEs mostly increasing from around 2012 or 2013 until 2015, whilst entries to non-GCSE level 1/2 qualifications have been falling over roughly the same period; entries to both GCSE and non-GCSE arts qualifications then fell in 2016. As a percentage of all exam entries, entries to individual arts subject groupings have remained broadly stable, although most show a small drop in 2016.
Figure 2.3: Entries to art and design, 2007-16
Figure 2.1, above, which are derived from underlying exam entries linked with the NPD. This is partly because the Ofqual figures relate to all schools and colleges, whereas the figures in this report focus on mainstream, state-funded schools (unless otherwise stated). In addition, the Ofqual figures include only GCSEs, level 1/2 certificates, and AS and A levels, whereas the exam entries include qualifications at all levels taken by the end of Key Stage 4.
190,000 188,000 183,000 183,000 180,000 183,000 190,000 181,000 175,000
160,000
3.6%
3.2% 3.1%
3.0% 2.9% 3.0% 3.1% 3.1% 3.1% 3.0%
0% 1% 2% 3% 4% 5%
0 20,000 40,000 60,000 80,000 100,000 120,000 140,000 160,000 180,000 200,000
2007 2008 2009 2010 2011 2012 2013 2014 2015 2016
Perc
en
ta
ge
o
f
all
exa
m
en
tries
N
u
m
b
er
en
tries
Entry level Level 1/2 - GCSE
Level 1/2 - Graded exam Level 1/2 - All other level 1/2 qualifications Level 3 - AS/A level Level 3 - Graded exam
23 Figure 2.4: Entries to drama and theatre, 2007-16
Figure 2.5: Entries to media, film, and TV studies, 2007-16
93,000 95,000 94,000 97,000 98,000
102,000 109,000 106,000 96,000
89,000
1.8% 1.6% 1.6% 1.6% 1.6% 1.7% 1.8% 1.8% 1.7% 1.6%
0% 1% 2% 3% 4% 5% 0 20,000 40,000 60,000 80,000 100,000 120,000
2007 2008 2009 2010 2011 2012 2013 2014 2015 2016
Perc en ta ge o f all exa m en tries N u m b er en tries
Entry level Level 1/2 - GCSE
Level 1/2 - Graded exam Level 1/2 - All other level 1/2 qualifications Level 3 - AS/A level Level 3 - Graded exam
Level 3 - All other level 3 qualifications Qualification without specified level Percentage of entries
63,000
69,000 70,000 74,000
76,000 77,000
73,000
70,000
65,000
55,000
1.2% 1.2% 1.2% 1.2% 1.2% 1.3% 1.2% 1.2% 1.2%
1.0% 0% 1% 2% 3% 4% 5% 0 10,000 20,000 30,000 40,000 50,000 60,000 70,000 80,000 90,000
2007 2008 2009 2010 2011 2012 2013 2014 2015 2016
Perc en ta ge o f all exa m en tries N u m b er en tries
Entry level Level 1/2 - GCSE
Level 1/2 - Graded exam Level 1/2 - All other level 1/2 qualifications Level 3 - AS/A level Level 3 - Graded exam
24 Figure 2.6: Entries to music, 2007-16
Figure 2.7: Entries to dance, 2007-16
55,000 55,000
51,000 49,000 52,000 54,000
56,000 55,000
52,000
49,000
1.1% 0.9%
0.9% 0.8% 0.9% 0.9% 0.9% 0.9% 0.9% 0.9%
0% 1% 2% 3% 4% 5% 0 10,000 20,000 30,000 40,000 50,000 60,000
2007 2008 2009 2010 2011 2012 2013 2014 2015 2016
Perc en ta ge o f all exa m en tries N u m b er en tries
Entry level Level 1/2 - GCSE
Level 1/2 - Graded exam Level 1/2 - All other level 1/2 qualifications Level 3 - AS/A level Level 3 - Graded exam
Level 3 - All other level 3 qualifications Qualification without specified level Percentage of entries
19,000
17,000
16,000
15,000
13,000
12,000 12,000 12,000 12,000
11,000
0.4% 0.3% 0.3% 0.3% 0.2%
0.2% 0.2% 0.2% 0.2% 0.2%
0% 1% 2% 3% 4% 5% 0 2,000 4,000 6,000 8,000 10,000 12,000 14,000 16,000 18,000 20,000
2007 2008 2009 2010 2011 2012 2013 2014 2015 2016
Perc en ta ge o f all exa m en tries N u m b er en tries
Entry level Level 1/2 - GCSE
Level 1/2 - Graded exam Level 1/2 - All other level 1/2 qualifications Level 3 - AS/A level Level 3 - Graded exam
25 Figure 2.8: Entries to performing arts, 2007-16
The percentage of pupils with at least one entry to an arts subject has also remained broadly stable for much of the decade. However, small increases each year between 2009 and 2014 were followed by a fall of 1.2 percentage points in 2015, and a further decrease of 2.4 percentage points in 2016. At 53.5 per cent, the proportion of pupils taking at least one arts qualification was lower in 2016 than for any other year under review, but it is not substantially below the level evident in 2010.
In 2016, the total Key Stage 4 cohort for state-funded mainstream schools was approximately 530,000 pupils. If in 2016 the same proportion of pupils had taken at least one arts entry as in 2014, then this would have resulted in around 19,000 more pupils accessing an arts subject; if the same proportion had been evident as in 2007 then this would have meant just over 11,000 more pupils doing so.
These findings differ from analysis recently published by the Department for Education on trends in entries to arts subjects, which describes the proportion of pupils entering at least one arts subject as ‘broadly stable’ between 2011 and 2016,28 although its figures do indicate an increase of 3.3
percentage points in 2014 and a drop of 1.7 percentage points in 2016.29 The analysis contained here
instead indicates that the decline began in 2015 and that the drop for 2016 was larger – around 2.4 percentage points. The reason for these differences is the inclusion of different qualifications in the analysis. The Department for Education includes only full and double GCSEs, level 1/2 certificates, and AS levels, whereas this analysis includes all types of qualifications taken by pupils by the end of
28 Department for Education, Trends in arts subjects in schools where English Baccalaureate entry has increased, July 2017, p.3:
https://www.gov.uk/government/uploads/system/uploads/attachment_data/file/630223/Trends_in_arts_sub jects_in_schools_where_English_Baccalaureate_entry_has_increased.pdf.
29 Exact figures calculated from underlying data published alongside: Department for Education, Trends in arts subjects in schools where English Baccalaureate entry has increased, July 2017:
https://www.gov.uk/government/publications/trends-in-arts-subjects-in-schools-with-increased-ebacc-entry. 11,000 11,000
10,000 10,000 10,000
8,000 8,000 8,000 9,000 7,000
0.2% 0.2% 0.2% 0.2% 0.2% 0.1% 0.1% 0.1% 0.2% 0.1%
0% 1% 2% 3% 4% 5%
0 2,000 4,000 6,000 8,000 10,000 12,000 14,000 16,000 18,000 20,000
2007 2008 2009 2010 2011 2012 2013 2014 2015 2016
Perc
en
ta
ge
o
f
all
exa
m
en
tries
N
u
m
b
er
en
tries
Entry level Level 1/2 - GCSE
Level 1/2 - Graded exam Level 1/2 - All other level 1/2 qualifications Level 3 - AS/A level Level 3 - Graded exam
26
Key Stage 4.30 The shift outlined above towards GCSEs and away from non-GCSE level 1/2
qualifications means that focusing only on GCSEs, level 1/2 certificates, and AS levels underestimates the extent of the recent decline.
Figure 2.9: Percentage of pupils with at least one arts entry, 2007-16
Entries to design and technology subjects at Key Stage 4
Changes in entries to technology and related subjects have been much more stark,31 with numbers
of entries falling every year between 2007 and 2016, driven particularly by a drop in entries to GCSE qualifications. The percentage of all exam entries which are related to technology has declined steadily over most of the decade, from 6.7 per cent in 2007 to 3.7 per cent in 2016.
30 It is for this reason also that this report identifies a higher proportion of pupils entering at least one arts
subject in each year than does the Department for Education analysis.
31 In addition to design and technology, this includes subjects related to engineering, construction, and
manufacturing in this analysis.
55.6% 55.7% 55.5% 55.6% 55.8%
56.4% 56.6% 57.1%
55.9%
53.5%
45% 50% 55% 60% 65%
2007 2008 2009 2010 2011 2012 2013 2014 2015 2016
Perc
en
ta
ge
o
f
p
u
p
27
Figure 2.10: Entries to design and technology and related subjects, 2007-16
When arts subjects are combined with design and technology and related subjects, the total number of entries has decreased every year between 2007 and 2016, but the percentage of all entries which fall into these categories remained largely stable between 2011 and 2015, fluctuating between 11.2 and 11.4 per cent. In 2016, however, the figure fell by 0.7 percentage points to 10.5 per cent, which is the lowest figure of the decade.
Figure 2.11: Entries to arts and design and technology and related subjects, 2007-16
350,000 332,000 312,000 298,000 271,000 259,000 241,000 236,000 221,000 200,000 6.7%
5.7% 5.3% 4.9%
4.4% 4.3% 3.9% 4.0% 3.9% 3.7%
0% 5% 10% 15% 20% 25% 0 50,000 100,000 150,000 200,000 250,000 300,000 350,000 400,000
2007 2008 2009 2010 2011 2012 2013 2014 2015 2016
Perc en ta ge o f all exa m en tries N u m b er en tries
Entry level Level 1/2 - GCSE
Level 1/2 - Graded exam Level 1/2 - All other level 1/2 qualifications Level 3 - AS/A level Level 3 - Graded exam
Level 3 - All other level 3 qualifications Qualification without specified level Percentage of entries
781,000 766,000
736,000 726,000
700,000 695,000 688,000 668,000 629,000
571,000
14.9%
13.1% 12.4%
11.9% 11.4% 11.4% 11.2% 11.3% 11.2%
10.5% 0% 5% 10% 15% 20% 25% 0 100,000 200,000 300,000 400,000 500,000 600,000 700,000 800,000 900,000
2007 2008 2009 2010 2011 2012 2013 2014 2015 2016
Perc en ta ge o f all exa m en tries N u m b er en tries
Entry level Level 1/2 - GCSE
Level 1/2 - Graded exam Level 1/2 - All other level 1/2 qualifications Level 3 - AS/A level Level 3 - Graded exam
28
Entries to non-arts subjects at Key Stage 4
Trends in entries to non-arts qualifications vary for different subjects. The proportion of all entries which are in science and English have increased notably since 2011 and 2013 respectively. History and geography have also experienced increases since 2011 and 2012 respectively, following periods of decline. This is likely to be an effect of the EBacc and of the EBacc element of Progress 8, as pupils have the option to take either history or geography in order to fulfil one of the EBacc components.
In contrast, the proportion of entries to modern foreign languages increased each year between 2008 and 2013, but has since fallen. The increase of 0.5 percentage points between 2012 and 2013 may be linked with the EBacc, as the 2013 cohort was the first to have selected their Key Stage 4 options under the EBacc. The subsequent decline is likely to be linked in part to the perception amongst pupils and schools that language GCSEs are more difficult than other options: a survey of teachers conducted in autumn 2015 found that by far the two most commonly cited barriers to take-up were the reluctance of some ptake-upils to take a language, and the fact that GCSE language exams are not appropriate for all pupils. Written comments submitted by respondents emphasised that languages were regarded as too difficult for lower attaining pupils and more challenging than other subjects.32 The need for substantially more modern foreign language teachers in order to fulfil the
EBacc has also been highlighted as a significant issue.33
The proportion of entries to physical education has been falling since 2013, whilst the figure for religious studies has declined steadily throughout most of the decade. Neither of these subjects are part of the EBacc.
32 T. Tinsley and K. Board, Language Trends 2015/16: The state of language learning in primary and secondary schools in England, British Council, April 2016, pp.104-108:
https://www.britishcouncil.org/sites/default/files/language_trends_survey_2016_0.pdf.
33 R. Allen, ‘Revisiting how many language teachers we need to deliver the EBacc’, Education DataLab, March
29
Figure 2.12: Percentages of all entries in non-arts subjects, 2007-16
Subject 2007 2008 2009 2010 2011 2012 2013 2014 2015 2016
Business studies/economics 2.1 1.9 2.0 1.9 2.0 2.0 2.1 2.2 2.3 2.2
English 21.1 19.4 18.7 18.0 17.0 16.4 16.2 16.8 18.2 18.9
Geography 3.1 2.7 2.6 2.5 2.4 2.4 3.0 3.3 3.5 4.0
History 3.5 3.1 3.0 2.9 2.9 3.0 3.5 3.8 3.9 4.4
ICT/computing 7.1 6.7 6.7 6.9 7.3 7.5 7.1 7.2 6.3 6.3
Maths 12.2 11.7 12.0 12.1 11.8 11.4 10.9 10.9 11.1 11.3
Modern foreign languages 5.8 5.3 6.0 6.5 7.0 7.2 7.7 7.6 6.9 6.2
Physical education 4.0 3.9 4.1 4.1 4.1 4.2 4.2 3.9 3.6 3.4
Religious studies 7.3 6.7 6.6 6.4 6.2 6.1 6.0 6.1 5.8 5.5
Science34 12.5 18.4 18.1 18.0 17.7 18.0 18.7 19.6 20.8 21.7
Arts 8.2 7.4 7.2 7.0 7.0 7.2 7.3 7.3 7.3 6.9
34 The large increase in the proportion of science entries in 2008 is due to the introduction of additional
30
Part 3: Entries to arts subjects by region
Summary
There is a clear and consistent North-South divide in entries to arts subjects, with Southern regions showing higher entry rates than Northern regions.
In 2016, the North East experienced a particularly sharp drop in arts entries. The
proportion of pupils entering at least one arts subject now ranges from 57.3 per cent in the South West to 47.8 per cent in the North East, a gap of 9.5 percentage points.
Entries to arts subjects by region
In general over the past decade, Southern regions have consistently had a higher percentage of arts entries and a higher percentage of pupils entering at least one arts subjects than have Northern areas. Until 2015, regional disparities in the percentage of entries in arts subjects were generally narrowing over the decade, but in 2016 the North East experienced a drop of 1.2 percentage points, substantially more than the decline evident in any other region.
In terms of the proportion of pupils entering at least one arts subject, the differences between regions have fluctuated over the past ten years. Again, the drop for the North East, at 6.1 percentage points, was substantially higher in 2016 than for any other part of England. This means that there is now a gap of 9.5 percentage points between regions with the highest and lowest proportions of pupils entering at least one arts subject at Key Stage 4, ranging from 57.3 per cent in the South West to 47.8 per cent in the North East.
31 5.5% 6.5% 7.5% 8.5% 9.5%
2007 2008 2009 2010 2011 2012 2013 2014 2015 2016
Perc en ta ge e n tries
North East England
5.5% 6.5% 7.5% 8.5% 9.5%
2007 2008 2009 2010 2011 2012 2013 2014 2015 2016
Perc en ta ge e n tries
North West England
5.5% 6.5% 7.5% 8.5% 9.5%
2007 2008 2009 2010 2011 2012 2013 2014 2015 2016
Perc en ta ge e n tries
Yorkshire and the Humber England
5.5% 6.5% 7.5% 8.5% 9.5%
2007 2008 2009 2010 2011 2012 2013 2014 2015 2016
Perc en ta ge e n tries
East Midlands England
5.5% 6.5% 7.5% 8.5% 9.5%
2007 2008 2009 2010 2011 2012 2013 2014 2015 2016
Perc en ta ge e n tries
West Midlands England
5.5% 6.5% 7.5% 8.5% 9.5%
2007 2008 2009 2010 2011 2012 2013 2014 2015 2016
Perc en ta ge e n tries East England 5.5% 6.5% 7.5% 8.5% 9.5%
2007 2008 2009 2010 2011 2012 2013 2014 2015 2016
Perc en ta ge e n tries
Inner London England
5.5% 6.5% 7.5% 8.5% 9.5%
2007 2008 2009 2010 2011 2012 2013 2014 2015 2016
Perc en ta ge e n tries
Outer London England
5.5% 6.5% 7.5% 8.5% 9.5%
2007 2008 2009 2010 2011 2012 2013 2014 2015 2016
Perc en ta ge e n tries
South East England
5.5% 6.5% 7.5% 8.5% 9.5%
2007 2008 2009 2010 2011 2012 2013 2014 2015 2016
Perc en ta ge e n tries
South West England
32 45% 50% 55% 60% 65%
2007 2008 2009 2010 2011 2012 2013 2014 2015 2016
Perc en ta ge o f p u p ils
North East England
45% 50% 55% 60% 65%
2007 2008 2009 2010 2011 2012 2013 2014 2015 2016
Perc en ta ge o f p u p ils
North West England
45% 50% 55% 60% 65%
2007 2008 2009 2010 2011 2012 2013 2014 2015 2016
Perc en ta ge o f p u p ils
Yorkshire and the Humber England
45% 50% 55% 60% 65%
2007 2008 2009 2010 2011 2012 2013 2014 2015 2016
Perc en ta ge o f p u p ils
East Midlands England
45% 50% 55% 60% 65%
2007 2008 2009 2010 2011 2012 2013 2014 2015 2016
Perc en ta ge o f p u p ils
West Midlands England
45% 50% 55% 60% 65%
2007 2008 2009 2010 2011 2012 2013 2014 2015 2016
Perc en ta ge o f p u p ils East England 45% 50% 55% 60% 65%
2007 2008 2009 2010 2011 2012 2013 2014 2015 2016
Perc en ta ge o f p u p ils
Inner London England
45% 50% 55% 60% 65%
2007 2008 2009 2010 2011 2012 2013 2014 2015 2016
Perc en ta ge o f p u p ils
Outer London England
45% 50% 55% 60% 65%
2007 2008 2009 2010 2011 2012 2013 2014 2015 2016
Perc en ta ge o f p u p ils
South East England
45% 50% 55% 60% 65%
2007 2008 2009 2010 2011 2012 2013 2014 2015 2016
Perc en ta ge o f p u p ils
South West England
33
Part 4: Entries to arts subjects by school characteristics
Summary
The median percentage of pupils entering at least one arts subject was lower at state-funded schools than at independent schools each year between 2008 and 2011; this pattern has been reversed since 2012. In 2016, the figure for state-funded schools was 3.6 percentage points higher than for independent schools (51.3 per cent compared with 47.6 per cent).
There is much greater variation in arts entries at school level in the independent sector than there is in the state sector.
In general, there is little variation in arts entries between different school cohort sizes.
State-funded and independent schools
Using school level data to compare state-funded schools with independent schools, it is evident that the median proportion of entries to arts subjects has been slightly lower at state schools each year since 2008; this gap increased in 2014 and stood at 1.3 percentage points in 2015, before narrowing to 0.2 percentage points in 2016 due to a drop in the figure for independent schools. Throughout the past decade, there has been much more variation in the independent sector, with the difference between its schools at the 25th and 75th percentiles much higher than for state-funded schools.
Again comparing the median, the percentage of pupils entering at least one arts subject was lower for state-funded schools than for independent schools each year between 2008 and 2011, but has been higher since 2012. In 2016, the difference was 3.6 percentage points (51.3 per cent in state-funded schools, compared with 47.6 per cent in independent schools). Again, the variation
34
Figure 4.1: Percentage of entries to arts subjects, by school type, 2007-16
Figure 4.2: Percentage of pupils with at least one arts entry, by school type, 2007-16
School cohort size
There is no clear link between school cohort size and entries to arts subjects. For the most part, there is little variation by school cohort size in the median percentage of arts entries or the median percentage of pupils entering at least one arts subject. For clarity and ease of comparison, the charts
0% 2% 4% 6% 8% 10% 12% 14% St ate -fun d ed In d ep en d en t St ate -fun d ed In d ep en d en t St ate -fun d ed In d ep en d en t St ate -fun d ed In d ep en d en t St ate -fun d ed In d ep en d en t St ate -fun d ed In d ep en d en t St ate -fun d ed In d ep en d en t St ate -fu n d ed In d ep en d en t St ate -fun d ed In d ep en d en t St ate -fun d ed In d ep en d en t
2007 2008 2009 2010 2011 2012 2013 2014 2015 2016
Perc en ta ge o f all en tries
Lower quartile to median Median to upper quartile
25% 30% 35% 40% 45% 50% 55% 60% 65% 70% 75% St ate -fun d ed In d ep en d en t St ate -fun d ed In d ep en d en t St ate -fun d ed In d ep en d en t St ate -fun d ed In d ep en d en t St ate -fun d ed In d ep en d en t St ate -fun d ed In d ep en d en t St ate -fun d ed In d ep en d en t St ate -fu n d ed In d ep en d en t St ate -fun d ed In d ep en d en t St ate -fun d ed In d ep en d en t
2007 2008 2009 2010 2011 2012 2013 2014 2015 2016
35
below focus specifically on schools with small cohorts (between 60 and 89 pupils in a year group), medium cohorts (between 150 and 179 pupils), and large cohorts (240 or more pupils in a year group). Tables showing the figures for schools with a full range of cohort sizes can be found in Annex 3.
Figure 4.3: Percentage of entries to arts subjects, by school cohort size, 2007-16
Figure 4.4: Percentage of pupils with at least one arts entry, by school cohort size, 2007-16
5.0% 5.5% 6.0% 6.5% 7.0% 7.5% 8.0% 8.5% 9.0% 9.5% 10.0%
2007 2008 2009 2010 2011 2012 2013 2014 2015 2016
Perc
en
ta
ge
o
f
all
en
tries
Small cohorts Medium cohorts Large cohorts
45% 50% 55% 60% 65%
2007 2008 2009 2010 2011 2012 2013 2014 2015 2016
Perc
en
ta
ge
o
f
p
u
p
ils
36
Part 5: Entries to arts subjects by pupil attainment
Summary
Before 2013, pupils with high prior attainment were more likely than those with medium or low prior attainment to enter at least one arts subject. This pattern has since been reversed, and those with medium or low prior attainment are now more likely to have at least one arts entry. In 2016, the gap was 3.5 percentage points (54.4 per cent for pupils with medium and low prior attainment, compared with 50.9 per cent for those with high prior
attainment).
The proportion of pupils with at least one arts entry has been falling since 2011 for those with high prior attainment, and since 2014 for those with medium or low prior attainment.
This could be because high attaining pupils were the first to be encouraged by their schools to enter the EBacc. In contrast, those with medium or low prior attainment may have initially been guided towards arts subjects, away from vocational qualifications, which the Coalition Government committed to reform soon after taking office. More recently, these pupils may have shifted away from arts subjects as schools focus on ensuring that they fulfil the EBacc element of Progress 8, even if they do not take the full set of EBacc subjects.
Pupils who do not enter the EBacc are more likely to take at least one arts subject than those who do fulfil its requirements. In 2016, this gap stood at 7.3 percentage points (56.5 per cent for pupils who do not enter the EBacc, compared with 49.2 per cent for those who do). Therefore, although EBacc entrants are less likely to take an arts subject, nearly half of them nevertheless do so.
Prior attainment
Arts entries have consistently made up a higher percentage of all entries for pupils with medium or low prior attainment than for their peers with high prior attainment. This gap widened between 2011 and 2015, due both to increases in the figure for pupils with medium and low prior attainment and to decreases in the figure for pupils with high prior attainment. In 2016, it narrowed slightly because the proportion of arts entries for pupils with medium and low prior attainment fell by more than for those with high prior attainment, although the gap still stands at 1.2 percentage points. Part of the reason for this gap is that pupils with low and medium prior attainment enter fewer
qualifications overall,35 meaning that the arts make up a higher proportion of their total entries if
they do take an arts subject than is the case for those with high prior attainment.
For pupils entering at least one arts subject, the pattern has been slightly different. Until 2013, pupils with high prior attainment were more likely to have at least one arts entry, but this pattern
35 Department for Education, ‘Revised GCSE and equivalent results in England, 2015 to 2016’, January 2017,
p.6:
37
has been reversed in more recent years, and in 2016 the magnitude of the gap was almost the same as it was in 2007, but with pupils with high prior attainment less likely to have at least one arts entry (50.9 per cent) than their peers with medium or low prior attainment (54.4 per cent).
The proportion of pupils with high prior attainment entering at least one arts subject has been declining each year since 2011, and by 2016 was substantially lower than at the start of the decade. This may