1
EVALUATION OF IMMUNOGLOBULIN G
COMPLEXED FORM OF THYROID
STIMULATING HORMONE [MACRO TSH] AS
INTERFERENCE IN TSH ASSAY
Dissertation Submitted to
THE TAMILNADU DR. M.G.R. MEDICAL UNIVERSITY
In partial fulfilment of the requirements
For the award of degree of
M.D. (Branch-XIII)
BIOCHEMISTRY
GOVERNMENT STANLEY MEDICAL
COLLEGE & HOSPITAL
THE TAMILNADU DR. M.G.R. MEDICAL UNIVERSITY,
CHENNAI, TAMILNADU
2
CERTIFICATE
This is to certify that the dissertation titled,
“EVALUATION OF
IMMUNOGLOBULIN G COMPLEXED FORM OF THYROID
STIMULATING HORMONE [ MACRO TSH] AS INTERFERENCE
IN TSH ASSAY” is a genuine work done by Dr. C.ARCHANA DEVI
for the partial fulfillment of the requirements for M.D (Biochemistry)
Branch XIII Examination of The Tamil Nadu Dr. M.G.R. Medical
University to be held in April 2018, during the academic period
2015-2018.
P
rof.Dr.S.PonnambalaNamasivayam
MD.,D.A.,D.N.B.,Dean Professor & HOD
Stanley Medical College &Hospital, Department of Biochemistry
Chennai – 1. Stanley Medical
College&Hospital,
3
CERTIFICATE BY GUIDE
This is to certify that the dissertation on
“
EVALUATION OF
IMMUNOGLOBULIN G COMPLEXED FORM OF THYROID
STIMULATING HORMONE [ MACRO TSH] AS INTERFERENCE
IN TSH ASSAY
”
is a record of research work done by
Dr.C.ARCHANA
DEVI
in
partial
fulfilment
for
M.D
(BIOCHEMISTRY) Examination of The Tamil Nadu Dr. M.G.R.
Medical University to be held in April 2018. The period of study is
from
January 2017 to June 2017
.
Prof.
Dr.R.SHANTHI
M.D., D.C.P.,Department of Biochemistry,
4
DECLARATION
I,
Dr.C.ARCHANA DEVI, solemnly declare that the
dissertation titled
“EVALUATION OF IMMUNOGLOBULIN G
COMPLEXED FORM OF THYROID STIMULATING HORMONE
[MACRO TSH] AS INTERFERENCE IN TSH ASSAY” is a bonafide
work done by me during the period of JANUARY 2017 to JUNE 2017 at
Government Stanley Medical College and Hospital, Chennai under the
expert guidance of Prof.
Dr.R.SHANTHI M.D., D.C.P., Department
Of Biochemistry, Government Stanley Medical College and Hospital,
Chennai.
This thesis is submitted to The Tamil Nadu Dr. M.G.R. Medical
University in partial fulfillment of the rules and regulations for the M.D.
degree examinations in Biochemistry to be held in April 2018.
Chennai-1
5
ACKNOWLEDGEMENTS
First and foremost, I thank the Almighty. Without Him nothing
would have been possible. With God’s Grace, everything is possible.
I
wish
to
express
my
sincere
thanks
to
PROF.DR.S.PONNAMBALA
NAMASIVAYAM,
MD.,D.A.,D.N.B.,Dean, Government Stanley Medical College and Hospital for having
permitted me to utilize the facilities of the hospital for the conduct of the
study.
My heartfelt gratitude to
Prof. Dr.R.SHANTHI M.D., D.C.P.,
for her constant encouragement, immense support, valuable and
constructive suggestions, corrective comments and expert supervision.
My heartfelt gratitude to
Prof.Dr.M.P.SARAVANAN, M.D.,
for
his motivation ,valuable suggestions , expert guidance and immense
support.
6
I wish to thank all Assistant Professors especially for their aid,
keen interest, encouragement and corrective comments during the
research period.
I express my sincere thanks to my postgraduate colleagues for their
enthusiasm and involvement for completing this study.
I thank all the staffs and technicians, Government Stanley Medical
College and Hospital for their cooperation and assistance.
I am indebted to my parents for their care and moral support
during the period of my study.
I thank my husband and my kids SAMEERA and PRANAV for
their patience and moral support during the period of my study, without
which it would be difficult for me to complete this study.
7
INDEX
S.No
Contents
Page. No
1.
Introduction
10
2.
Review of Literature
14
PT -TSH regulation
19
Hypothyroidism
23
Misleading TSH value
27
Macro TSH – an overview
36
3.
Aim and Objectives
45
4.
Materials and Methods
47
5.
Statistical Analysis & Results
69
6.
Discussion
84
7.
Summary
89
8.
Conclusion
92
ANNEXURES
i.
Bibliography
ii.
Master chart
iii.
Proforma
iv.
Consent form
8
ABBREVIATIONS
TSH – Thyroid stimulating thyroxine
Tg – thyroglobulin (Tg)
PT TSH – pars tuberalis Thyroid stimulating hormone
PD TSH – pars distalis Thyroid stimulating hormone
LD – Long-day (LD) stimulus
TRβ2 – thyroid hormone receptor
MBH – mediobasal hypothalamus
TRH – thyroid releasing hormone
TRHR – thyroid releasing hormone receptor
MTI - melatonin receptors
HAMA – Human anti‐
mouse monoclonal antibody
RA – Rheumatoid factor
HAb – Heterophile antibodies
IMA – immunometric assays
NABs – naturally occuring antibodies
PEG – poly ethylene glycol
TPA – tripropylamine
TPA – tripropylamine
9
10
INTRODUCTION
Thyroid disorder is one of the most common disease among all endocrine disorders. Measurement of Serum Thyroid Stimulating Hormone (TSH) concentrations are made in most of the laboratories, mainly to screen for primary hypothyroidism. Prevalence of hypothyroidism in the general population ranges from 3.8% - 4.6%. 1 Another epidemiology study in the Indian population suggested the overall prevalence of hypothyroidism to be 10.95%. 2 A follow up survey to determine the incidence and natural history showed an annual incidence of hypothyroidism of 4.1 per 1000 survivors per year in women and 0.6 per 1000 survivors per year in men. 3. Studies have suggested that subclinical hypothyroidism has a prevalence of 4 to 10% in the general population and the prevalence is found to increase with age and also females more than 45yrs of age have more preponderance. 50. It has been estimated that about 42 million people in India suffer from thyroid diseases. 4
11
its reliability is very important. There are also a number of incidences where TSH values may not correlate with the patient ‘s clinical features. Not all high TSH values are due to true elevation of thyroid stimulating hormone, there are number of causes of interference in thyroid hormone assay. The potential interferences are cross reactivity, drugs, antibodies and macrocomplexes.
Cross reactivity occurs when some endogenous molecules have a similar structure to the measuring analyte, for example TSH and HCG carries an analogue alpha chain that can cause interference. With development of specific monoclonal antibodies cross reactivity has been almost eliminated from modern assays. Other causes of interference include drugs, antibodies and macrocomplexes .5 . Antibodies which may cause interference in thyroid assay includes HAMA [human anti mouse antibodies], heterophile antibody and rheumatoid factors. However these interferences can be minimised by treating the sample with blocking agents and performing the assay. The occurrence of macrocomplexes is well known with hormones and enzymes like prolactin (macroprolactin), creatine kinase (macrocreatine kinase) and amylase (macro amylase). Recently, cases have been reported with unexplained high TSH values, but clinically euthyroid and they were found to have macro TSH. Prevalence of macro TSH varies from 0.6 to 0.79% 5. The prevalence of macro-TSH in patients with latent hypothyroidism is 1.62% 6.
12
immunoglobulin G. The molecular weight of TSH is approximately 30 kDa and it is easily filtered by kidney, but on combining with an immunoglobulin (IgG) molecule, the molecular weight of this large complex increases to approximately to 200 kDa, which bypasses its filtration by the kidney and leads to accumulation of macroTSH in the serum. 8. This can cause misleading high values. These macro hormones are biologically inert and lack hormonal activity so, it is assumed that practically no treatment is needed 7. But the patients may be subjected to thyroid replacement therapy due to spurious elevation of serum TSH values and can even end up in thyrotoxic state.
13
14
REVIEW OF LITERATURE
THYROID GLAND – An overview
ANATOMY
15
16
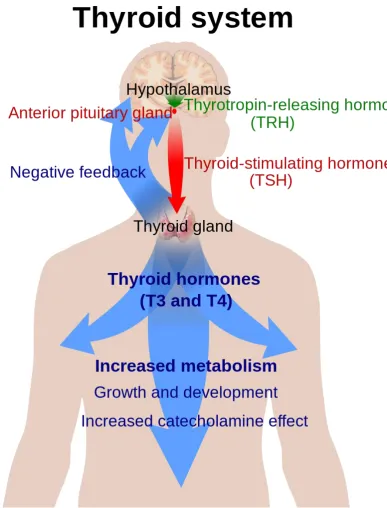
FUNCTIONS OF THYROID HORMONE:
Some of the important biological effect of thyroid hormone are :
it controls basal metabolic rate
required for normal growth and neural development
increases adrenergic activity thus increasing heart rate and myocardial
contraction
helps in carbohydrate metabolism and protein synthesis
increase the synthesis and degradation of cholesterol and triglycerides
enhances calcium and phosphorus metabolism
increases the sensitivity of adrenergic receptors to catecholamines
PHYSIOLOGY
17
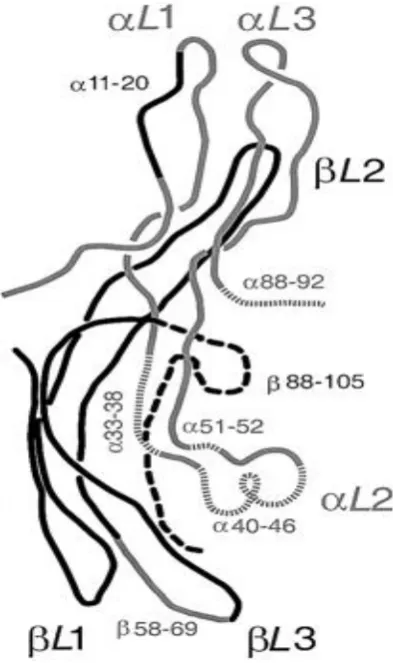
FIG 2: STRUCTURE OF of hTSH . The α-subunit is shown in grey line, and the β-subunit chain is depicted in black line. . The peripheral β-hairpin loops are as: αL1, αL3 in the α-subunit; βL1, βL3 in the β-subunit.
18
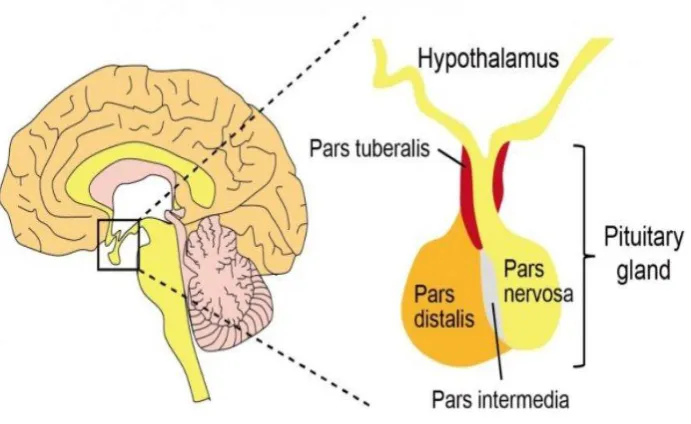
[image:18.595.117.463.395.607.2]gland is made up of three lobes: the anterior, intermediate, and posterior lobes. The anterior lobe of pituitary has pars tuberalis [PT], pars distalis [PD] and pars intermedia. The pars distalis of pituitary gland is responsible for synthesis and secretion of TSH -PD which are positively regulated by hypothalamic thyrotropin – releasing hormone [TRH]. Thyroid stimulating hormones secreted from pars distalis of the pituitary 17 act predominantly through thyroid hormone receptor (TRβ2) on thyrocytes to synthesis and release thyroid hormones[TH]. The circulating thyroid hormone formed inturn inhibits PD-TSH by negative feedback mechanism 15.
19
PT -TSH regulation
PT-TSH is independent of TRH regulation
TSH secreted from pars tuberalis of the pituitary gland plays an important role in regulating seaonality.18, 19, 20. The changes in day length regulates some of our physiological activities, like reproduction and migration. Long-day (LD) stimulus induces the production of PT-TSH. This PT- TSH acts on TSHR found in ependymal cells of mediobasal hypothalamus (MBH), which in turn causes expression of Dio2 gene. Dio2 gene encodes for type 2 deiodinase. The action of type 2 deiodinase enzyme is that it activates TH and converts the thyroxine (T4) to bioactive triiodothyronine (T3) within the MBH,
which serves as a key factor for regulation of seasonality. 21
Tissue specific glycosylation imparts specificity to TSH
Thus in contrast to PD-TSH, the PT-TSH does not take part in regulation of TSH ,the reason behind this is that PT cells lack TRH receptor (TRHR) 22. But the PT is found to have melatonin receptors [MTI] which is not found in PD 23. Eyes receive photoperiodic information and transmits it to pineal gland
24. Pineal gland plays a major role in secretion melatonin in the night which acts
20
.
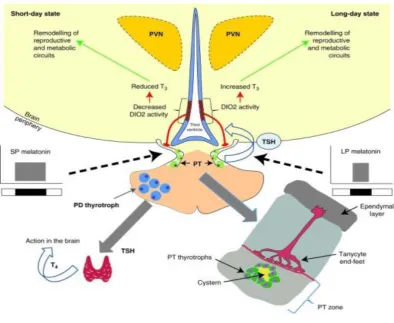
FIG 4: Action of PT TSH. Photoperiodic information is encoded by the nocturnal melatonin signal generating signals in response to (long) summer
day lengths. The prim site of action is the pituitary pars tuberalis. LD
activates TSHβ leading to increase in deiodinase 2 activity in adjacent
ependymal cells (tanycytes), which has TSH receptor. Thus LD leads to
increase of T3, via conversion from T4 to T3 switch now acts on
[image:20.595.108.503.146.469.2]21
of the PT does not have TRH receptor, therefore cannot be regulated by a
hypothalamic peptide (TRH).
PT-TSH shows less bioactivity :
PT thyrotrophs distinct from PD thyrotrophs
PT thyrotrophs were distinct from PD thyrotrophs which was revealed by a series of electron microscopic analyses 26, 27 and the TSH concentration inside PD was ~10,000 times greater than that of PT. PD thyrotrophs have large amount of dense secretory granules, when compared with PT thyrotrophs which has only a lesser amount of granules. PT thyrotrophs has a well-formed Golgi apparatus with numerous microvesicles, and lesser amount of secretory granules, that mimics PD thyrotrophs of thyroidectomized rat 28, 29. The different regulatory mechanisms of PD-TSH and PT-TSH was taken into account for controlling source of TSH in the circulation. Thus, PT thyrotrophs causes release TSH 30, 31 and because serum T4 concentration has to increase in
response to TSH , serum T4 level was measured. But in contrast serum T4 levels was not affected by differences in serum TSH, suggesting that
22
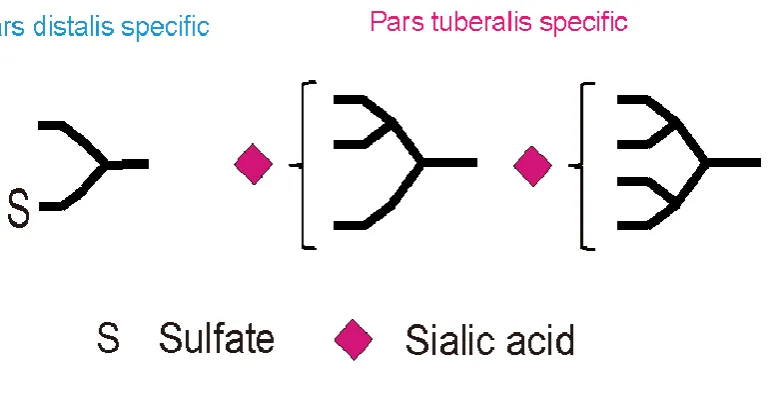
Differential glycosylation of the two TSHs:The molecular weights of PT-TSH was around ~40 kDa and that of PD-TSH was ~37 kDa 15. Differential glycosylation of TSH was one the main reason for the difference in their molecular weight. In PD TSH, glycans were mainly biantennary and sulfated complexes 32. Though PT-TSH shares few of these biantennary N-glycans, tetra-antennary and tri-antennary multi-branched N-glycans linked together with sialic acid were also found in the PT. Because negatively charged sulfates affect the intensity of the positive-ion mass, spectrograph 32 quantitation of N-glycan is relatively difficult. The tissue-specific expression of glycosyltransferases causes the difference in oligosaccharides between PD- and PT-TSH. This tissue specific glycosylation of PT is the cause of the low bioactivity of PT-TSH in the peripheral circulation [15]. This TSH can bind to serum immunoglobulin (IgG) to form a higher molecular-weight complex known as “macro-TSH” which has little bioactivity in humans and rats [33].
23
FIG 5: .STRUCTURE OF PD - TSH AND PT- TSH.
PD TSH , glycans were mainly biantennary and sulfated complexes
PT-TSH. tetra-antennary and tri-antennary multi-branched N -glycans linked together with sialic acid
HYPOTHYROIDISM
Hypothyroidism is a very common thyroid disorder due to thyroid hormone deficiency, which can be easily diagnosed and managed, but can be potentially fatal when left untreated. It is found in 2% to 15% of the population among which women are more frequently affected than men. The statistical reference ranges of the relevant biochemical parameters plays a crucial role in defining hypothyroidism.
24
Primary hypothyroidism
Central hypothyroidism
PRIMARY HYPOTHYROIDISM
25
disease. Primary hypothyroidism is most commonly associated with circulating antithyroid antibodies which can be found in coexistence with other diseases in
which autoantibodies are present. In addition, primary hypothyroidism can be one of the manifestation of an autoimmune syndromes. Thus impaired T3, and T4, leading to increased secretion of pituitary TSH cause remarkable increase in serum TSH concentrations. Hence elevated concentration of TSH is an important laboratory finding in the early detection of thyroid disorders.
CENTRAL HYPOTHYROIDISM
26
administration. In patients with hypothalamic defect the peak TSH response to TRH can be normal, but can have a delay 45 or 60 minutes after the TRH administration when compared to the usual time of 20 to 30 minutes.
SUBCLINICAL HYPOTHYROIDISM
Subclinical hypothyroidism has serum thyroid-stimulating hormone (TSH) level above the upper limit of normal inspite of normal levels of serum free thyroxine 78.
27
CLINICAL SYMPTOMS
The most common symptoms in adults are tiredness, lethargy, cold intolerance, constipation, horseness of voice, weight gain, and dry skin. Sometimes the symptoms are vague and generalized that they can be missed.
Thus statistical reference ranges of biochemical parameters like TSH plays a crucial role in defining hypothyroidism. The standard treatment is thyroid hormone replacement therapy with levothyroxine.
TSH MEASUREMENT.
Serum TSH as a single hormone , is one of the most sensitive index for detection of thyroid abnormalities 51. The current standard of care has even more improved with upcoming of automated immunochemiluminometric assays for TSH which are ultrasensitive 54. The assay has a sensitivity of 0.004 mIU/L.
Measurement of TSH plays a crucial role in newborn screening, work up of female infertility, in monitoring thyroid replacement therapy and in screening adults for other thyroid diseases.
Misleading TSH value
:28
Biological factors are :
Unstable thyroid status When the thyroid hormone replacement therapy
is suboptimal or in case of poor patient’s compliance there is a lag in resetting of pituitary TSH, during such period there is TSH instability which can be misleading.
TSH secreting tumours like adenomas
Central hypothyroidism
Hypothalamic dysfunction
Resistance to thyroid hormone
Technical factors :
There are various interferences that can contribute to errors in the laboratory values. The effects of interferences like lipemia, hemolysis and bilirubinemia are well known for all assays. Immunoassays are mainly subjected to antigen-antibody interactions that alter and cause interference in the measurement of analyte.
29
antibodies to thyroglobulin,
antibodies to microsomal thyroid peroxidase,
antibodies to the TSH receptor ,
antibodies to T4 and T3 .
Antibodies against TSH
Technical factors due to endogenous antibodies are one of the most common causes of a false elevation TSH 52,53.
Antibodies can be:
Antibodies against assay antibodies eg. Heterophile antibody
Antibodies against analyte eg: macro TSH
Antibodies against signal molecules eg: anti-Rhuthenium antibodies.
Heterophile antibodies (HAbs).
30
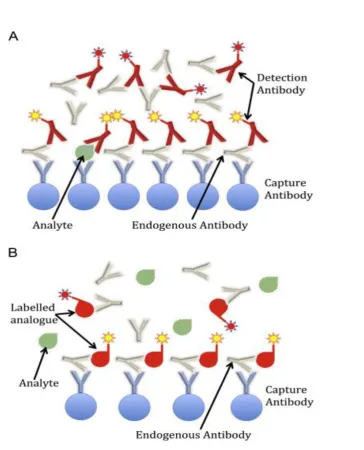
ENDOGENOUS ANTIBODIES CAUSING INTERFERENCE
[image:30.595.158.523.168.619.2]
31
[image:31.595.120.520.130.512.2]32
Heterophile antibodies (HAb), which are human poly-specific antibodies that targets against animal antigens,among which the human anti-mouse antibodies (HAMA) is most common one 57.HAMA is found to occur in 40% - 70% of patients treated with mouse monoclonal antibody and it can occur in 10 % of the general population. HAb can also target human antigens
58
33
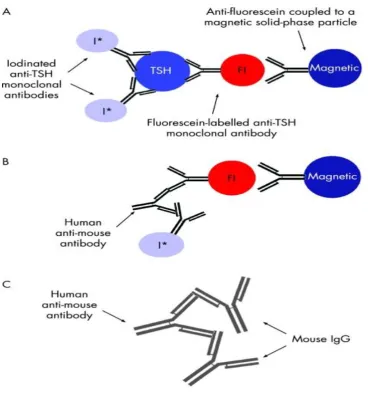
FIG 8: . HAMA interference in TSH assay.
[image:33.595.106.475.65.469.2]34
FIG 9: . INTERFERENCE OF HETEROPHILE ANTIBODY, SHOWS FALSE POSITIVE RESULTS IN SANDWICH ASSAY.
Anti-Reagent Antibody :
Some patients develop antibodies that are targeted against test reagents like Rhuthenium that cause interference with TSH . Anti rhuthenium antibodies is known to occur in areas of textile industries where rhuthenium was used for dying process of the cloth. It should also be considered that the anti-Rhuthenium antibodies of different patients may differ with each analyte to different degrees 63,64.
Antibodies against Streptavidin-Biotin:
[image:34.595.116.339.82.245.2]35
high dose of biotin ingestion are known to produce interference in TSH assay.67,68.
FIG 10 : . ENDOGENOUS ANTIBODIES
TSH Variants.
36
between TSH/FT4 values 70. These TSH genetic variants play a major role in occurence of congenital hypothyroidism 71.
MACRO TSH.
Macro TSH is one of the reason for misleading high TSH values . The prevalence of macro TSH is approximately 0.6 percent, but can be as high as ~1.6 percent in patients with subclinical hypothyroidism.
MACRO TSH – AN OVERVIEW
PT TSH which has tetra-antennary, tri-antennary multi-branched N-glycans linked with sialic acid which can conjugate with immunoglobulin, to form a complex of TSH – immunoglobulin G 15. Macro TSH is found to complex with immunoglobulin G molecules that are found to occur as naturally occurring antibodies [NABs], in contrast to the antibodies induced by exogenous antigen 34. Ig M is the primary immunoglobulin which produces NABs but Ig G is also known to produce NABs 35.PT TSH formed macro TSH mainly binds with Ig G 2b class of immunoglobulin 15. TSH is also know to form complexes with albumin 15.
Macro TSH is found to have:
High molecular weight.
37
Long half – life
Low bioactivity.
38
melatonin, which is a hormone secreted by the pineal gland during the night.
PT TSH which has a molecular weight of around ~40 kDa can conjugate with immunoglobulin G molecules to form a large complex of approximately 200 kda . This large molecular weight complex is not filtered by kidney which causes accumulation of macro TSH. The complex of TSH Ig - G is biologically inert but the immmunoreactive property is intact so it can be measurable which can give a false elevation of TSH values without the patient being symptomatic8.
The TSH Ig - G complex is found to be very stable and the PT TSH binds with the IgG for a longer time in the circulation. Acidification of macro TSH below pH 3 has been known to dissociate the macro-TSH complex in humans 36,37. But in contrast acidification of the stable mouse IgG-TSH complex does not dissociate the IgG-TSH complex.15 .
39
FSH has sialylated N-glycan and lacks the sulfate modification, which results in a long half-life of ~17 h 41. Likewise, sialylated TSH is excluded from specific receptor-mediated clearance from the liver 40. Therefore PT-TSH, which has multi-antennary sialylated N-glycans has a longer half-life than PD-TSH which is one of the main reason for the longer half life of macro PD-TSH. It was found that rodents and patients with hypothalamic hypothyroidism shows increased levels of circulating TSH with altered oligosaccharides 42,43.
Hypothalamic hypothyroidism can cause the appearance of multi-antennary N-glycans in circulating TSH 44. In thyroidectomized or thyroid tumor-induced hypothyroid mice sialylation and multi-antennary glycans were found to be increased, and sulfation to be reduced in circulating TSH 45,46. The gene encoding for α2–3 sialyltransferase also plays an important role in increasing sialylation of TSH during hypothyroidism 47.
VARIOUS METHODS FOR CONFIRMING INTERFERENCES ARE:
The assay can be repeated with an alternative immunoassay
platform, preferably using assay antibodies from a different species
Sample treatment with polyethylene glycol.
40
Serial dilution of the samples showing non linearity indicates assay
interference
PEG PRECIPITATION TEST
PEG is polyethylene glycol which is water soluble nonionic synthetic polymer with an empirical formula HOCH2(CH2OCH2)mCH2OH . This was
first introduced by polson et al in 1964 for precipitating proteins72.PEG precipitation is a very simple and cost effective method for screening antigen antibody interference that can be routinely be used in laboratories . PEG precipitates immunoglobulins G, A and M. This method can be used as a simple screening test for patients suspected to have macro TSH .
41
MECHANISH OF ACTION OF PEG
There is a positive perturbations of the chemical potentials of the proteins on adding PEG , there is an interactions between PEG and proteins in aqueous medium which is repulsive in nature and this repulsion becomes stronger as the molecular size of PEG increases 74. Such an unfavourable interaction can be relieved by the formation of interprotein contacts which can reduce the surface area of protein that are exposed to the solvent and thus can reduce the interactions. This can be achieved by either protein self association or precipitation 73.
POLYMER EFFECT
Steric exclusion explains effect of polymers on protein solubility.
• - Assuming total volume of solvent occupied by polymer and protein
• – volume occupied by polymer ( excluded volume not occupied by protein)
42
Increased Ve caused by increase in number or size polymer will decrease V ´and effective increase in concentration of protein molecule. Probability of collision and self association increased and large insoluble aggregates formed.
PEG is used for separation of free hormones from those bound to antibodies thus, helping as a screening tool for detecting macro TSH. Samples with a recovery less than 25% using PEG precipitation method are considered to have antigen antibody interferences .
PROTEIN G ADDITION TEST
Samples with recovery less than 25% are further subjected to protein G addition test. Protein G agarose gel absorbs only IgG complexed form of TSH, so removes most of the TSH which exist in the form of macro TSH which is mostly immunoglobulin G complexed form of TSH
43
FIG 12: . Adding PEG to the serum of a subject with Macro-TSH (A1) causes the precipitation of Macro-TSH complexes, while unbound enzymes stay in
supernatant (A2). The supernatant measured for TSH values in ECLIA.
44
45
AIM AND OBJECTIVES
AIM:
To evaluate the interference of immunoglobin G complexed form of thyroid stimulating hormone [ macro TSH] in TSH assays.
OBJECTIVES:
TSH more than 10 µIU /mL and FT4 within normal range [0.8 -2.7ng/dl], are evaluated for analyte –antibody interference by PEG precipitation method.
46
47
MATERIALS AND METHODS
This study was conducted in government Stanley medical college hospital to evaluate immunoglobulin G complexed form of thyroid stimulating hormone [macro TSH] as interference in TSH assay.
STUDY CENTRE :
Government Stanley medical college hospital , Chennai -1
DURATION OF STUDY :
6 months (January 2017 to June 2017)
STUDY DESIGN:
Cross sectional study
INCLUSION CRITERIA:
Patients with TSH more than 10 mU/L and Free T4 within normal limits [0.8 -2.7ng/dl]
EXCLUSION CRITERIA:
48
SAMPLE SIZE
200.
STUDY PROCEDURE
samples from patients subjected to routine analysis of thyroid function
were scrutinised for TSH.
Patients with TSH more than 10 mU/L and Free T4 within normal limits
[0.8 -2.7ng/dl] were selected .
Informed consent was obtained from 200 patients.
Two aliquots of the each serum sample were taken.
One aliquot of the patient ‘s serum was subjected to PEG precipitation
test and other aliquot for protein G addition test.
Samples which had > 25% recovery was treated as true TSH elevation
which had no significant interference
Samples which had a recovery of < 25% by PEG precipitation test were
further subjected to protein G addition test.
Samples that showed remarkable decrease in TSH recovery after protein
49
METHOD
Sample collection and preparation
50
DETERMINATION OF SERUM TSH
REQUIREMENTS :
EQUIPMENT
Cobas e 411/601 Analyzer
Centrifuge
vortex mixer.
METHOD
Electro-chemiluminescence immunoassay (ECLIA) for in vitro quantitative determination of free thyroxine, and thyroid stimulating hormone in human serum were performed using Automated Cobas e411 Immunoassay Analyzers based on electrochemiluminescent technology using ruthenium complex and the measuring cell.
51
FIG 13: COBAS e 411 - ANALYSER
PRINCIPLE
The biotinylated monoclonal antibody, antigen of interest, and
monclonal antibody labeled with ruthenium complex form a sandwich complex
After adding streptavidin-coated microparticles this complex binds to
solid phase by interacting of biotin and streptavidin.
Microparticles are magnetically captured onto the surface of the
52
. Application of a voltage to the electrode induces chemiluminescent
emission which can be detected by a photomultiplier.
TEST PROCEDURE TSH IN ECLIA
Sandwich principle. Total duration of assay: 18 minutes.
1. First incubation:[ 9 mins]
50 uL of sample reacts with first biotinylated monoclonal TSH-specific antibody and then with second antibody monoclonal TSH-specific antibody labelled with a ruthenium complex. The two antibodies form a sandwich complex with the antigen or analyte of interest.
53
2. Second incubation:[ 9 mins]
After addition of streptavidin-coated microparticles, the streptavidin forms a strong bond with biotin .
FIG 15: The sandwich complex formed .
3. This complete immunoassay complex is now transferred to measuring cell. The magnet present here attracts the paramagnetic beads , thus binding the complex to the surface of the measuring cell.
[image:53.595.153.509.179.446.2]54
5. Electrodes present provides voltage which triggers the ECL reaction . Ruthenium and TPA gets excited.TPA serves as reductant. TPA enable ruthenium to reduce to its base state with release of light.
6. This cycle of electrochemiluminescence repeats as long as voltage is applied ,this results in amplification of light signals. The emitted light is detected by photomultiplier. The signal detected is directly proportional solution is to the concentration of the target analyte.
[image:54.595.112.485.346.645.2]
55
FIG 17 : TPA ENABLE RUTHENIUM TO REDUCE TO ITS BASE STATE WITH RELEASE OF LIGHT.
7. Results are determined with the help of a calibration curve which is instrument- specifically generated by 2- point calibration and a master curve provided by the reagent barcode.
REAGENT
TSH Elecsys from Roche Diagnostics
STORAGE AND STABILITY
[image:55.595.108.471.69.394.2]56
MEASURING RANGE
0.005-100 µIU/mL .
Values below the lower detection limit are reported as < 0.005 µIU/mL. Values above the measuring range are reported as > 100 µIU/mL (or up to 1000 µIU/mL for 10-fold diluted samples)
Functional sensitivity - 0.014 µIU/mL
[image:56.595.126.489.348.615.2]
57
FREE T4 ASSAY
Principle – Competitive assay
Total duration of assay: 18 minutes.
• 1st incubation: 15 µL of sample and a T4-specific antibody labelled with a ruthenium complex.[9 min]
• 2nd incubation: After addition of biotinylated T4 and streptavidin-coated microparticles, the still free binding sites of the labelled antibody become occupied, with formation of an antibody-hapten complex. The entire complex becomes bound to the solid phase via interaction of biotin and streptavidin.[9 min]
• The reaction mixture is aspirated into the measuring cell where the microparticles are magnetically captured onto the surface of the electrode. Unbound substances are then removed with Procell. Application of a voltage to the electrode then induces chemiluminescent emission which is measured by a photomultiplier.
58
REAGENT
Free T4 from Roche Diagnostics
STORAGE AND STABILITY
Stability
Unopened at 2 to 8 °C – upto stated expiry date
After opening at 2 to 8 °C – 12 weeks
On the analyser – 8 weeks
Store at 2 to 8 °C
Do not freeze.
Store the Elecsys reagent kit upright in order to ensure complete availability of the microparticles during automatic mixing prior to use.
LIMITS AND RANGES
RANGE FREE T4 TSH
MEASURING RANGE 0.101-7.77 ng/Dl 0.005-100.0 mlU/L
59
Measuring range for FT4
0.101-7.77 ng/dL
Values below the Limit of Quantitation are reported as < 0.101 ng/dL
Values above the measuring range are reported as > 7.77 ng/dL .
Functional sensitivity = 0.101 ng/dL
REFERENCE RANGE: TSH
Birth to 4 days: 1 - 39 mIU/ml
- 4.2 mIU/ml
I trimester : 0.3 - 4.5 mIU/ml
II trimester : 0.5 - 4.6 mIU/ml
60
CALIBRATION
Calibration performed once per reagent lot using fresh reagent . Two set of two levels of calibrators CAL 1 and CAL 2 are provided in separate kit for each analyte.
61
QUALITY CONTROL MATERIAL
62
CENTRIFUGE MINI SPIN.[Eppendorf]
Mini centrifuge was used for separation of serum after PEG precipitation
and protein G addition test
the main switch is turned on and lid is opened
rotor was loaded symmetrically
for PEG precipitation test mixture was centrifuged for 5min at 13,400
rotations per minute
for protein G addition test the mixture was centrifuged at 12000 g for
5min
POLYETHYLENE GLYCOL[PEG] PRECIPITATION METHOD
TSH values of more than 10 mU/L and FT4 within normal limits are evaluated by PEG precipitation method.
PRINCIPLE
PEG precipitation method is a simple procedure for precipitating immunoglobulins G, A and M from the serum. Precipitation of PEG is based on polymer effect and steric exclusion effect.
63
• - Assuming total volume of solvent occupied by polymer and protein
• – volume occupied by polymer( excluded volume not occupied by protein)
• – volume occupied by protein
64
PROCEDURE
PEG precipitation was used as a simple method of precipitating immunoglobulins G, A and M [5].
1. A 25% solution of PEG 6000 was prepared in deionised water.
2. A 0.2mL of serum aliquot was added to 0.2mL of the 25% PEG 6000 solution (TSH.PEG).
3. To 0.2mL of deionized water, 0.2mL of the 25% PEG 6000 solution was added (TSH.H2O) as a control.
4. The samples were vortex mixed and incubated for 10min at room temperature.
5. Then the mixture was centrifuged for 5min at 13,400 rotations per minute.
65
FIG 20: PEG PRECIPITATION TEST – The supernatant and precipitate can be observed.
8.The percentage recovery of TSH following PEG precipitation was calculated .
TEST PEG SERUM DEIONISED
WATER
CONTROL 0.2mL _ 0.2Ml
[image:65.595.207.462.70.301.2]66
CALCULATION:
PROTEIN G ADDITION TEST
The samples with recovery of less than 25 % were further treated with protein G addition test for confirming the presence of IgG complex TSH. Samples showing remarkable decrease in protein G addition test suggested immunoglobulin G form of TSH.7
PRINCIPLE
Protein G agarose gel absorbs Ig G complexed form of TSH. Therefore the macroTSH which mainly occurs in the form Ig G complexed TSH are absorbed by protein G addition test.
PROCEDURE
1. Protein G agarose was used for absorption of serum Ig G.
2. A 0.2mL of serum aliquot was added to 0.2mL of the protein G agarose and incubated at 4 ºC for 3 hr.
67
4. The supernatant was measured by elecsys for TSH value.
5. Recovery calculated.
6. Samples showing remarkable decrease in protein G addition test suggested immunoglobulin G complexed form of TSH.
CALCULATION :
.
68
69
RESULTS
STATISTICAL ANALYSIS AND RESULTS
In this study, 200 serum samples were collected with TSH value more than 10 µIU /mL and FT4 within normal range [0.8 -2.7ng/dl]. First aliquots of all 200 samples were treated with PEG and second aliquots of serum samples with recovery less than 25% were further subjected to protein G addition test. Of 200 sample 9 sample had a post PEG recovery of less than 25% that is 4.5% of the total sample collected. After subjecting 9 samples to protein G addition test 4 serum samples showed a marked decrease in recovery percentage suggesting 2% of samples had macro TSH .
70
Table-1
TABLE SHOWING GENDER DISTRIBUTION OF SERUM SAMPLES COLLECTED.
Gender NUMBER (N) PERCENTAGE (%) MALE 22 11.00
FEMALE 178 89.00
TOTAL 200 100
71
[image:71.595.108.526.77.367.2]This graph shows that most of the TSH samples collected were between 30 to 40 years of age.
Table-2
AGE DISTRIBUTION OF PATIENTS
AGE GROUP MALE FEMALE TOTAL NO % NO % NO % ≤ 10 0 0 5 2.81 5 2.50
11 – 20 3 13.64 4 2.25 7 3.50
21 – 30 3 13.64 46 25.84 49 24.50
72
41 – 50 3 13.64 38 21.35 41 20.50
51 – 60 7 31.82 17 9.55 24 12.00
≥ 61 1 04.55 3 1.69 4 2.00
[image:72.595.104.530.72.232.2]TOTAL 22 100 178 100 200 100
[image:72.595.105.560.585.717.2]Table showing age and gender distribution among the sample collected.
Table-3
TABLE SHOWING THE RESULT AFTER PEG PRECIPITAION TEST AND PROTEIN G ADDITION TEST.
VARIABLES N=200
RECOVERY PERCENTAGE
NO OF
SAMPLES
PERCENTAGE OF
SAMPLES
PEG PRECIPITATION >25 %
73
TEST< 25% 9 4.5%
PROTEIN G ADDITION TEST
< 31% 4 2%
This table shows that among 200 samples treated with PEG, 95.5% sample has a recovery of more than 25% and 4.5% of samples have a recovery of less than 25%. After protein G addition test 2% of the sample shows results suggestive of macro TSH.
Table-4
SCORES COMPARATIVE OF VARIABLES
VARIABLES MALE FEMALE TOTAL MEAN SD MEAN SD MEAN SD
74
FT4 0.94 0.17 0.97 0.23 0.97 0.22
TSH .PEG 11.08 11.93 14.12 17.48 13.78 16.96
TSH .WATER 17.66 17.81 21.02 22.25 20.65 21.79
[image:74.595.103.531.72.232.2]RECOVERY% 63.04 18.96 62.85 19.40 62.87 19.30
Table showing mean and SD (standard deviation ) of variables analyzed in the study.
Table-5
PAIRED SAMPLE T-TEST (Pre Vs Post PEG treated values) VARIABLE
N=200
[image:74.595.102.544.668.743.2]75
TSH .PEG 13.78 16.96 12.84 0.0001 Significant
TSH.WATER 20.65 21.79
TSH treated with deionized water [TSH .WATER] is taken as control vs TSH treated with PEG and the values are compared by paired t test and p – value was derived. The test was significant.
76
[image:76.595.114.491.70.372.2]RECOVERY PERCENTAGE AFTER PEG TREATMENT FOR 200 SAMPLES SHOWS A MEAN OF 62.87 AND SD OF 19.3
Table-6
77
TSH N MEAN SD t-value p-value Significant
PEG % 9 17.09 3.90 3.19 0.01 Significant
Ig G % 9 30.67 12.18
Serum sample with recovery < 25% in PEG precipitation method compared with recovery percentage after subjecting them to protein G addition test. The test was significant .
78
GRAPH 3 : Shows serum TSH concentrations before and after serum treatment with PEG in patients with true TSH elevation [ie] for recovery > 25 %. Of 200 samples 191 samples had PEG recovery more than 25%. Comparing untreated TSH with PEG treated TSH samples there is no marked decrease in value showing no interference due to macro TSH.
79
9 [ 4.5%] out of 200 samples showed a recovery of less than 25% with PEG. A drastic decrease in TSH values after PEG treatment is noted.
GRAPH 5 : COMPARING UNTREATED TSH AND AFTER PROTEIN G ADDITION TEST .
80
GRAPH 4: Serum TSH concentrations before and after protein G addition test. 4 [2%] out of 9 samples shows marked decrease in TSH values after the test showing a recovery of less than 31 % suggesting macroTSH.
Table-6
81
r-value p-value Significant
PEG RECOVERY 0.89 0.01 Significant
Vs
PROTEIN G
[image:81.595.101.531.70.299.2]RECOVERY .
Table 6: Explains the Pearson’s Correlation Coefficient Between Biochemical Parameter of PEG precipitation test and protein G addition test. It Revealed Positive Correlation Between both the recoveries
82
83
84
DISCUSSION
Endogenous antibodies are one of the commonest cause of interference in TSH assay. One of the study showed that out of 5130 sets of results, 28 (0.53%) of them were analytically incorrect results 5. Out of which 23 patients had a potential adverse effect on the expense and clinical care. There are several causes of interference in thyroid hormone assay, of which some of them have been virtually eliminated from modern assays while other causes of interference like drugs, antibodies and macrocomplexes still persist. The clinical consequence of these interferences may lead to false elevation improper therapeutic decision and unnecessary follow up examination.
85
subjected to unnecessary treatment which may cause mismanagement75. In the study published by Hiroyuki sakai et al 7 elevated thyroid-stimulating hormone (TSH) was also found during regular neonatal screening in a newborn with no clinical symptoms. Thyroid function tests were repeated and confirmed to have high TSH value but normal total thyroxine (T4) and triiodothyronine (T3). The mothers of the neonates also had elevated serum TSH with normal levels of T4 and T3. This suggested a transmitted maternal interfering factor, and no treatment was started while further investigation suggested that serum from both the infant and the mother showed a peak TSH with molecular mass consistent with a TSH-IgG complex (macro-TSH) 77. The TSH values in the infant also declined to a normal level within 8 months in pace with a normal rate of elimination of maternal IgG .These cases suggests that interfering macro-TSH should also be considered in a euthyroid neonate with elevated serum TSH and normal T4 and T3 levels to avoid unnecessary treatment.
86
recovery percentage for TSH after PEG precipitation. This cut off can be taken for directing the samples which may need further investigation into the possibility of presence of macroTSH. PEG precipitation is relatively crude and subjected to certain limitation. The presence of increased globulin concentration may cause an increase in the amount of monomeric hormone precipitation with PEG. Other limitation of PEG is that it can interfere with some immunoassays.
In this study 200 hypothyroid cases were analysed before and after PEG treatment .TSH values of PEG untreated sera ranges from 10.1 to 99.2 with mean 36.67 and SD of 30.90. After the 200 serum were treated with PEG, the TSH was reanalysed which showed a decrease in TSH values of all sera. The TSH values of PEG treated samples ranges from 0.69 to 90.5 with mean of 13.78 and SD 16.96. TSH treated with deionised water used as a control ranges from 1.28 to 98.7 with mean of 20.65 and SD of 21.79.
87
In the study conducted by Francesca Mills et al., 5 low recovery percentage after PEG precipitation test < 25 % was detected in 15 (3 %) out of 495 serum sample with TSH measurement more than 10 mU/L and macro TSH were identified in 3 of 15 serum samples by gel filtration chromatography. Gel filtration chromatography test is the suggested test for the diagnosis of macro-TSH. But the test could not be performed because of the cumbersome procedure and cost. However, gel filtration chromatography may sometime do not differentiate the causes of interference 76 due to cross linking mechanism [eg heterophile antibodies] . Hence additional work to prove macroTSH like preincubation with urea, using acid elution buffer or selective precipitation with protein A or G sepharose is also proposed.
88
89
SUMMARY
The study of evaluation of immunoglobulin G complexed form of thyroid stimulating hormone [macro TSH] as interference in TSH assay was conducted in our tertiary care hospital.
200 serum samples were collected with TSH value more than 10 µIU /mL and FT4 within normal range [0.8 -2.7ng/dl]. Each serum sample were taken in two aliquots. Of all 200 samples were treated with PEG , serum samples with recovery less than 25% recovery were further subjected to protein G addition test.
Among 200 serum samples, with TSH more than 10 mU/L and FT4 within normal limits, 9 samples exhibited PEG-precipitable TSH ratios less than 25% recovery and were subjected to protein G addition test . Out of 9 serum sample 4 [2%] sample showed remarkable decrease in TSH recovery after protein G addition test suggesting most of the TSH in those samples exist in the form of macro TSH which were mostly IgG bound.
90
91
92
CONCLUSION
From the result of our study, we conclude that, Macro TSH mostly occurs in the form of TSH complexed with IgG . 9 (4.5%) serum samples with
recovery less than 25 % with PEG were further subjected to protein G addition
test 4 (2%) samples with remarkable decrease in TSH recovery after protein G addition test suggesting to have macro TSH. The clinician and laboratory personnel should be aware of macro TSH as one of the cause of false elevation
of TSH. Macro TSH should be suspected as one of the cause of interference
93
FUTURE PERSPECTIVE:
94
Bibliography
1. Chakera AJ, Pearce HS, Vaidya B. Treatment for primary hypothyroidism: Current approaches and future possibilities. Drug Des Devel Ther. 2012;6:1–11.
2. . Unnikrishnan AG, Kalra S, John M, Sahay RK, Ganapathi B. Prevalence of hypothyroidism in India. Disorders of Thyroid Function. Thyroid. 2012;22(Suppl 1):91.
3. Vanderpump MP, Tunbridge WM, French JM, Appleton D, Bates D, Clark F, et al. The incidence of thyroid disorders in the community: A twenty-year follow-up of the Wickham Survey. Clin Endocrinol (Oxf) 1995;43:55–68.
4. Kochupillai N. Clinical endocrinology in India. Curr Sci. 2000;79:1061–7.
5. Francesca Mills, Jinny Jeffery,Paul Mackenzie,Alex Cranfield and Ruth M Ayling . An immunoglobulinG complexed form of thyroid stimulating hormone (macro thyroid stimulating hormone) is a cause of elevated serum thyroid stimulating hormone concentration . Ann Clin Biochem 2013; 416 -420
95
Hattori1, Takashi Ishihara2 and Akira Shimatsu3 Hiroyuki Sakai ,Gen fukuda et al .
7. Hiroyuki sakai et al Falsely elevated thyroid – stimulating hormone level due to Macro TSH.Endocrine Journal 2009, 56(3) , 435 – 440.
8. .Heidi Mendoza et al.Unexplained high thyroid stimulating hormone : a “BIG” problem.BMJ case rep. 2009 ; 2009 bcr 01 .2009 1474
9. .Despres N and Grand AM . Antibody interference in thyroid assay : a potential for clinical misinformation.clin chem 1998 ; 44: 440- 4
10. .Halsall DJ , Fahie Wilson MN , Hall SK , et al. Macro thyrotropin – Ig G complex causes factitious increases in thyroid stimulating hormone
screening test in a neonate and mother . Clin chem 2006; 52 : 1968 -9
11. Ronald C Hamdy, MD,FRCP, FACP: The Thyroid gland: A brief historical perspective : South Med J.2002;95(5)
12. Ronald C Hamdy, MD,FRCP, FACP: The Thyroid gland: A brief historical perspective : South Med J.2002;95(5)
13. Tietz textbook of clinical chemistry and molecular diagnostics,fifthedition,page no 1905- 1943.
96
15. keisulke ikegami et al Tissue – specific post translation modification allows functional targeting of thyrotropins . cell report 9, 801 -809 ,November 6, 2014
16. Pierce J.G and Parson ,T.F(1981) Glycoprotein hormone : structure and function . Annu .Rev.Biochem.50, 465- 495.
17. Magner J.A(1990) Thyroid stimulating hormone : biosynthesis , cell biology, and bioactivity .Endocr.Rev.11 , 354 – 385.
18. Hanon EA, Lincoln GA, Fustin JM, Dardente H, Masson-Pevet M, Morgan PJ, Hazlerigg DG. Ancestral TSH Mechanism Signals Summer in a Photoperiodic Mammal. Curr Biol. 2008;18:1147–1152.
19. Nakao N, Ono H, Yamamura T, Anraku T, Takagi T, Higashi K, Yasuo S, Katou Y, Kageyama S, Uno Y, et al. Thyrotrophin in the pars tuberalis triggers photoperiodic response. Nature. 2008;452:317–322.
20. Ono H, Hoshino Y, Yasuo S, Watanabe M, Nakane Y, Murai A, Ebihara S, Korf HW, Yoshimura T. Involvement of thyrotropin in photoperiodic signal transduction in mice. Proc Natl Acad Sci USA. 2008;105:18238– 18242.
21. Yoshimura T, Shinobu Y, Watanabe M, Iigo M, Yamamura T, Hirunagi K, Ebihara S. Light-induced hormone conversion of T4 to T3 regulates
97
22. Bockmann J, Böckers T, Winter C. Thyrotropin expression in hypophyseal pars tuberalis-specific cells is 3,5,3′-triiodothyronine,
thyrotropin-releasing hormone, and Pit-1
independent. Endocrinology. 1997;138:1019–1028.
23. Klosen P, Bienvenu C, Demarteau O, Dardente H, Guerrero H, Pevet P, Masson-Pevet M. The mt1 Melatonin receptor and RORβ Receptor are co-localized in specific TSH-immunoreactive cells in the pars tuberalis of the rat pituitary. J Histochem Cytochem. 2002;50:1647–1657.
24. Reiter RJ. The pineal and its hormones in the control of reproduction in mammal. Endocr Rev. 1980;1:109–131.
25. Wittkowski W, Bergmann M, Hoffmann K, Pera F. Photoperiod-dependent changes in TSH-like immunoreactivity of cells in the hypophysial pars tuberalis of the Djungarian hamster, Phodopus sungorus. Cell Tissue Res. 1988;251:183–187.
98
27. Sakamoto S, Sakai T, Inoue K, Kurosumi K. Melatonin stimulates thyroid-stimulating hormone accumulation in the thyrotropes of the rat pars tuberalis. Histochem Cell Biol. 2000;114:213–218.
28. Baker BL, Yu YY. Hypophyseal changes induced by thyroid deficiency and thyroxine administration as revealed by immunochemical staining. Endocrinology. 1971;89:996–1004.
29. Böckers TM, Niklowitz P, Bockmann J, Fauteck JD, Wittkowski W, Kreutz MR. Daily melatonin injections induce cytological changes in pars tuberalis-specific cells similar to short photoperiod. J Neuroendocrinol. 1995;7:607–613.
30. Sakamoto S, Sakai T, Inoue K, Kurosumi K. Melatonin stimulates thyroid-stimulating hormone accumulation in the thyrotropes of the rat pars tuberalis. Histochem Cell Biol. 2000;114:213–218.
31. Andersen S, Pedersen KM, Bruun NH, Laurberg P. Narrow individual variations in serum T4 and T3in normal subjects: a clue to the understanding of
subclinical thyroid disease. J Clin Endocrinol Metab. 2002;87:1068–1072.
99
33. Klug T, Adelman R. Evidence for a large thyrotropin and its accumulation during aging in rats. Biochem Biophys Res Commun. 1977;77:1431–1437.
34. Lutz HU. Naturally occurring antibodies (NAbs) Landes Bioscience / Springer Science + Business Media; Austin: 2012.
35. Aksentijevich I, Sachs DH, Sykes M. Natural antibodies against bone marrow cells of a concordant xenogeneic species. J Immunol. 1991;147:4140–4146.
36. Sakai H, Fukuda G, Suzuki N, Watanabe C, Odawara M. Falsely elevated thyroid-stimulating hormone (TSH) level due to macro-TSH. Endocr J. 2009;56:435–440
37. Vieira JGH, Maciel RMB, Hauache OM, Nishida SK, Boelter DMG, Pinheiro MFMC. Valores inesperadamente elevados de TSH: A Presenca de formas de alto peso molecular (“Macro TSH”) deve ser investigada. Arq Bras Endocrinol Metab. 2006;50:445–449.
38. Baensiger JU, Green ED. Pituitary glycoprotein hormone oligosaccharides: structure, synthesis and function of the asparagine-linked oligosaccharides on lutropin, follitropin and thyrotropin. Biochim Biophys Acta. 1988;947:287–306
39. Strott CA. Sulfonation and molecular action. Endocr Rev. 2002;23:703–732.
100
41. Wide L, Eriksson K, Sluss PM, Hall JE. Serum half-life of pituitary gonadotropins is decreased by sulfonation and increased by sialylation in women. J Clin Endocrinol Metab. 2009;94:958–964.
42. Beck-Peccoz P, Amr S, Menezes-Ferreira MM, Faglia G, Weintraub BD. Decreased receptor binding of biologically inactive thyrotropin in central hypothyroidism. Effect of treatment with thyrotropin-releasing hormone. N Engl J Med. 1985;312:1085–1090.
43. Persani L, Borgato S, Romoli R, Asteria C, Pizzocaro A, Beck-Peccoz P. Changes in the degree of sialylation of carbohydrate chains modify the biological properties of circulating thyrotropin isoforms in various physiological and pathological states. J Clin Endocrinol Metab. 1998;83:2486– 2492.
44. Taylor T, Weintraub BD. Altered thyrotropin (TSH) carbohydrate structures in hypothalamic hypothyroidism created by paraventricular nuclear lesions are
corrected by in vivo TSH-releasing hormone
administration. Endocrinology. 1989;125:2198–2203.
101
46. Gesundheit N, Magner JA, Chen T, Weintraub BD. Differential sulfation and sialylation of secreted mouse thyrotropin (TSH) subunits: regulation by TSH-releasing hormone. Endocrinology. 1986;119:455–463.
47. Helton TE, Magner JA. β-Galactoside α-2,3-sialyltransferase messenger RNA increases in thyrotrophs of hypothyroid mice. Thyroid. 1995;5:315–317.
48. Parle JV, Franklyn JA, Cross KW, Jones SC, Sheppard MC. Prevalence and follow-up of abnormal thyrotrophin (TSH) concentrations in the elderly in the United Kingdom. Clin Endocrinol. 1991;34(1):77–83.
49. Meyerovitch J, Rotman-Pikielny P, Sherf M, Battat E, Levy Y, Surks MI. Serum thyrotropin measurements in the community: five-year follow-up in a large network of primary care physicians. Arch Intern Med. 2007;167(14):1533–1538.
50. Biondi B & Cooper DS. The clinical significance of subclinical thyroid dysfunction. Endocrine Reviews 2008 29 76–131.
51. Baloch Z, Carayon P, Conte-Devolx B, Demers LM, FeldtRasmussen U, Henry JF, LiVosli VA, Niccoli-Sire P, John R, Ruf J, Smyth PP, Spencer CA, Stockigt
JR 2003 Laboratory medicine practice guidelines. Laboratory support for the
diagnosis and monitoring of thyroid disease. Thyroid 13: 3–126.
102
53. Verhoye E, Van den Bruel A, Delanghe JR, Debruyne E, Langlois MR. Spuriously high thyrotropin values due to anti-thyrotropin antibodies in adult patients. Clin Chem Lab Med 2009; 47:604-606.
54. Sarkar R. TSH Comparison Between Chemiluminescence (Architect) and Electrochemiluminescence (Cobas) Immunoassays: An Indian Population Perspective. Indian journal of clinical biochemistry : IJCB 2014; 29:189-195.
55. Weber TH, Käpyaho KI, Tanner P. Endogenous interference in immunoassays in clinical chemistry. A review. Scand J Clin Lab Invest 1990; 201:77-82.
56. Marks V. False-positive immunoassay results: a multicenter survey of erroneous immunoassay results from assays of 74 analytes in 10 donors from 66 laboratories in seven countries. Clin Chem 2002; 48:2008-2016.
57. Kricka LJ. Human anti-animal antibody interference in immunological assays. Clin Chem 1999; 45:942-956.
58. Sturgeon CM, Viljoen A. Analytical error and interference in immunoassay: minimizing risk. Ann Clin Biochem 2011; 48:418-432.
59. Despres N, Grant AM. Antibody interference in thyroid assays: a potential for clinical misinformation. Clin Chem 1998; 44:440-454.
103
61. Ismail AA. On detecting interference from endogenous antibodies in immunoassays by doubling dilutions test. Clin Chem Lab Med 2007; 45:851-854.
62. Nakano K, Yasuda K, Shibuya H, Moriyama T, Kahata K, Shimizu C. Transient human anti-mouse antibody generated with immune enhancement in a carbohydrate antigen 19-9 immunoassay after surgical resection of recurrent cancer. Ann Clin Biochem 2016; 53:511-55.
63. Sapin R, Agin A, Gasser F. Efficacy of a new blocker against anti-ruthenium antibody interference in the Elecsys free triiodothyronine assay. Clin Chem Lab Med 2007; 45:416-418.
64. Ohba K, Noh JY, Unno T, Satoh T, Iwahara K, Matsushita A, Sasaki S, Oki Y, Nakamura H. Falsely elevated thyroid hormone levels caused by anti-ruthenium interference in the Elecsys assay resembling the syndrome of inappropriate secretion of thyrotropin. Endocr J 2012; 59:663-667.
65. Rulander NJ, Cardamone D, Senior M, Snyder PJ, Master SR. Interference from anti-streptavidin antibody. Arch Pathol Lab Med 2013; 137:1141-1146.
66. Vos MJ, Rondeel JM, Mijnhout GS, Endert E. Immunoassay interference caused by heterophilic antibodies interacting with biotin. Clin Chem Lab Med 2016.
104
68. Barbesino G. Misdiagnosis of Graves’ Disease with Apparent Severe Hyperthyroidism in a Patient Taking Biotin Megadoses. Thyroid 2016; 26:860-863.
69. Drees JC1, Stone JA, Reamer CR, Arboleda VE, Huang K, Hrynkow J, Greene DN, Petrie MS, Hoke C, Lorey TS, Dlott RS. Falsely Undetectable TSH in a Cohort of South Asian Euthyroid Patients. J Clin Endocrinol Metab 2014; 99:1171-1179.
70. Pappa T, Johannesen J, Scherberg N, Torrent M, Dumitrescu A, Refetoff S. A TSHbeta Variant with Impaired Immunoreactivity but Intact Biological Activity and Its Clinical Implications. Thyroid 2015; 25:869-876.
71. Medeiros-Neto G, Herodotou DT, Rajan S, Kommareddi S, de Lacerda L, Sandrini R, Boguszewski MC, Hollenberg AN, Radovick S, Wondisford FE. A circulating, biologically inactive thyrotropin caused by a mutation in the beta subunit gene. J Clin Invest 1996; 97:1250-1256.
72. Polson, A., Potgieter, G. M.,L argier, J. F., Mears, G. E. F., and Joubert, F. J. (1964) Biochim. Biophys. Acta 82, 463-475.
105
74. RAJIV BHAT’ et al Steric exclusion is the principal source of the preferential hydration of proteins in the presence of polyethylene glycols. Protein Science (1992), I, 1133-1143.
75. Nauki hattori et al Etiology and Bioactivity of Macro TSH, Endocrine Society's 97th Annual Meeting and Expo, March 5–8, 2015 .
76. Halsall DJ, English E and Chatterjee VK. Interference from heterophilic antibodies in TSH assays. Ann Clin Biochem 2009; 46: 345–6.
77. Rix M1, Laurberg P, Porzig C, Kristensen SR. Elevated thyroid-stimulating hormone level in a euthyroid neonate caused by macro thyrotropin-IgG complex. Acta Paediatr. 2011 Sep;100(9):e135-7.
78. Cooper DS. Subclinical hypothyroidism. N Engl J Med. 2001;345(4):260-265
106
MASTER CHART
s.no age sex
TSH
µIU/mL FT4
ng/dl TSH.PEG TSH.H2O
% PEG
recovery IgG .TSH
IgG
recovery%
1 35 F 14.5 1.1 2.5 7.1 35.3
2 34 F 16.3 1.3 3.08 8.2 37.5
3 55 F 13.8 1.1 4.16 6.1 67.2
4 53 F 90.7 0.8 20.7 40.3 51
5 50 F 39.1 1.2 41 41.3 99
6 22 F 14.2 1.2 5.5 7.2 76
7 35 F 62.3 0.8 12.1 30.2 40
8 39 F 95 0.8 32.1 56 57
9 31 M 96 0.8 23 53 43
10 40 F 11.4 1 1.5 2.7 55
11 28 F 15.9 1.1 3.1 6.7 46.2
12 30 F 11.7 1.5 1.3 2.2 58
13 49 f 14.5 1.1 2.2 5.3 41
14 29 f 10.9 1.2 2.1 4.3 48
15 33 F 33.7 1 8.2 10.5 78
16 30 F 11.4 1.4 2.5 2.8 89
17 29 F 98 0.8 23.1 52 44
18 48 F 16.1 1.1 3.08 7.4 41.5
19 23 F 15.9 1 6.1 7.2 84.7
107
20 48 F 12.2 1.3 2.8 4.3 65.1
21 40 F 18.5 1.1 5.8 9.3 62.3
22 40 F 24.5 0.8 6.6 8.6 76.7
23 48 F 10.6 0.9 3.7 5.2 71.1
24 29 F 58.1 1.6 12.3 17.3 71.09
25 37 F 31.6 1 3.4 16.3 20.7 7.6 47%
26 56 F 10.5 1 1.17 6.5 18 2.1 32%
27 40 f 12.6 1 4.1 6.2 66.1
28 40 F 18.5 1.1 1.9 9.6 19.7 4.03 42%
29 30 F 14.5 0.9 5.2 7.2 72.2
30 10 F 11.4 1 4.2 6.7 62.6
31 27 F 53.6 0.9 16.4 21.1 77.7
32 50 F 76.6 0.9 4.7 33.3 14.2 6.3 19%
33 35 F 94 0.8 25.8 51.1 50.4
34 24 F 97 0.8 12.01 17.3 69.4
35 29 F 12.5 0.9 4.1 6.2 66.1
36 40 F 13.2 1.16 31.2 35.8 87.1
37 25 F 15.4 1.08 4.1 6.1 67.2
38 27 F 32.9 0.9 10.5 17.5 60
39 26 F 16.8 1.1 3.1 7.1 43.6
40 40 F 13.2 1.16 3.3 8.9 37