0022-538X/10/$12.00 doi:10.1128/JVI.00585-10
Copyright © 2010, American Society for Microbiology. All Rights Reserved.
P Body-Associated Protein Mov10 Inhibits HIV-1 Replication
at Multiple Stages
䌤
†
Ryan Burdick,
1Jessica L. Smith,
1Chawaree Chaipan,
1Yeshitila Friew,
1Jianbo Chen,
2Narasimhan J. Venkatachari,
1Krista A. Delviks-Frankenberry,
1Wei-Shau Hu,
2and Vinay K. Pathak
1*
HIV Drug Resistance Program, National Cancer Institute at Frederick, Viral Mutation Section1and
Viral Recombination Section,2Frederick, Maryland 21702
Received 17 March 2010/Accepted 16 July 2010
Recent studies have shown that APOBEC3G (A3G), a potent inhibitor of human immunodeficiency virus type 1 (HIV-1) replication, is localized to cytoplasmic mRNA-processing bodies (P bodies). However, the functional relevance of A3G colocalization with P body marker proteins has not been established. To explore the relationship between HIV-1, A3G, and P bodies, we analyzed the effects of overexpression of P body marker proteins Mov10, DCP1a, and DCP2 on HIV-1 replication. Our results show that overexpression of Mov10, a putative RNA helicase that was previously reported to belong to the DExD superfamily and was recently reported to belong to the Upf1-like group of helicases, but not the decapping enzymes DCP1a and DCP2, leads to potent inhibition of HIV-1 replication at multiple stages. Mov10 overexpression in the virus producer cells resulted in reductions in the steady-state levels of the HIV-1 Gag protein and virus production; Mov10 was efficiently incorporated into virions and reduced virus infectivity, in part by inhibiting reverse transcription. In addition, A3G and Mov10 overexpression reduced proteolytic processing of HIV-1 Gag. The inhibitory effects of A3G and Mov10 were additive, implying a lack of functional interaction between the two inhibitors. Small interfering RNA (siRNA)-mediated knockdown of endogenous Mov10 by 80% resulted in a 2-fold reduction in virus production but no discernible impact on the infectivity of the viruses after normalization for the p24 input, suggesting that endogenous Mov10 was not required for viral infectivity. Overall, these results show that Mov10 can potently inhibit HIV-1 replication at multiple stages.
Approximately 33 million people are currently infected with human immunodeficiency virus type 1 (HIV-1) (www.unaids .org). Each year, approximately 2.1 million people die of AIDS, and 2.5 million people become infected. The HIV-1 infections and the resulting AIDS pandemic remains a global crisis due to the inaccessibility of current anti-HIV-1 drugs, the development of drug-resistant viral variants, and the lack of an effective vaccine or antiviral treatments. HIV-1 requires inter-actions with multiple host proteins for efficient virus replica-tion and pathogenesis (17). Recently, several funcreplica-tional genomic studies have identified hundreds of host genes with diverse cellular functions that potentially facilitate HIV-1 rep-lication (4, 23, 48, 50). A thorough understanding of the rela-tionship between HIV-1 and host proteins will increase our knowledge of HIV-1 replication and may facilitate the devel-opment of novel anti-HIV-1 drugs.
In addition to host proteins that aid HIV-1 replication, sev-eral recently identified host proteins inhibit viral replication. These proteins, called restriction factors, include the APOBEC3G (A3G) and APOBEC3F (A3F) proteins, the TRIM5␣proteins, and tetherin/BST-2/CD317 (36–38, 42, 49). Lately, there has been increased interest in the relationship
among HIV-1, A3G and A3F, and mRNA-processing bodies (P bodies) (20, 43, 46). P bodies are discrete cytoplasmic domains that contain proteins involved in diverse posttran-scriptional processes, such as mRNA degradation, nonsense-mediated mRNA decay, translational repression, and RNA-mediated gene silencing (reviewed in references 2, 15, and 33). Suppression of various P body-associated proteins, including DDX6 (also known as RCK/p54), LSM-1, GW182, XRN1, DGCR8, Dicer, and Drosha, has been shown to increase HIV-1 production (7, 31). Recent evidence suggests that hu-man cellular miRNA-29a represses HIV-1 replication by facil-itating the interaction of HIV-1 RNA with DDX6 and Argo-naute 2 (Ago2), two proteins associated with the RNA-induced silencing complex (RISC) (31). Moreover, microscopic evi-dence has suggested that HIV-1 RNA localizes to P bodies (7, 31). Interestingly, A3G and A3F also localize to P bodies, and it has been shown that A3G associates with proteins of the RISC, including Ago2, the decapping enzymes DCP1a and DCP2, and DDX6 (20, 25, 46); however, the functional rele-vance of the A3G/A3F association with the P bodies remains unclear.
Mov10, a putative RNA helicase, was previously reported to belong to the DExD superfamily (29) and recently was re-ported to belong to the Upf1-like group of helicases (16). Mov10 is a P body marker protein that associates with the Argonaute proteins (Ago1 and Ago2), which are thought to comprise the core of the RISC, as well as A3G, and may be functionally required for microRNA (miRNA)-guided mRNA cleavage (16, 20). The candidate homologs of Mov10 are the
* Corresponding author. Mailing address: HIV Drug Resistance Program, National Cancer Institute—Frederick, P.O. Box B, Building 535, Room 334, Frederick, MD 21702-1201. Phone: (301) 846-1710. Fax: (301) 846-6013. E-mail: [email protected].
† Supplemental material for this article may be found at http://jvi .asm.org/.
䌤Published ahead of print on 28 July 2010.
10241
on November 8, 2019 by guest
http://jvi.asm.org/
Arabidopsisprotein SDE3, an RNA helicase that is required for posttranscriptional gene silencing, and theDrosophila pro-tein Armitage, a putative RNA helicase that is required for the production of the active RISC (13, 14, 40). Mov10 associates with a multiprotein RISC-containing complex that includes the 60S ribosome and the eukaryotic translation initiation factor eIF6 (9). Interestingly, the HIV transactivating response RNA-binding protein (TRBP) is also associated with Dicer and Ago2, and the Dicer-TRBP complex facilitates miRNA pro-cessing and RISC assembly (10). Mov10 interacts with the hepatitis delta antigen (HDAg) and may facilitate the RNA-directed transcription of HDAg mRNA (21). Although the function(s) of Mov10 remains unclear, it was found to be packaged into HIV-1 particles produced from monocyte-de-rived macrophages (11).
In order to better understand the cellular role of P body-associated proteins and their relationship with HIV-1, we an-alyzed the effects of overexpression of P body proteins on HIV-1 replication and found that Mov10, but not DCP1a and DCP2, inhibits HIV-1 replication. We also found that Mov10 overexpression inhibits HIV-1 production and is packaged ef-ficiently into viral particles and that infectivity of the virions produced is impaired at least in part at the level of reverse transcription (RT). Contrary to other studies that identified P body-associated proteins as suppressors of HIV-1 replication, the knockdown of Mov10 decreased virus production but had little impact on the virus infectivity. We further demonstrate that Mov10 specifically associates with HIV-1 RNA.
MATERIALS AND METHODS
Plasmid construction.HIV-1-based vector pHDV-EGFP was kindly provided by Derya Unutmaz (New York University) (41). pHCMV-G expresses the ve-siculostomatitis virus envelope glycoprotein G (VSV-G) from a human
cytomeg-alovirus promoter (47). pC-Help⌬Vif, kindly provided by Klaus Strebel (National
Institute of Allergy and Infectious Diseases, NIH, Bethesda, MD), is an HIV-1
helper construct that lacks severalcis-acting elements needed for viral
replica-tion, including the packaging signal and primer-binding site, but expresses all of the viral proteins except Vif, Nef, and Env (30, 39). pNL4-3 was previously described (1). For visualization of virus particles, the following constructs were used: pGagCeFP-BglSL (expresses the Gag-CeFP fusion protein and an RNA that contains Bgl stem-loops), pGag-BglSL (expresses Gag as well as an HIV-1 RNA that contains Bgl stem-loops), and pmCherry (expresses a Bgl-mCherry fusion protein that binds to Bgl stem-loops) (8). pHIV-1-Gag-Bgl-mCherry (expresses the Gag-mCherry fusion protein and HIV-1 RNA) was constructed by PCR amplification of mCherry and modification of pHIV-1-Gag-mRFP (12). pSynGag-mCherry (expresses the codon-optimized Gag-mCherry fusion protein
and an RNA that has no significant homology with HIV-1gagsequence) was
constructed by PCR amplification of mCherry and modification of pSYNGP (24). mRFP1 was previously described (5). pEGFP-N1 was obtained from Clon-tech.
P body marker expression vectors Mov10, DCP1a, DCP2, and pF-DDX6 were constructed by PCR amplification of Mov10, DCP1a, DCP2, and DDX6 cDNAs (obtained from Open Biosystems), respectively, and contained an N-terminal flag epitope (DYKDDDDK). pFLAG-A3G (here referred to as pF-A3G), pcDNA-EYFP-A3G (here referred to as pYFP-A3G), pA3G-NY, pA3G-CY, pHIV-1-Gag-NY, pHIV-1-Gag-CY, and pcDNA-APO3G were de-scribed previously (18, 22, 34). The N-terminal Venus yellow fluorescent protein (YFP)-tagged P body marker expression plasmids pYFP-Mov10, pYFP-DCP1a, and pYFP-DCP2 were constructed by modification of pYFP-A3G. The N-ter-minal monomeric red fluorescent protein (mRFP)-tagged A3G expression plas-mid was constructed by first amplifying mRFP from the previously described pHIV-1-Gag-mRFP (12) and modifying pYFP-A3G. The Mov10, mRFP-DCP1a, and mRFP-DCP2 expression plasmids were constructed by modifying mRFP-A3G.
Cell culture.Human 293T, HeLa, and TZM-bl, which encodes a firefly lucif-erase reporter gene under the control of the HIV-1 Tat responsive promoter
(45), were maintained in Dulbecco’s modified Eagle’s medium (DMEM) sup-plemented with 10% fetal calf serum and penicillin-streptomycin (50 U and 50
g per ml, respectively).
Confocal microscopy.HeLa cells (2.5⫻105
cells per 35-mm glass-bottom dish
[MatTek]) were cotransfected with mRFP-A3G (0.75g) and pYFP-DCP1a,
pYFP-DCP2, or pYFP-Mov10 (0.75g) using the FuGene6 transfection reagent
(Roche). Live-cell imaging was performed at 37°C and 5% CO2at 16 h
post-transfection using laser scanning confocal microscopy (Olympus FluoView FV1000).
Transfection and virus production.Transfections were carried out with the polyethylenimine (PEI) transfection reagent (Sigma), as previously described (3,
35). Human 293T cells (8⫻105
cells per well in six-well plates) were
cotrans-fected with pHDV-EGFP (3.33g), pHCMV-G (0.67g), and various amounts
of P body marker expression plasmids. In some experiments, pC-Help⌬Vif(2.5
g) was also transfected; pUC19 or empty pcDNA3.1vector was used to maintain
equivalent amounts of transfected DNA. When necessary, viruses were
concen-trated by up to 100-fold by ultracentrifugation at 100,000⫻gfor 90 min at 4°C.
Virus infectivity.The virus-containing supernatant was collected at 48 h
post-transfection and filtered through a 0.45-m filter, and the p24 capsid (CA)
amount was determined by enzyme-linked immunosorbent assay (ELISA;
PerkinElmer). Infection of TZM-bl cells (4⫻103cells per well in 96-well plates)
with virus preparations containing 5 ng of p24 CA and luciferase enzyme activity determinations at 72 h postinfection were carried out as previously described (34).
To determine the effect of P body markers in target cells on HIV-1 infection,
293T cells (8⫻105cells per well in six-well plates) were cotransfected with 0.67
g of the following expression plasmids using the PEI method: mRFP1,
mRFP-A3G, mRFP-Mov10, mRFP-DCP1a, or mRFP-DCP2. A fraction of the trans-fected cells (one-sixth) were collected at 48 h posttransfection, reseeded, and infected with VSV-G-pseudotyped HDV-enhanced green fluorescent protein
(EGFP) virus (100 ng p24 CA). The cells were fixed with 100l 4%
parafor-maldehyde at 48 h postinfection and analyzed by flow cytometry (BD Bio-sciences) for cellular EGFP and mRFP expression (FlowJo software).
Western blot analysis.Virus samples and cell lysates were analyzed by sodium dodecyl sulfate-polyacrylamide gel electrophoresis (SDS-PAGE) and Western blot analysis. Total cell protein concentrations were determined using a Bradford assay (Bio-Rad). The Flag-tagged proteins were detected using a rabbit anti-FLAG polyclonal antibody (Sigma), followed by a horseradish peroxidase (HRP)-labeled goat anti-rabbit secondary antibody (Sigma); p24 CA proteins were detected using a mouse anti-HIV-1 p24 Gag monoclonal antibody (HIV-1 p24 Gag monoclonal [24-3] kindly provided from Michael H. Malim, AIDS Research and Reference Reagent Program, Division of AIDS, NIAID, NIH), followed by a HRP-labeled goat anti-mouse secondary antibody (Sigma); the myc-tagged proteins were detected using a mouse anti-c-Myc antibody (Sigma), followed by a HRP-labeled goat anti-mouse secondary antibody. To verify
equiv-alent input of cell lysates,␣-tubulin was also detected using mouse anti-␣-tubulin
antibody (Sigma), followed by a HRP-labeled goat mouse secondary anti-body. Protein bands were visualized using the Western Lightning Chemilumi-nescence Reagent Plus kit (PerkinElmer).
For quantitative Western blot analysis, total cell lysates (5g, unless stated
otherwise) and immunoprecipitates were analyzed by SDS-PAGE. Flag-tagged
proteins, p24 CA, and␣-tubulin were detected using the primary antibodies
described above, followed by an infrared dye-labeled (800CW) goat anti-rabbit secondary antibody or an infrared dye-labeled (680) goat anti-mouse secondary antibody (Li-Cor). Endogenous Mov10 or transfected F-Mov10 proteins were detected using a rabbit anti-Mov10 antibody (Novus Biologicals), followed by an 800CW-labeled goat anti-rabbit secondary antibody. EGFP was detected using an anti-GFP antibody (Sigma), followed by an 800CW-labeled goat anti-rabbit secondary antibody. The integrated signal intensities of the protein bands were calculated using the Odyssey system (Li-Cor).
siRNA knockdown of Mov10.For small interfering RNA (siRNA) knockdown
of Mov10, 293T cells (7⫻105cells per well in six-well plates) were transfected
with 25 nM Silencer select control and Mov10 siRNAs (Ambion) usingTrans
IT-TKO transfection reagent (Mirus Bio) and incubated for 48 h. A fraction of the transfected cells (one-sixth) were collected at 48 h posttransfection, reseeded,
and transfected with pHDV-EGFP (1.0g), pHCMV-G (0.2 g), and the
siRNAs (25 nM) in order to produce virus and maintain Mov10 knockdown. Total RNA was also extracted from the other fraction of cells using the RNeasy minikit (Qiagen) and treated with DNase (Turbo DNA-free kit; Ambion). HIV-1
RNA (U5target sequence) was detected on the Roche LightCycler 480 using
the LightCycler 480 RNA master hydrolysis probes reaction mix (Roche), with the forward and reverse primers as previously described (28). Cellular
porpho-10242 BURDICK ET AL. J. VIROL.
on November 8, 2019 by guest
http://jvi.asm.org/
bilinogen dehydrogenase (PBGD) RNA was used to normalize for RNA input and was detected as previously described (28).
Single-virion analysis using fluorescent microscopy.Single-virion analysis was performed as described previously (8) and used to directly visualize virion in-corporation of YFP-tagged P body proteins, measure virus production, and
calculate RNA packaging efficiency. Briefly, 293T cells (9⫻105cells per well in
six-well plates) were cotransfected with pGagCeFP-BglSL (0.25g),
pGag-BglSL (0.25g), and pBgl-mCherry (1.0g) and increasing amounts of
pYFP-A3G, pYFP-Mov10, pYFP-DCP1a, or pYFP-DCP2 (0.25, 0.5, or 1.0g of
pYFP-A3G and pYFP-Mov10 and 0.5 or 1.0g of DCP1a and
pYFP-DCP2) using FuGene HD transfection reagent (Roche). Empty pcDNA3.1 was used to maintain equivalent amounts of transfected DNA. The virus-containing supernatant was harvested at 16 h posttransfection, mixed with Polybrene, and
incubated in a 35-mm-glass-bottom dish (MatTek) for 2 h at 37°C with 5% CO2.
Epifluorescent microscopy was used to visualize virus-like particles (VLPs); CeFP (Gag), mCherry (HIV-1 RNA), and YFP (P body protein) signal analysis and colocalization were performed as previously described (8). A minimum of 5 images were taken for each sample. Merged and pseudocolored images were generated using ImageJ software. P body protein packaging efficiency was
cal-culated by determining the percentage of CeFP⫹mCherry⫹particles that
con-tained the YFP signal. RNA packaging efficiency was calculated by determining
the percentage of CeFP⫹particles that contained the mCherry signal. Linearity
of the assay for quantitation of virus production was determined by analyzing serial dilutions of three virus samples; an average of 5 pictures was taken for each sample. The cells were collected at 18 h posttransfection and analyzed by flow cytometry for cellular YFP expression, as described above. To determine whether the YFP-tagged P body markers packaged into particles produced in the
absence of HIV-1 RNA, 293T cells were cotransfected with pSYNGP (0.25g),
pHIV-1-Gag-mCherry (0.25g), or pSynGag-mCherry (0.25g) and 1g of
YFP-A3G, YFP-Mov10, YFP-DCP1a, or YFP-DCP2 expression plasmids. P body protein packaging efficiency was calculated by determining the percentage
of mCherry⫹(Gag) particles that contained the YFP signal.
Coimmunoprecipitation of RNA.For immunoprecipitation of RNA, 293T cells
(4⫻106cells per 10-cm-diameter dish) were transfected with pHDV-EGFP (7.0
g) and either pcDNA3.1 (control), pF-A3G (3.0g), pF-Mov10 (18.0g),
pF-DCP1a (12.0 g), or pF-DDX6 (12.0g), a known RNA helicase that
associates with P bodies and HIV-1 RNA (31). F-DCP2 could not be immuno-precipitated using an anti-Flag antibody and therefore was not used in this experiment (data not shown). Total cellular RNA was extracted from 10% of the cells at 48 h posttransfection and DNase treated for 30 min, and HIV-1, 7SL, and PBGD RNAs were quantified using real-time reverse transcription-PCR (RT-PCR). HIV-1 and PBGD RNAs were measured as described above, and 7SL RNA was detected using a probe (7SL-Pr) and forward and reverse primers (7SL-F and 7SL-R, respectively) as previously described (32). The remaining 90% of the cells were lysed in the presence of RNaseOUT (Invitrogen) to minimize RNA degradation and used for Western blotting and immunoprecipi-tation using anti-Flag M2 affinity gel (Sigma). The immunoprecipitates were used for Western blotting and total RNA extraction, and the RNA was analyzed for
HIV-1 RNA (U5target sequence) and 7SL RNA using real-time RT-PCR.
Quantitative real-time PCR analysis of reverse transcription.The real-time PCR assays were performed as previously described, with some modifications
(26–28). Briefly, 293T cells (3⫻106
cells per 10-cm-diameter dish) were co-transfected with the following plasmids using the CalPhos mammalian
transfec-tion kit (Clontech): pHDV-EGFP (10g), pHCMV-G (2g), and either
pF-A3G (2g) or pF-Mov10 (4g). Empty pcDNA3.1 was used as the vector
control and to maintain equivalent amounts of transfected DNA. Virus samples
were concentrated 20-fold by ultracentrifugation at 100,000⫻gfor 90 min at
4°C, and 293T cells (2⫻105
cells in 60-mm-diameter dishes) were infected with virus preparations containing 150 ng of p24 CA. Heat-inactivated virus (65°C for 1 h) was used to infect cells in parallel to determine the level of contamination
with transfected DNA, which was⬍1% of the copy numbers obtained with
infectious virus. Total cellular DNA was isolated at 6, 24, and 120 h postinfection using the QIAamp DNA blood minikit (Qiagen) and treated with DpnI (New England Biolabs) prior to real-time PCR to degrade plasmid DNA carried over from the transfections. The viral DNA early products (RU5), minus-strand
transfer (U3U5) products, late products (U5), and host CCR5 copy numbers
were determined using the LightCycler 480 DNA probes master reaction mix (Roche) and the primer-probe sets as previously described (28). Relative inte-gration efficiency was determined as the proportion of late RT product 6 h after infection to the late RT product after 5 days. Relative infectivity was determined
at 48 h postinfection by flow cytometric quantitation of GFP⫹cells.
RESULTS
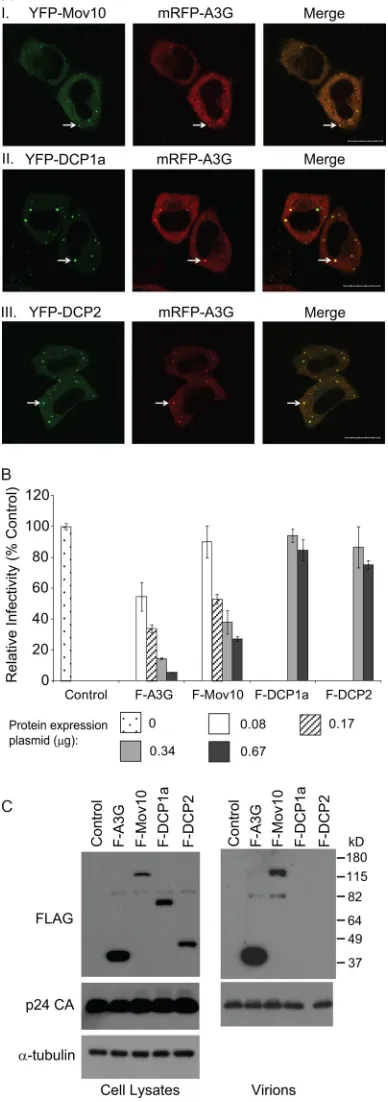
A3G colocalizes with P body marker proteins.To determine the intracellular localization of A3G and P body markers, HeLa cells were cotransfected with the mRFP-A3G expression plasmid and YFP-DCP1a, YFP-DCP2, or YFP-Mov10 expres-sion plasmids. Confocal microscopy of the transfected live cells at 16 h posttransfection showed that the mRFP-tagged A3G colocalized with all YFP-tagged P body markers used in this experiment, confirming previous reports of A3G localization to P bodies (20, 46) (Fig. 1A).
Effects of P body marker proteins on HIV-1 infectivity and their virion incorporation. To explore the effects of P body markers on HIV-1 infectivity, viral particles were produced from 293T cells cotransfected with pHDV-EGFP, pC-Help⌬Vif, and F-A3G, F-Mov10, F-DCP1a, or F-DCP2 ex-pression plasmids, and equivalent amounts of p24 CA were used to infect TZM-bl cells. The results showed that both A3G and Mov10 decreased virus infectivity in a dose-dependent manner relative to the empty vector control, although A3G was a more potent inhibitor than Mov10 (Fig. 1B). Western blot analysis of the transfected cell lysates showed that all P body marker proteins were expressed (Fig. 1C). Analysis of concen-trated virions showed that A3G and Mov10 proteins were packaged into virus particles, but packaging of DCP1a and DCP2 could not be detected (Fig. 1C).
Mov10 inhibits replication-competent HIV-1. To explore whether the HIV-1 proteins Vif, Nef, Vpu, Vpr, and Env affect the ability of Mov10 to inhibit virus replication, HDV-EGFP and NL4-3 viral particles were produced with increasing amounts of the F-Mov10 expression plasmid, and the infectiv-ity of the viruses was determined (Fig. 2A). The expression of F-Mov10 in the viral producer cells decreased the infectivity of both the NL4-3 and HDV-EGFP viruses in a dose-dependent manner, indicating that expression of the viral accessory pro-teins and HIV-1 Env did not suppress the inhibitory effects of Mov10.
Investigation of potential interactions between A3G and Mov10.To explore potential synergistic or antagonistic inter-actions between A3G and Mov10, HDV-EGFP particles were produced with increasing amounts of pF-A3G in either the presence or absence of a fixed amount of pF-Mov10, and the infectivity of viruses after normalization for p24 CA was de-termined (Fig. 2B). The results indicated that the inhibitory effects of A3G and Mov10 were additive. Coexpression of F-Mov10 did not affect the inhibitory effects of F-A3G, since the fold reductions in infectivity at various concentrations of pF-A3G were not significantly different in the presence or absence of pF-Mov10 (ttest;Pof⬎0.05 for all F-A3G plasmid amounts).
Effect of P body marker protein expression in target cells on HIV-1 infectivity.To determine whether Mov10 affects HIV-1 infection in the target cells, we transfected 293T cells with plasmids that expressed mRFP, mRFP-A3G, mRFP-Mov10, mRFP-DCP1a, and mRFP-DCP2; 48 h later, we infected the transfected cells with HDV-EGFP and determined the per-centage of mRFP⫹ and mRFP⫺ cells that also expressed EGFP by fluorescence-activated cell sorter (FACS) analysis (Fig. 2C). The results indicated that the percentages of mRFP⫹ cells that were also EGFP⫹ were the same in all
on November 8, 2019 by guest
http://jvi.asm.org/
experiments; similarly, the percentages of mRFP⫺cells that were EGFP⫹ were also similar. The results indicated that expression of the P body marker proteins in the target cells of infection did not alter the infectivity of HIV-1.
Effect of A3G and Mov10 on proteolytic processing of HIV-1 Gag.To explore the mechanism by which Mov10 reduced viral infectivity, HIV-1 virions produced in the presence of empty vector, F-A3G, or F-Mov10 were lysed, and the virion proteins were analyzed by Western blotting using an p24 CA anti-body (Fig. 2D). The major product observed was the fully processed p24 CA protein. In addition, the amounts of unproc-essed p55 Gag protein as well as a partially procunproc-essed protein, presumably consisting of matrix plus CA (p41) or CA plus p2 plus nucleocapsid plus p1 plus p6 (p39), were significantly increased in the presence of F-A3G and F-Mov10. This result suggested that while the majority of HIV-1 Gag protein is fully processed in our experiments, overexpression of F-A3G and F-Mov10 in the virus-producing cells decreased the efficiency of HIV-1 Gag processing.
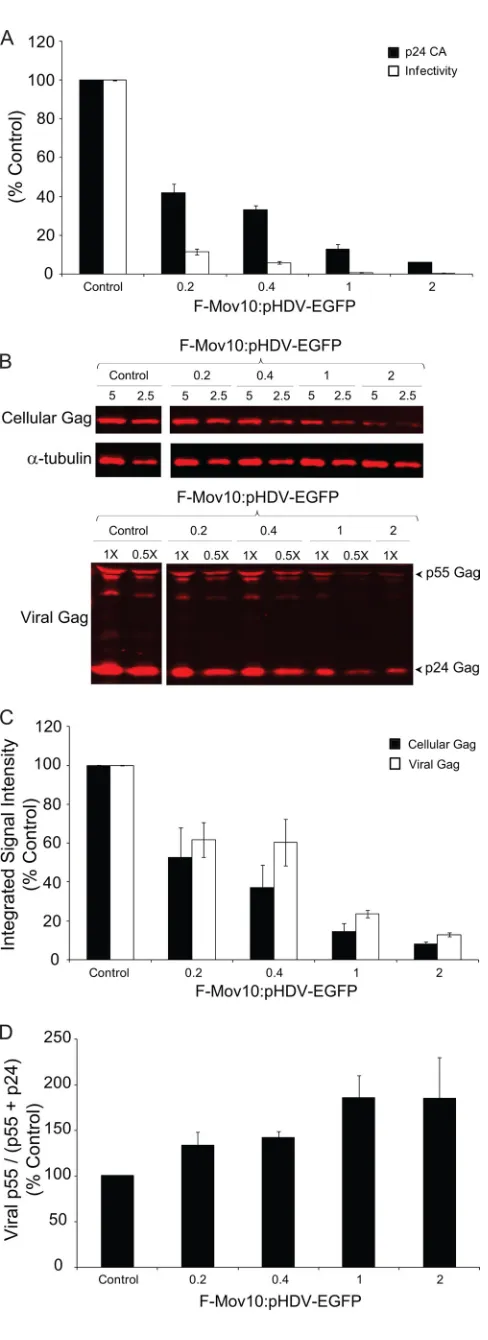
Effects of Mov10 on HIV-1 production and infectivity. To further explore the effects of Mov10 overexpression on HIV-1 infectivity, we transfected 293T cells with increasing amounts of F-Mov10 expression plasmid and measured virus production and virus infectivity (Fig. 3A). Mov10 overexpression de-creased virus production as the F-Mov10/HIV-1 DNA ratio increased, as determined by p24 CA levels in the culture su-pernatant, and ranged from 2.4- to 16.7-fold. The virus infec-tivity was also reduced by 3.7- to 15.0-fold, resulting in a total inhibition of 8.8- to 250-fold. We also observed a decrease in the steady-state levels of cellular Gag (p55) and a correspond-ing decrease in viral Gag (p55 plus p24) upon increascorrespond-ing the amounts of F-Mov10 (Fig. 3B and C), indicating that the de-crease in virus production was due to a dede-crease in the cellular levels of Gag and not a defect in virus release. There was an increase in viral p55 Gag levels (Fig. 3D) upon increasing the amounts of F-Mov10 expressed in the virus producer cells, indicating that the defect in proteolytic processing of viral Gag increased in a dose-dependent manner.
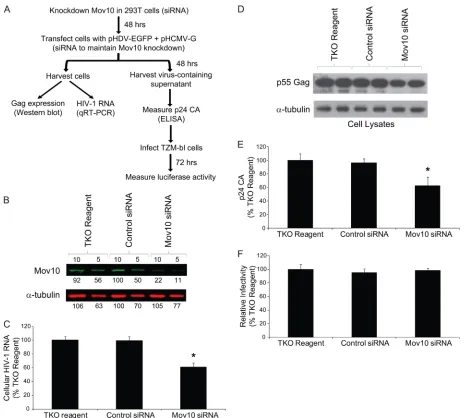
[image:4.585.66.260.83.634.2]Effect of siRNA-mediated knockdown of endogenous Mov10 on HIV-1 expression and infectivity.To explore the effects of Mov10 depletion on HIV-1 replication, siRNAs were used to knock down endogenous Mov10 in 293T cells, the cells were cotransfected 48 h later with the HIV-1 vector pHDV-EGFP and pHCMV-G, and the effects on HIV-1 RNA and Gag expression, virus production, and virus infectivity were deter-mined (Fig. 4A). Western blot analysis of the cells transfected with the TKO reagent only, with control siRNA, and Mov10 siRNA indicated that the Mov10 siRNA treatment reduced the
FIG. 1. P body protein colocalization with A3G, effects on HIV-1 infectivity, and virion incorporation. (A) A3G colocalizes with P body-associated proteins. HeLa cells were cotransfected with the mRFP-A3G expression plasmid and YFP-Mov10 (I), YFP-DCP1a (II), or YFP-DCP2 (III) expression plasmids. Live cells were visualized at 16 h posttransfection using laser scanning confocal microscopy. Arrows, P bodies; scale bar, 20m. (B) Relative infectivity of viruses produced in the presence of F-A3G, F-Mov10, F-DCP1a, or F-DCP2. 293T cells were cotransfected with pHDV-EGFP (3.33 g), pC-Help⌬Vif(2.5
g), pHCMV-G (0.67g), and different amounts (0 to 0.67g) of
Flag-tagged P body protein expression plasmids. Culture supernatants containing 5 ng of p24 CA were used to infect TZM-bl indicator cells, and luciferase activity was determined. The average infectivities are shown relative to the empty vector control (set to 100%). Error bars represent the standard errors from two independent experiments. (C) Virion incorporation of P body-associated proteins. Total cell lysates and concentrated virus preparations containing 30 ng of p24 CA were analyzed by Western blotting using Flag and p24 CA anti-bodies. The protein input for cell lysates was normalized using␣ -tu-bulin.
10244 BURDICK ET AL. J. VIROL.
on November 8, 2019 by guest
http://jvi.asm.org/
steady-state levels of Mov10 by approximately 80% (Fig. 4B). There was nearly a 2-fold reduction in HIV-1 RNA compared to those in the TKO reagent- and control siRNA-transfected cells (Fig. 4C) (ttest;Pof⬍0.05). This reduction in RNA likely resulted in a reduction in the steady-state levels of intracellular Gag (Fig. 4D). The p24 CA levels in the culture supernatant were reduced by nearly 2-fold (Fig. 4E) (ttest; Pof⬍0.05). Infection of TZM-bl cells with equivalent p24 CA amounts of virus indicated no differences in virus infectivity, implying that the endogenous levels of Mov10 in 293T producer cells do not significantly affect the efficiency of virus infection.
Virion incorporation efficiency of P body marker proteins.
Although the Western blot analysis shown in Fig. 1C indicated that Mov10 is packaged into virions, the proportion of virions that packaged Mov10 (defined here as the packaging effi-ciency) could not be determined. We therefore used single-virion analysis to determine the packaging efficiency of YFP-tagged P body proteins (Fig. 5). Viruses were produced from 293T cells that express HIV-1 RNAs containing Bgl stem-loops (e.g., pGag-BglSL and pGagCeFP-BglSL) as well as HIV-1 Gag or HIV-1 Gag-CeFP fusion proteins, along with a plasmid (pBgl-mCherry) that expresses an mCherry-tagged RNA
bind-FIG. 2. Investigation of mechanisms by which Mov10 inhibits HIV-1 replication. (A) Effect of Mov10 overexpression on infectivity of NL4-3 and HDV-EGFP. 293T cells were cotransfected with pNL4-3 (8g) or pHDV-EGFP (8g) and pHCMV-G (4g) and increasing amounts of F-Mov10 expression plasmid. Serial dilutions of culture supernatants were used to infect TZM-bl cells, and luciferase activity was determined. The labels indicate the ratio of F-Mov10 to HIV-1 DNA used for transfections. The data are plotted as relative infectivities, with the control virus (empty vector) set to 100%. Error bars represent standard errors from four independent experiments. (B) Interactions between Mov10 and A3G do not affect viral infectivity. 293T cells were cotransfected with pHDV-EGFP (3.33g) and pHCMV-G (0.67g), and increasing amounts (0 to 0.67g) of F-A3G expression plasmid were present during virus production in either the absence or presence of 0.67g of the F-Mov10 expression plasmid. Culture supernatants containing 5 ng of p24 CA were used to infect TZM-bl cells, and luciferase activity was determined. For viruses with different amounts of F-A3G but no F-Mov10, the data are plotted as relative infectivities, with the control virus (empty vector) set to 100%. For viruses with different amounts of F-A3G and a fixed amount of F-Mov10, the data are plotted as relative infectivities, with the virus having no F-A3G but with F-Mov10 set to 100%. Error bars represent standard errors from two independent experiments. (C) mRFP-Mov10 expression in target cells does not inhibit HIV-1 infection. Plasmids expressing mRFP-tagged P body-associated proteins were transfected into 293T cells; 48 h later, the transfected cells were infected with VSV-G pseudotyped pHDV-EGFP, and the proportions of mRFP⫺and mRFP⫹cells that were EGFP⫹were determined by FACS analysis. An mRFP expression vector was used as the control (set to 100%). Error bars represent standard errors from three independent experiments. (D) Effect of F-A3G and F-Mov10 on proteolytic processing of HIV-1 Gag. 293T cells were cotransfected with pHDV-EGFP (10g) and empty vector, F-A3G (2g), or F-Mov10 (4g) expression plasmids. Virions were lysed, and the virion proteins (35 or 25 ng of p24 CA) were analyzed by Western blotting using an anti-p24 CA antibody.
on November 8, 2019 by guest
http://jvi.asm.org/
ing protein that specifically binds to the Bgl stem-loops. As previously shown (8), there was excellent concordance between the CeFP and mCherry signals, indicating that most of the HIV-1 particles contained HIV-1 RNA (Fig. 5A). No signal was detected in the YFP channel, indicating low background. Next, virus-like particles (VLPs) produced in the presence of expression plasmids for YFP-A3G, YFP-Mov10, YFP-DCP1a, or YFP-DCP2 were analyzed (Fig. 5B). A high proportion of VLPs produced in the presence of YFP-A3G and YFP-Mov10 contained the YFP signal along with the CeFP and mCherry signal (merged and shifted panels labeled A3G and Mov10), but very few VLPs produced in the presence of YFP-DCP1a and YFP-DCP2 contained the YFP signal (merged and shifted panels labeled YFP-DCP1a and YFP-DCP2). We de-termined the efficiency with which the P body proteins were packaged into VLPs by quantifying the number of VLPs (de-fined as the particles that contain both CeFP [HIV-1 Gag] and mCherry [HIV-1 RNA] signals) that contained the YFP signal (Fig. 5C). The efficiency of YFP-A3G and YFP-Mov10 ranged from 70 to 88% and was dependent on the amounts of the P body protein expression plasmid transfected, indicating that these proteins were packaged efficiently. YFP-DCP1a and YFP-DCP2 were packaged into VLPs much less efficiently than YFP-A3G or YFP-Mov10 (1 to 2% and 10 to 17% of VLPs, respectively). Cellular expression of A3G, YFP-Mov10, YFP-DCP1a, and YFP-DCP2 were within 2-fold of each other (Fig. 5D).
[image:6.585.43.287.56.726.2]Effect of P body marker proteins on virion production and viral RNA packaging.We used single-virion analysis to deter-mine the effects of P body marker proteins on VLP production by quantifying the number of Gag-CeFP particles per field
FIG. 3. Effect of Mov10 overexpression on virus production, infec-tivity, intracellular Gag, and Gag processing. (A) Effect of Mov10 overexpression on virus production and infectivity. 293T cells were cotransfected with pHDV-EGFP (10 g for the F-Mov10/pHDV-EGFP ratios of 0.2, 0.4, and 1, and 5g for the ratio of 2), pHCMV-G (2g), and increasing amounts (0 to 10g) of the F-Mov10 expression plasmid. Culture supernatants were concentrated 40-fold by ultracen-trifugation, and the p24 CA levels in the supernatant were determined by ELISA. Serial dilutions of the virus were used to infect TZM-bl indicator cells, and luciferase activity was determined. The data are plotted as the levels of relative p24 CA proteins and relative infectiv-ities, with the control virus (empty vector) set to 100%. (B) Quantita-tive Western blot analysis of cellular and viral Gag using an anti-p24 CA antibody. Different amounts (5 and 2.5g; numbers shown above lanes) of cell lysates were loaded to facilitate protein quantitation. The lanes are labeled as described in the legend to panel A to indicate the ratio of F-Mov10 to pHDV-EGFP DNA used for transfections. The protein input was normalized using␣-tubulin. For the virus blot-ting, different dilutions (1⫻or 0.5⫻; numbers shown above lanes) of the concentrated virus were loaded to facilitate protein quantitation. (C) Quantitation of cellular and viral Gag levels with an increasing ratio of F-Mov10 to pHDV-EGFP DNA used for transfections. The integrated signal intensities of the p55 Gag and p24 Gag bands shown in panel B were determined for total cellular Gag (p55) and viral Gag (p55 plus p24) and shown relative to the empty vector control (set to 100%). (D) Effect of F-Mov10 on viral Gag processing. Viral Gag processing was determined by calculating the percentage of p55 of the total Gag (p55 plus p24) using the signal intensities of the Gag bands shown in panel B. These data were then plotted as percentages of the control virus. Error bars represent standard errors from two indepen-dent experiments.
10246 BURDICK ET AL. J. VIROL.
on November 8, 2019 by guest
http://jvi.asm.org/
(Fig. 5E). VLP production was inhibited in cells expressing YFP-A3G and YFP-Mov10 in a dose-dependent manner but not by cells expressing YFP-DCP1a and YFP-DCP2. We also verified that the VLP quantitation was within the linear range of the assay by analyzing 2-fold serial dilutions of three inde-pendent VLP samples (Fig. 5F). In addition, the relative levels
of CeFP⫹particles per field were similar to the relative viral Gag levels in the culture supernatant, as determined by quan-titative Western blot analysis (see Fig. S1 in the supplemental material), indicating that the virus production measurements obtained from single-virion analysis were in agreement with those obtained by Western blotting. When comparing
equiva-FIG. 4. Effect of Mov10 knockdown on HIV-1 RNA and Gag expression, virus production, and virus infectivity. (A) Outline of experimental design. 293T cells were transfected in the absence of any siRNA (TKO reagent only), with a control siRNA, and with a Mov10 siRNA; 48 h later, pHDV-EGFP (1.0g) and pHCMV-G (0.2g) DNA and siRNAs were cotransfected into the cells in order to produce virus and maintain Mov10 knockdown. Total RNA was extracted from one fraction of the cells 48 h after transfection, and HIV-1 RNA (U5target sequence) was quantified by real-time RT-PCR. Cell proteins from another fraction were analyzed by Western blotting using an anti-p24 CA antibody. The culture supernatants containing 5 ng of p24 CA were used to infect TZM-bl indicator cells, and luciferase activity was determined. (B) Knockdown of endogenous Mov10. Efficiency of Mov10 knockdown was assessed by quantitative Western blot analysis using an anti-Mov10 antibody 48 h after siRNA transfection. The protein input was normalized using␣-tubulin. Different amounts (ing; numbers shown above lanes) were loaded to facilitate protein quantitation, and the integrated signal intensities of the protein bands are shown relative to the control siRNA sample (set to 100%; numbers shown below each lane). (C) The knockdown of Mov10 reduces the steady-state levels of cellular HIV-1 RNA. PBGD RNA was used to normalize for the RNA input. (D) Knockdown of Mov10 decreases the intracellular steady-state levels of HIV-1 Gag. Cell lysates were analyzed by Western blotting using an anti-p24 CA antibody. The protein input was normalized using␣-tubulin. (E) Effect of Mov10 knockdown on virus production. The amounts of virion released from cells were quantified by determination of p24 CA using ELISA. (F) Knockdown of Mov10 does not alter virus infectivity. Culture supernatants containing 5 ng of p24 CA were used to infect TZM-bl cells, and luciferase activity was determined. The average results from panels C, E, and F are shown relative to the sample with TKO reagent only (set to 100%). Error bars represent standard errors from four independent experiments. Asterisks indicate statistical significance (ttest;Pof⬍0.05).
on November 8, 2019 by guest
http://jvi.asm.org/
[image:7.585.60.526.65.483.2]10248
on November 8, 2019 by guest
http://jvi.asm.org/
lent amounts of cellular expression of Mov10 and YFP-A3G (Fig. 5D), YFP-Mov10 (1.0 g DNA) decreases virus production by almost 90%, whereas YFP-A3G (0.5g DNA) decreases virus production by nearly 40%. YFP-DCP1a and YFP-DCP2 expression had no effect on virus production.
The majority of the virus particles (⬎85%) that were pro-duced from cells expressing the YFP-tagged P body markers contained the mCherry signal, indicating that most of the vi-ruses produced in the presence of the P body markers pack-aged HIV-1 RNA (Fig. 5G). Taken together, the single-virion analyses showed that YFP-Mov10 reduces VLP production and is efficiently packaged into HIV-1 VLPs.
Virion incorporation of P body marker proteins in the ab-sence of HIV-1 RNA.To determine the efficiency with which P body proteins were packaged into particles in the absence of HIV-1 RNA, viruses were produced from 293T cells that were cotransfected with plasmids that express a Gag-mCherry fusion protein and also express an HIV-1 RNA (pHIV-1-Gag-mCherry) or an RNA that does not have significant homology to the HIV-1 gag sequence (pSynGag-mCherry). We deter-mined the efficiency with which the P body proteins were pack-aged into VLPs by quantifying the number of VLPs (defined as the particles that contain mCherry [HIV-1 Gag]) that con-tained the YFP signal (Fig. 5H). YFP-A3G and YFP-Mov10 packaged efficiently into VLPs in the presence of an HIV-1 RNA (83 and 75%, respectively), whereas YFP-DCP1a and YFP-DCP2 packaged much less efficiently (⬎1 and 6%, re-spectively). YFP-A3G and YFP-Mov10 also packaged into particles produced in the absence of HIV-1 RNA (66 and 33%, respectively, in the presence of SynGag-mCherry), albeit with a lower efficiency than in the presence of HIV-1 RNA. Overall, these results indicate that HIV-1 RNA is not required for A3G and Mov10 incorporation into HIV-1 VLPs but may increase the efficiency of their virion incorporation.
Effect of Mov10 on Gag and EGFP expression.To determine whether the effect of YFP-Mov10 expression on the steady-state levels of HIV-1 Gag was specific for HIV-1 Gag or that expression had a general effect on other cellular proteins, we cotransfected 293T cells with a control plasmid, YFP-Mov10, or YFP-DCP1a along with HIV-1 Gag (pGag-BglSL) and a plasmid that expresses EGFP (pEGFP-N1). We then deter-mined the steady-state levels of HIV-1 Gag, EGFP, and␣
[image:9.585.300.542.68.322.2]-tu-bulin by quantitative Western blot analysis (Fig. 6A and B). The results showed that YFP-Mov10 expression reduced the steady-state levels of both HIV-1 Gag and EGFP to 40% and 50%, respectively, compared to that of the control plasmid. In
FIG. 5. Single-virion analyses of YFP-tagged P body protein virion incorporation and quantitation of virus production. (A) Representative images of virus particles labeled with Gag-CeFP and HIV-1 RNA labeled with Bgl-mCherry. No YFP signal was detected in the absence of YFP-tagged protein. In the “merge and shifted” panel, mCherry signal was shifted 6 pixels to the right of the CeFP signal to allow identification of colocalization. One-sixteenth of a representative image is shown. (B) Packaging of YFP-tagged P body-associated proteins into virus particles. All panels are merged and shifted images, where the mCherry and YFP signals were shifted 6 pixels and 12 pixels, respectively, to the right of the CeFP signal. The solid line circle indicates a virus particle containing YFP-A3G, whereas the dashed line circle indicates a virus particle that does not contain YFP-A3G. One-sixteenth of a representative image is shown. (C) Virion incorporation of YFP-tagged P body proteins. Packaging efficiency was calculated by determining the percentage of CeFP⫹(Gag) plus mCherry⫹(HIV-1 RNA) particles that contained the YFP signal (YFP-tagged proteins). (D) Cellular expression of YFP-tagged proteins. After the virus was collected and filtered for single-virion analysis, the cellular expression of YFP for each sample was measured by FACS analysis. The mean fluorescence intensity of the YFP-A3G (1-g) sample was set to 100%. (E) Mov10 and A3G decrease virus production. The average particles (CeFP signal) per field were used as a measurement of virus production; the empty control vector was set to 100%. (F) Effect of serial 2-fold dilution of virus on quantitation of CeFP⫹particles per field. Average result for three virus samples is shown. (G) Effect of P body proteins on efficiency of viral RNA packaging. RNA packaging efficiency was calculated by determining the percentage of CeFP⫹particles that displayed the mCherry signal. (H) Virion incorporation of YFP-tagged P body proteins in the absence of HIV-1 RNA. Packaging efficiency was calculated by determining the percentage of mCherry⫹(Gag) particles that contained the YFP signal (YFP-tagged proteins). The numbers shown above each sample name indicate the amount (ing) of transfected DNA. (C, D, E, and G) Error bars represent standard errors from two independent experiments.
FIG. 6. Mov10 decreases steady-state levels of intracellular HIV-1 Gag and EGFP but not␣-tubulin. (A) 293T cells were cotransfected with an HIV-1 Gag expression vector (pGag-BglSL; 0.5g), an EGFP expression vector (pEGFP-N1; 0.025g) and empty vector (1.0g), YFP-Mov10 (1.0g) or YFP-DCP1a (0.5g). Total cell lysates were analyzed at 16 h posttransfection by quantitative Western blot analysis with anti-p24 CA, anti-GFP, and anti-␣-tubulin antibodies. Different amounts (20g to 2.5 g; numbers shown above lanes) of the cell lysates were loaded to facilitate protein quantitation. (B) The inte-grated signal intensities of the p55 Gag, EGFP, and␣-tubulin protein bands from the Western blots shown in panel A are shown relative to the empty vector control (20-g) sample (set to 100%). The number shown above each sample name indicates the amount (ing) of pro-tein loaded. Error bars represent standard errors from two experiments.
on November 8, 2019 by guest
http://jvi.asm.org/
contrast, YFP-Mov10 did not affect the intracellular steady-state levels of ␣-tubulin. YFP-DCP1a had no effect on the intracellular steady-state levels of HIV-1 Gag, EGFP, or␣ -tu-bulin. These results indicated that the effect of YFP-Mov10 expression on the protein steady-state levels is not specific for HIV-1 Gag and may be a general effect that includes other cellular proteins.
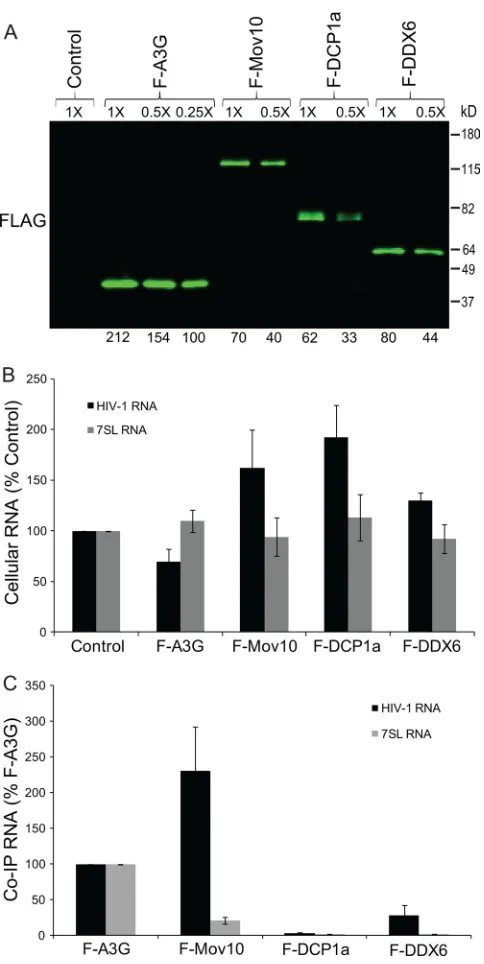
Association of P body marker proteins with HIV-1 RNA.To determine if the P body proteins are associated with HIV-1 RNA, 293T cells were cotransfected with pHDV-EGFP and expression plasmids for A3G, Mov10, DCP1a, or F-DDX6. Western blot analysis showed that all of the P body marker proteins were expressed (data not shown). The cell lysates were subjected to immunoprecipitation; quantitative Western blot analysis of the immunoprecipitated proteins showed that the levels of immunoprecipitated F-Mov10, F-DCP1a, and F-DDX6 were 6.2-, 6.7-, and 5.2-fold lower than the levels of immunoprecipitated F-A3G (Fig. 7A). The intra-cellular levels of HIV-1 RNA were quantified in the cells cotransfected with F-A3G, F-Mov10, F-DCP1a, and F-DDX6 (Fig. 7B). RNA was extracted from the immunoprecipitates, and the coimmunoprecipitated RNA was quantified by real-time RT-PCR and normalized to the cellular expression and the immunoprecipitated protein amount (Fig. 7C). Relative to the amount of HIV-1 RNA that coimmunoprecipitated with F-A3G, more HIV-1 RNA was associated with F-Mov10 (231%), less RNA was associated with F-DDX6 (28%), and little or no RNA was associated with F-DCP1a (3%). Com-pared to the amount of 7SL RNA associated with F-A3G (set to 100%), some 7SL RNA was associated with F-Mov10 (21%), whereas little to no 7SL RNA associated with F-DCP1a (2%) or F-DDX6 (2%). The immunoprecipitated HIV-1 RNA and 7SL RNA levels for the control (empty pcDNA3.1 vector) were significantly lower than that for F-A3G (⬍1%), indicating low nonspecific RNA binding (data not shown).
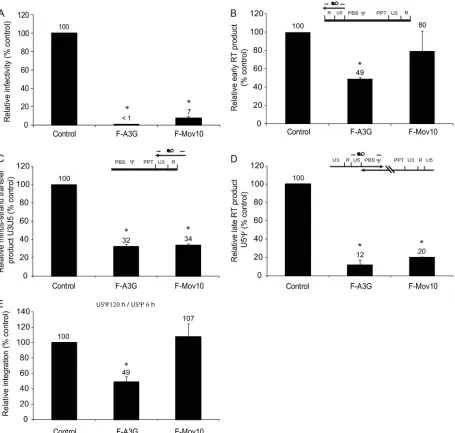
[image:10.585.43.285.73.555.2]Effect of Mov10 overexpression on reverse transcription.To determine the effect of Mov10 overexpression on viral replica-tion, we performed real-time PCR analysis of reverse tran-scription products derived from virions produced in the pres-ence of control vector, F-A3G, or F-Mov10. In these experiments, the viral infectivity was reduced to⬍1% and 7% of the control in the presence of F-A3G and F-Mov10, respec-tively (Fig. 8A). Early reverse transcription products quantified using the RU5 primer-probe set were reduced to 49% in the presence of F-A3G but were not significantly reduced in the presence of F-Mov10 (80%) (Fig. 8B). Reverse transcription products detected using the U3R primer-probe set, which de-tects products near the 3⬘end of the genome, were reduced to 32 and 34% of the control in the presence of F-A3G and F-Mov10, respectively (Fig. 8C). Analysis of the late reverse
FIG. 7. Association of P body proteins with HIV-1 and 7SL RNA. (A) Immunoprecipitation of cellular RNA-protein complexes using anti-Flag antibody. 293T cells were cotransfected with pHDV-EGFP (7.0g) and empty pcDNA3.1 (control), pF-A3G (3.0g), pF-Mov10 (18.0g), pF-DCP1a (12.0g), or pF-DDX6 (12.0g). Cell lysates were collected at 48 h posttransfection and were subjected to noprecipitation using an anti-Flag antibody. The efficiency of immu-noprecipitation was determined by quantitative Western blot analysis using an anti-Flag antibody. Different dilutions of the immunoprecipi-tates were analyzed to facilitate protein quantitation (numbers shown above lanes). The integrated signal intensities of the protein bands are shown relative to the 0.25⫻ F-A3G sample (set to 100%; numbers shown below each lane); average result from 3 independent experi-ments is shown. (B) Effect of P body proteins on intracellular steady-state levels of HIV-1 and 7SL RNA. Total cellular RNA was extracted from a fraction of the transfected 293T cells, and the amounts of HIV-1 and 7SL RNAs were quantified using real-time RT-PCR. PBGD RNA was used to adjust for small (⬍10%) differences in RNA recovery. (C) Quantitation of P body protein-associated HIV-1 and
7SL RNA. Total RNA was isolated from immunoprecipitated cellular RNA-protein complexes obtained with anti-Flag antibody, and the HIV-1 and 7SL RNAs were quantified using real-time RT-PCR. The coimmunoprecipitated (Co-IP) RNA levels were normalized to the cellular RNA levels and the immunoprecipitated protein amount. Error bars represent standard errors from three independent experi-ments.
10250 BURDICK ET AL. J. VIROL.
on November 8, 2019 by guest
http://jvi.asm.org/
transcription products near the 5⬘end of the genome with the U5 primer-probe set indicated that F-A3G and F-Mov10 reduced the late reverse transcription products to 12% and 20% the control, respectively (Fig. 8D). These results indicated that the presence of Mov10 did not have much effect on the initiation of reverse transcription but progressively inhibited later stages of reverse transcription. To determine whether the presence of Mov10 inhibited HIV-1 DNA integration, we com-pared the ratio of the amounts of the U5products at 5 days
after infection and 6 h after infection (Fig. 8E). As expected, the presence of F-A3G reduced viral DNA integration to 49%; however, the presence of F-Mov10 had no effect on HIV-1 DNA integration.
DISCUSSION
[image:11.585.66.521.69.502.2]The results of these studies show that overexpression of Mov10 in 293T cells results in potent inhibition of HIV-1
FIG. 8. Real-time PCR analysis of the effects of A3G and Mov10 on HIV-1 reverse transcription. (A) The effects of F-A3G (2g DNA) and F-Mov10 (4g) on pHDV-EGFP infectivity were determined by flow cytometry. HDV-EGFP produced in the absence of A3G or Mov10 yielded 10 to 12.4% GFP⫹cells (set to 100%). (B) Quantitation of early reverse transcription products using an RU5 primer-probe set. (C) Quantitation of minus-strand transfer products using a U3R primer-probe set. (D) Quantitation of late reverse transcription products using a U5primer-probe set. (B to D) All reverse transcription products were detected at 6 h postinfection; the HDV-EGFP copy numbers in the absence of F-A3G or F-Mov10 ranged from 14,800 to 30,200 and were set to 100%. CCR5 gene copy numbers were determined and used to normalize for the DNA input. Control HDV-EGFP was heat inactivated and used in a parallel infection to determine the background from carryover of transfected DNA (⬍3%). The schematics show viral RNA (thick line), viral DNA (thin line), and approximate locations of the primer-probe sets (thin arrows and black and white circles). (E) Relative integration determined by comparing the U5 product accumulation at 120 h to the U5 product accumulation at 6 h. Integration efficiency in the absence of F-A3G or F-Mov10 was set to 100%. Error bars represent standard errors from two independent experiments. Asterisks indicate statistically significant differences from the control (ttest;P⬍0.05).
on November 8, 2019 by guest
http://jvi.asm.org/
replication at multiple stages, which include virus production, proteolytic processing of HIV-1 Gag, and reverse transcrip-tion. We observed that overexpression of Mov10 in 293T cells resulted in dose-dependent decreases in virus production (2- to 17-fold) and virus infectivity (4- to 15-fold), thereby inhibiting viral replication by 9- to 250-fold. The virus production defect was at least partly due to a reduction in the steady-state levels of intracellular Gag; additional studies are needed to deter-mine whether the reduction in Gag expression is due to a reduced rate of synthesis or an increased rate of degradation. Our observation that Mov10 overexpression results in the re-duction of Gag and EGFP implies that Mov10 did not specif-ically affect HIV-1 Gag but also affected the steady-state levels of other cellular proteins. Mov10 has been reported to be associated with the eukaryotic translational initiation factor eIF6, which suppresses ribosomal subunit association and in-hibits translation (6, 9); in addition, our results show that Mov10 associates with HIV-1 RNA, suggesting that Mov10 may reduce the amount of HIV-1 RNA available for transla-tion. However, this hypothesis remains to be explored.
We also observed that Mov10 was efficiently packaged into virions. Overexpression of Mov10 in the virus-producing cells correlated with a reduced efficiency of reverse transcription and proteolytic processing of HIV-1 Gag. Virions produced in the presence of Mov10 did not exhibit a defect in the initiation of reverse transcription but did exhibit reduced production of late reverse transcription products. Additional studies are needed to determine the mechanism by which Mov10 inhibits reverse transcription. Mov10 did not inhibit viral DNA inte-gration and did not increase the viral mutation rate (data not shown). The reduction in late reverse transcription products (5-fold) did not fully account for the reduction in viral infec-tivity (14-fold), suggesting that other steps in viral replication may be inhibited.
Although the knockdown of endogenous Mov10 led to a nearly 2-fold reduction in virus production, there was no discernible impact on the infectivity of the viruses after normalization for the p24 input. The results of Mov10 knockdown are in contrast to previous reports that suppres-sion of several other P body-associated proteins, including DDX6, LSM-1, XRN1, DGCR8, Dicer, and Drosha, in-creases HIV-1 production (7, 31).
Our results show that Mov10 specifically interacts with HIV-1 RNA and that Mov10 virion incorporation is as efficient as A3G virion incorporation. We also demonstrate that HIV-1 RNA is not essential for Mov10 virion incorporation but may increase the efficiency of virion incorporation. Additional stud-ies are needed to determine whether Mov10’s RNA binding ability is essential for virion incorporation. However, overex-pression of DDX6, another P body marker protein and a known RNA helicase, in 293T producer cells did not signifi-cantly inhibit the infection efficiency of HDV-EGFP (data not shown). Therefore, the RNA binding activity of Mov10 is likely to be necessary but not sufficient to explain its inhibitory effect on virus infectivity.
The results of our studies are in general agreement with those recently reported (19, 44). Specifically, our studies agree that Mov10 overexpression results in a reduction of HIV-1 infectivity. Our results confirm the observation of Furtak et al. (19) that Mov10 overexpression results in a reduction in virus
production and the observations of Wang et al. (44) that Mov10 is packaged into virions and that Mov10 does not in-hibit HIV-1 replication in target cells. In addition, our studies provide several new insights and show that Mov10 virion incorporation is as efficient as A3G incorporation, that Mov10 overexpression is associated with a reduction in pro-teolytic processing, that Mov10 overexpression is associated with a reduction in the steady-state levels of HIV-1 Gag and other cellular proteins, and that Mov10 is associated with HIV-1 RNA.
Furtak et al. (19) and Wang et al. (44) performed Mov10 knockdown experiments and observed a 2-fold decrease and 3-fold increase in virion infectivity, respectively; we observed a 2-fold reduction in virus production but no effect on the infec-tivity of the virions produced. Thus, our conclusion that Mov10 knockdown has little or no effect on virus production or infec-tivity and their conclusions that Mov10 knockdown modestly affects viral infectivity differ slightly with respect to the inter-pretation of similar results. It is also possible that differences in the efficiency of knockdown may have resulted in the minor differences in virus infectivity (2-fold reduction versus no ef-fect). Furtak et al. (19) and Wang et al. (44) observed a defect in the initiation of reverse transcription, while we did not observe a significant decrease in the amounts of early reverse transcription products. This difference in the results may have been due to differences in the levels of Mov10 expressed in the virus producer cells. All three studies observed a decrease in late viral reverse transcripts.
In summary, Mov10 overexpression results in potent inhibi-tion of HIV-1 replicainhibi-tion at multiple stages of replicainhibi-tion, which include virus production, proteolytic processing of Gag, and reverse transcription. Additional studies that further elu-cidate the interactions between Mov10 and HIV-1 replication may provide insights into host defense mechanisms and HIV-1 strategies for overcoming these defenses.
ACKNOWLEDGMENTS
We thank Stephen Hughes, Eric Freed, and Vineet KewalRamani for reviewing the manuscript prior to submission, Vineet KewalRa-mani for sharing unpublished results, and Eric Freed for valuable input during manuscript preparation.
This research was supported in part by the Intramural Research Program of the NIH, Center for Cancer Research, National Cancer Institute.
The content of this publication does not necessarily reflect the views or policies of the Department of Health and Human Services, nor does mentions of trade names, commercial products, or organizations imply endorsement by the U.S. Government.
REFERENCES
1.Adachi, A., H. E. Gendelman, S. Koenig, T. Folks, R. Willey, A. Rabson, and M. A. Martin.1986. Production of acquired immunodeficiency syndrome-associated retrovirus in human and nonhuman cells transfected with an
infectious molecular clone. J. Virol.59:284–291.
2.Beckham, C. J., and R. Parker.2008. P bodies, stress granules, and viral life
cycles. Cell Host Microbe3:206–212.
3.Boussif, O., F. Lezoualc’h, M. A. Zanta, M. D. Mergny, D. Scherman, B. Demeneix, and J. P. Behr.1995. A versatile vector for gene and oligonucleo-tide transfer into cells in culture and in vivo: polyethylenimine. Proc. Natl.
Acad. Sci. U. S. A.92:7297–7301.
4.Brass, A. L., D. M. Dykxhoorn, Y. Benita, N. Yan, A. Engelman, R. J. Xavier, J. Lieberman, and S. J. Elledge.2008. Identification of host proteins re-quired for HIV infection through a functional genomic screen. Science
319:921–926.
5.Campbell, R. E., O. Tour, A. E. Palmer, P. A. Steinbach, G. S. Baird, D. A. Zacharias, and R. Y. Tsien.2002. A monomeric red fluorescent protein.
Proc. Natl. Acad. Sci. U. S. A.99:7877–7882.
10252 BURDICK ET AL. J. VIROL.
on November 8, 2019 by guest
http://jvi.asm.org/
6.Ceci, M., C. Gaviraghi, C. Gorrini, L. A. Sala, N. Offenhauser, P. C. Marchi-sio, and S. Biffo.2003. Release of eIF6 (p27BBP) from the 60S subunit
allows 80S ribosome assembly. Nature426:579–584.
7.Chable-Bessia, C., O. Meziane, D. Latreille, R. Triboulet, A. Zamborlini, A. Wagschal, J. M. Jacquet, J. Reynes, Y. Levy, A. Saib, Y. Bennasser, and M. Benkirane.2009. Suppression of HIV-1 replication by microRNA effectors.
Retrovirology6:26.
8.Chen, J., O. Nikolaitchik, J. Singh, A. Wright, C. E. Bencsics, J. M. Coffin, N. Ni, S. Lockett, V. K. Pathak, and W. S. Hu.2009. High efficiency of HIV-1 genomic RNA packaging and heterozygote formation revealed by single
virion analysis. Proc. Natl. Acad. Sci. U. S. A.106:13535–13540.
9.Chendrimada, T. P., K. J. Finn, X. Ji, D. Baillat, R. I. Gregory, S. A. Liebhaber, A. E. Pasquinelli, and R. Shiekhattar.2007. MicroRNA silencing
through RISC recruitment of eIF6. Nature447:823–828.
10.Chendrimada, T. P., R. I. Gregory, E. Kumaraswamy, J. Norman, N. Cooch, K. Nishikura, and R. Shiekhattar.2005. TRBP recruits the Dicer complex to
Ago2 for microRNA processing and gene silencing. Nature436:740–744.
11.Chertova, E., O. Chertov, L. V. Coren, J. D. Roser, C. M. Trubey, J. W. Bess, Jr., R. C. Sowder II, E. Barsov, B. L. Hood, R. J. Fisher, K. Nagashima, T. P. Conrads, T. D. Veenstra, J. D. Lifson, and D. E. Ott.2006. Proteomic and biochemical analysis of purified human immunodeficiency virus type 1
pro-duced from infected monocyte-derived macrophages. J. Virol.80:9039–9052.
12.Chukkapalli, V., I. B. Hogue, V. Boyko, W. S. Hu, and A. Ono.2008. Inter-action between the human immunodeficiency virus type 1 Gag matrix do-main and phosphatidylinositol-(4,5)-bisphosphate is essential for efficient
gag membrane binding. J. Virol.82:2405–2417.
13.Cook, H. A., B. S. Koppetsch, J. Wu, and W. E. Theurkauf.2004. The Drosophila SDE3 homolog armitage is required for oskar mRNA silencing
and embryonic axis specification. Cell116:817–829.
14.Dalmay, T., R. Horsefield, T. H. Braunstein, and D. C. Baulcombe.2001. SDE3 encodes an RNA helicase required for post-transcriptional gene
si-lencing in Arabidopsis. EMBO J.20:2069–2078.
15.Eulalio, A., I. Behm-Ansmant, and E. Izaurralde.2007. P bodies: at the
crossroads of post-transcriptional pathways. Nat. Rev. Mol. Cell Biol.8:9–22.
16.Fairman-Williams, M. E., U. P. Guenther, and E. Jankowsky.2010. SF1 and
SF2 helicases: family matters. Curr. Opin. Struct. Biol.20:313–324.
17.Frankel, A. D., and J. A. Young.1998. HIV-1: fifteen proteins and an RNA.
Annu. Rev. Biochem.67:1–25.
18.Friew, Y. N., V. Boyko, W. S. Hu, and V. K. Pathak.2009. Intracellular interactions between APOBEC3G, RNA, and HIV-1 Gag: APOBEC3G multimerization is dependent on its association with RNA. Retrovirology
6:56.
19.Furtak, V., A. Mulky, S. A. Rawlings, L. Kozhaya, K. Lee, V. N. Kewalra-mani, and D. Unutmaz.2010. Perturbation of the P-body component Mov10
inhibits HIV-1 infectivity. PLoS One5:e9081.
20.Gallois-Montbrun, S., B. Kramer, C. M. Swanson, H. Byers, S. Lynham, M. Ward, and M. H. Malim.2007. Antiviral protein APOBEC3G localizes to ribonucleoprotein complexes found in P bodies and stress granules. J. Virol.
81:2165–2178.
21.Haussecker, D., D. Cao, Y. Huang, P. Parameswaran, A. Z. Fire, and M. A.
Kay.2008. Capped small RNAs and MOV10 in human hepatitis delta virus
replication. Nat. Struct. Mol. Biol.15:714–721.
22.Kao, S., M. A. Khan, E. Miyagi, R. Plishka, A. Buckler-White, and K. Strebel.2003. The human immunodeficiency virus type 1 Vif protein reduces intracellular expression and inhibits packaging of APOBEC3G (CEM15), a
cellular inhibitor of virus infectivity. J. Virol.77:11398–11407.
23.Konig, R., Y. Zhou, D. Elleder, T. L. Diamond, G. M. Bonamy, J. T. Irelan, C. Y. Chiang, B. P. Tu, P. D. De Jesus, C. E. Lilley, S. Seidel, A. M. Opaluch, J. S. Caldwell, M. D. Weitzman, K. L. Kuhen, S. Bandyopadhyay, T. Ideker, A. P. Orth, L. J. Miraglia, F. D. Bushman, J. A. Young, and S. K. Chanda.
2008. Global analysis of host-pathogen interactions that regulate early-stage
HIV-1 replication. Cell135:49–60.
24.Kotsopoulou, E., V. N. Kim, A. J. Kingsman, S. M. Kingsman, and K. A. Mitrophanous.2000. A Rev-independent human immunodeficiency virus type 1 (HIV-1)-based vector that exploits a codon-optimized HIV-1 gag-pol
gene. J. Virol.74:4839–4852.
25.Kozak, S. L., M. Marin, K. M. Rose, C. Bystrom, and D. Kabat.2006. The anti-HIV-1 editing enzyme APOBEC3G binds HIV-1 RNA and messenger RNAs that shuttle between polysomes and stress granules. J. Biol. Chem.
281:29105–29119.
26.Mbisa, J. L., R. Barr, J. A. Thomas, N. Vandegraaff, I. J. Dorweiler, E. S. Svarovskaia, W. L. Brown, L. M. Mansky, R. J. Gorelick, R. S. Harris, A. Engelman, and V. K. Pathak.2007. Human immunodeficiency virus type 1 cDNAs produced in the presence of APOBEC3G exhibit defects in
plus-strand DNA transfer and integration. J. Virol.81:7099–7110.
27.Mbisa, J. L., W. Bu, and V. K. Pathak.2010. APOBEC3F and APOBEC3G
inhibit HIV-1 DNA integration by different mechanisms. J. Virol.84:5250–
5259.
28.Mbisa, J. L., K. A. Delviks-Frankenberry, J. A. Thomas, R. J. Gorelick, and V. K. Pathak.2009. Real-time PCR analysis of HIV-1 replication post-entry
events. Methods Mol. Biol.485:55–72.
29.Meister, G., M. Landthaler, L. Peters, P. Y. Chen, H. Urlaub, R. Luhrmann, and T. Tuschl.2005. Identification of novel argonaute-associated proteins.
Curr. Biol.15:2149–2155.
30.Mochizuki, H., J. P. Schwartz, K. Tanaka, R. O. Brady, and J. Reiser.1998. High-titer human immunodeficiency virus type 1-based vector systems for
gene delivery into nondividing cells. J. Virol.72:8873–8883.
31.Nathans, R., C. Y. Chu, A. K. Serquina, C. C. Lu, H. Cao, and T. M. Rana.
2009. Cellular microRNA and P bodies modulate host-HIV-1 interactions.
Mol. Cell34:696–709.
32.Onafuwa-Nuga, A. A., A. Telesnitsky, and S. R. King.2006. 7SL RNA, but not the 54-kd signal recognition particle protein, is an abundant component
of both infectious HIV-1 and minimal virus-like particles. RNA12:542–546.
33.Parker, R., and U. Sheth.2007. P bodies and the control of mRNA
trans-lation and degradation. Mol. Cell25:635–646.
34.Russell, R. A., and V. K. Pathak.2007. Identification of two distinct human immunodeficiency virus type 1 Vif determinants critical for interactions with
human APOBEC3G and APOBEC3F. J. Virol.81:8201–8210.
35.Russell, R. A., J. Smith, R. Barr, D. Bhattacharyya, and V. K. Pathak.2009. Distinct domains within APOBEC3G and APOBEC3F interact with
sepa-rate regions of human immunodeficiency virus type 1 Vif. J. Virol.83:1992–
2003.
36.Sayah, D. M., E. Sokolskaja, L. Berthoux, and J. Luban.2004. Cyclophilin A retrotransposition into TRIM5 explains owl monkey resistance to HIV-1.
Nature430:569–573.
37.Sheehy, A. M., N. C. Gaddis, J. D. Choi, and M. H. Malim.2002. Isolation of a human gene that inhibits HIV-1 infection and is suppressed by the viral
Vif protein. Nature418:646–650.
38.Stremlau, M., C. M. Owens, M. J. Perron, M. Kiessling, P. Autissier, and J. Sodroski.2004. The cytoplasmic body component TRIM5alpha restricts
HIV-1 infection in Old World monkeys. Nature427:848–853.
39.Svarovskaia, E. S., H. Xu, J. L. Mbisa, R. Barr, R. J. Gorelick, A. Ono, E. O. Freed, W. S. Hu, and V. K. Pathak.2004. Human apolipoprotein B mRNA-editing enzyme-catalytic polypeptide-like 3G (APOBEC3G) is incorporated into HIV-1 virions through interactions with viral and nonviral RNAs.
J. Biol. Chem.279:35822–35828.
40.Tomari, Y., T. Du, B. Haley, D. S. Schwarz, R. Bennett, H. A. Cook, B. S. Koppetsch, W. E. Theurkauf, and P. D. Zamore. 2004. RISC assembly
defects in the Drosophila RNAi mutant armitage. Cell116:831–841.
41.Unutmaz, D., V. N. KewalRamani, S. Marmon, and D. R. Littman.1999. Cytokine signals are sufficient for HIV-1 infection of resting human T
lym-phocytes. J. Exp. Med.189:1735–1746.
42.Van Damme, N., D. Goff, C. Katsura, R. L. Jorgenson, R. Mitchell, M. C. Johnson, E. B. Stephens, and J. Guatelli.2008. The interferon-induced protein BST-2 restricts HIV-1 release and is downregulated from the cell
surface by the viral Vpu protein. Cell Host Microbe3:245–252.
43.Wang, T., C. Tian, W. Zhang, P. T. Sarkis, and X. F. Yu.2008. Interaction with 7SL RNA but not with HIV-1 genomic RNA or P bodies is required for
APOBEC3F virion packaging. J. Mol. Biol.375:1098–1112.
44.Wang, X., Y. Han, Y. Dang, W. Fu, T. Zhou, R. G. Ptak, and Y. H. Zheng.
2010. Moloney leukemia virus 10 (MOV10) protein inhibits retrovirus
rep-lication. J. Biol. Chem.285:14346–14355.
45.Wei, X., J. M. Decker, H. Liu, Z. Zhang, R. B. Arani, J. M. Kilby, M. S. Saag, X. Wu, G. M. Shaw, and J. C. Kappes.2002. Emergence of resistant human immunodeficiency virus type 1 in patients receiving fusion inhibitor (T-20)
monotherapy. Antimicrob. Agents Chemother.46:1896–1905.
46.Wichroski, M. J., G. B. Robb, and T. M. Rana.2006. Human retroviral host restriction factors APOBEC3G and APOBEC3F localize to mRNA
process-ing bodies. PLoS Pathog.2:e41.
47.Yee, J. K., T. Friedmann, and J. C. Burns.1994. Generation of high-titer pseudotyped retroviral vectors with very broad host range. Methods Cell
Biol.43(Pt. A):99–112.
48.Yeung, M. L., L. Houzet, V. S. Yedavalli, and K. T. Jeang.2009. A genome-wide short hairpin RNA screening of Jurkat T-cells for human proteins
contributing to productive HIV-1 replication. J. Biol. Chem. 284:19463–
19473.
49.Zheng, Y. H., D. Irwin, T. Kurosu, K. Tokunaga, T. Sata, and B. M. Peterlin.
2004. Human APOBEC3F is another host factor that blocks human
immu-nodeficiency virus type 1 replication. J. Virol.78:6073–6076.
50.Zhou, H., M. Xu, Q. Huang, A. T. Gates, X. D. Zhang, J. C. Castle, E. Stec, M. Ferrer, B. Strulovici, D. J. Hazuda, and A. S. Espeseth.2008. Genome-scale RNAi screen for host factors required for HIV replication. Cell Host
Microbe4:495–504.