www.parliament.uk/commons-library | intranet.parliament.uk/commons-library | [email protected] | @commonslibrary
BRIEFING PAPER
Number 6233, 19 October 2015
Converter academies:
Statistics
By
Paul Bolton
Inside:
1. Number of converters
2. What types of schools have
converted?
3. Exam performance
Contents
Summary 2
1. Number of converters 3
1.1 Timeline 3
1.2 Schools in the process of conversion 4
2. What types of schools have converted? 4
2.1 Schools 4
2.2 Pupil intake 5
2.3 Geography 5
3. Exam performance 6
Summary
The Government introduced the Academies Bill at the end of May 2010. The Academies Act 2010 came into force in time to allow the first converter academies to start in
September 2010. The legislation streamlined the process of converting to an academy and also allowed primary and special schools to become academies. Up to the start of
September 2015 a total of 3,420 schools had converted to become academies and a further 782 had applied for conversion. Secondary schools dominated the first two years of conversions, but since then more primaries have converted and now a majority of converter academies are primary schools. A greater proportion of secondaries have converted; currently 41%. The secondary schools which have converted so far had free school meal eligibility rates around half the national average.
The academies ‘model’ introduced by the previous Government was sponsor led and focussed on poorly performing secondary schools in more deprived areas. Both types of academies are state funded schools which are independent of local authorities. Their funding is intended to replicate the level they would had received if they were still maintained by the local authority with extra funding only to cover services no longer provided by the local authority. Academies have greater freedoms over how they use their budgets, set staff pay and conditions and deliver the curriculum.
This note looks at data on the number of converter academies and the types of schools that have decided to convert. The note Sponsored Academies: Statistics looks at the growth of these academies since 2003, compares their intake with other secondary schools and goes into some detail on performance data.
The Government published the Academies Annual Report 2013/14 in June 2015. It includes background, case studies, numbers of academies, type, location, performance, exclusions, pupil characteristics, etc. In 2012 the National Audit Office published a report into the financial aspects of academies: Managing the expansion of the academies programme. The DfE’s website includes a substantial amount of information about academies including lists of Open academies and academy projects in development which are updated monthly. Readers who are interested in the very latest number of converter academies should look at these pages. This note is intended to look at evidence on the broader issues and background, rather than to simply mirror these official lists.
1.
Number of converters
The first schools converted to academy status in September 2010. On 1 September 2015 a total of 3,420 schools had done so. The majority of converters (54%) were primary schools. The 1,393 converter
secondaries represents 41% of all current state funded secondary schools, 55% if sponsored academies are included. The 1,861 primary academy converters were 11% of all state funded primary schools and the 132 special academies were 14% of all state funded special schools. In addition 31 Pupil Referral Units and three 16+ institutions have converted.1
1.1
Timeline
The chart below shows the number of new converters each month. 29 schools converted in the first month –September 2010- and numbers remained below 50 per month for each of the next two terms. More than 150 converted at the start of the summer and autumn terms 2011, but the peak number of almost 300 converted during August 2011.
The initial focus of conversion was schools which were assessed as ‘outstanding’ by Ofsted. These were pre-approved for conversion. This has been extended to all schools that are deemed as ‘performing well’. The Department for Education judges this on a case-by-case basis by looking at exam results and progression over the previous three years, the results of Ofsted inspections and ‘other matters’ the school decides to use to support its case.2 Schools not meeting these criteria can still apply as part of a formal partnership with other schools that do meet them.
The Impact Assessment of the Academies Bill estimated that an additional 200 academies would convert each year over the first few years after its powers were introduced. Although it admitted that the
1 All open academies, DfE (September 2015); Edubase, DfE (Downloaded mid-September 2015)
2 Expansion of the programme to all schools that are performing well FAQs, DfE
0 50 100 150 200 250 300
Sep Nov Jan Mar May Jul Sep Nov Jan Mar May Jul Sep Nov Jan Mar May Jul Sep Nov Jan Mar May Jul Sep Nov Jan Mar May Jul Sep
2010 2011 2012 2013 2014 2015
Schools converting to academies, by month
Over the past two years 80% of schools converting to
numbers were ‘difficult to predict’.3 The National Audit Office report on the programme said that the rapid increase in the number of academies since May 2010 was a ‘significant achievement’ but the expansion was faster than expected and the Department was not prepared for the scale of the financial implications (additional costs) of this.4
1.2
Schools in the process of conversion
As of 1 September 2015 a further 782 schools had applied to convert to academy status, but had not yet opened as academies. 67% were primaries, 26% secondaries, 4% special schools and 3% were PRUs. 450 of these schools had had their application for conversion
approved.5
2.
What types of schools have
converted?
This next section looks at the different types of location of schools that have converted and compares these to the stock of schools at the time of the last January school census before the Academies Act came into force (2010). It therefore gives conversion rates, for instance the proportion of grammar schools that have converted to academy status, which will be somewhat different from the proportion of different types of schools that are now academies. Similarly the data on pupil
characteristics looks at the intake of schools in 2010 that have subsequently converted, not the latest data on the intake of current academies.
2.1
Schools
The table below looks at which types of secondary schools have converted so far. The highest rate by status was among foundation schools.6. The rate of conversion in community schools was lowest. The large majority grammar schools had become academies, by far the highest rate of any school characteristic. The lowest rate among the larger groups of schools (across all types) was for Roman Catholic schools, 35% of which had converted compared to 45% of all maintained secondaries and CTCs.
3 Academies Bill –Impact Assessment, DfE (May 2010)
4 Managing the expansion of the academies programme, NAO November 2012 5 Open academies and academy projects in development, September 2015, DfE 6 These school have, by taking on foundation status, already opted for some greater
2.2
Pupil intake
Secondary schools that have converted to academies had a smaller proportion of pupils eligible for free school meals7 than average. The rate at their predecessor schools in 2010 was 7.7% compared to 15.4% across all maintained secondaries at the time. These schools also had lower proportions of pupils from minority ethnic groups (21% non-White British v 23%) and with slightly lower rates of Special Educational Needs (1.8% v 2.0% statemented and 17% v 20% unstatemented) than average, but the gaps were smaller than on free school meal eligibility.
2.3
Geography
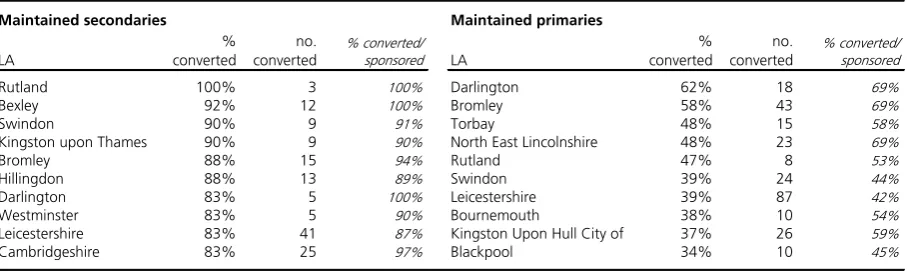
The following table lists the 10 local authorities with the highest share of maintained schools that have converted to academy status. There were four local authorities where at least 90% of maintained secondaries had converted. This indicator underplays importance of academies in local authorities with sponsored academies. The table therefore gives another rate which includes sponsored academies. 15 local authorities had a figure of 90% or higher on this measure. Overall conversion rates were lower for primary schools. The rate was 20% or higher in 45 local authorities. Bury was the only local authority (out of 150 with secondary schools) that had no secondary academies in November 2014. Other than the City of London and the Isles of Scily
7 This rate excludes pupils aged 16 or older
Types of secondary schools which have converted to Academies
Characteristics of schools at January 2010 which had converted by 1 September 2015
Converters
Status
Community 595 35%
Foundation 530 68%
Voluntary aided 218 40%
Voluntary controlled 43 42%
CTC 0 0%
Selection
Comprehensive 1,172 42%
Grammar 139 85%
Modern 76 48%
Religion
Church of England 85 45%
Roman Catholic 115 35%
'Christian' 20 61%
Other 6 38%
None 1,160 45%
All 1,393 45%
(a) Proportion of maintained schools and CTCs of this type that had converted by 1 September 2015
Note: Compenent parts do not sum to total as exlcudes schools with multiple predecessors
Sources: All open academies, DfE; Edubase, DfE; School pupils and their characteristics January 2010, DfE Rate of
only three local authorities (out of 152 local authorities with primary schools) had no academies –Sefton, Warrington and Greenwich.
3.
Exam performance
The first converter academy opened in September 2010. This means that the maximum time any pupil taking exams in summer 2014 had in the ‘new’ schools was slightly less than four years. Therefore some pupils at earlier converters spent the majority of their secondary education in academies. Others spent the majority of their secondary education in maintained schools and therefore any impact of the change in status on pupil attainment is limited. Differences in pupil attainment by school type are more likely to be connected to the types of schools that have converted. Similarly the performance tables do not yet give a particularly good indication of the impact of academy status on the improvement in results at these schools. The performance data therefore add more to the picture presented earlier of the types of schools that have converted, as much as the impact of academy status on school results. Over time the performance data will give a better indication of this impact.
The 2014 performance data take the status of the school from
[image:6.595.88.542.139.276.2]12 September 2013 when there were 1,201 converter academies. The table below gives a summary of some headline GCSE performance measures from the 2014 performance data. Attainment levels were highest in schools that had converted to academies. Attainment was clearly lower on most measures for pupils at sponsored academies, as we might expect. Attainment at schools that are still local authority maintained was between the two types of academy schools. Results by prior attainment band8 closer and a higher proportion of pupils with low prior attainment met the headline thresholds standard than at converter academies or maintained schools.
8 Attainment at the end of primary school where level 4 is the expected level
Local authorities with the highest proportion of schools converting to academies
Maintained secondaries Maintained primaries
LA
% converted
no. converted
% converted/ sponsored LA
% converted
no. converted
% converted/ sponsored
Rutland 100% 3 100% Darlington 62% 18 69%
Bexley 92% 12 100% Bromley 58% 43 69%
Swindon 90% 9 91% Torbay 48% 15 58%
Kingston upon Thames 90% 9 90% North East Lincolnshire 48% 23 69%
Bromley 88% 15 94% Rutland 47% 8 53%
Hillingdon 88% 13 89% Swindon 39% 24 44%
Darlington 83% 5 100% Leicestershire 39% 87 42%
Westminster 83% 5 90% Bournemouth 38% 10 54%
Leicestershire 83% 41 87% Kingston Upon Hull City of 37% 26 59%
Cambridgeshire 83% 25 97% Blackpool 34% 10 45%
Note: conversion by 1 September 2015. Secondaries include all through academies. % converted/sponsor led uses all state funded secondaries in January 2010 as its denominator
The next table looks at results for converter academies by how long they had been open. Results on each measure are better for each additional year between when they had opened and the start of 2013/14. This will again reflect, to a large extent, the fact that the earliest converters had the highest Ofsted ratings and, generally, the highest pre-conversion exam performance. Average performance on the headline measure actually improved faster in maintained schools than each cohort of converter academies. However, maintained schools had a lower starting point and hence greater room for improvement.9
Analysis of GCSE performance up to 2013 for the Local Government Association concluded:10
Analysis of 2013 exam results appears to show more progress amongst converter academies than all non-academy schools, especially among the very first converters, that became academies in 2009/10. These schools were all rated ‘outstanding’ by Ofsted at the time, so greater progress made in 2013 might be better
9 % of pupils achieving 5+ grades A*-C or equivalent inc. English & Maths. 2009/10 and later results compared to 2013/14 (old methodology). Provisional GCSE and equivalent results in England, 2013 to 2014, DfE (Figure 7)
10 Analysis of academy school performance in GCSEs 2013. Final report, LGA/NFER (July 2014)
GCSE and equivalent results for selected school types, 2013/14
5+ A*-C grades
5+ A*-C inc. English & mathematics
% entered all
components % achieved
Below level 4 At level 4 Above level 4
All state funded mainstream
schools 66.3 56.9 39.4 24.3 5.8 50.1 92.3
Of which:
LA maintained schools 64.5 54.7 37.2 22.1 5.5 48.8 91.5 Sponsored academies 52.9 44.7 26.9 12.7 6.7 44.9 87.3 Converter academies 72.4 63.0 45.5 30.1 5.9 53.5 93.8
Source: Provisional GCSE and equivalent results in England, 2013/14, DfE
% achieving 5+ A*-C inc. English & mathematics by prior attainment % achieving at GCSE or
equivalent: English Baccalaureate
2013/14 GCSE and equivalent results for converter academies by length of time open Time between opening and September 2013
5+ A*-C grades
5+ A*-C inc. English & mathematics
% entered all
components % achieved English Maths
1 year 67.1 56.4 40.1 25.1 69.8 66.9
2 years 70.4 60.7 41.4 26.7 73.9 69.0
3 years 74.6 65.6 48.8 33.1 76.8 73.8
4+ years 77.6 70.1 51.4 35.8 79.2 76.4
All 72.4 63.0 45.5 30.1 75.1 71.5
Source: Provisional GCSE and equivalent results in England, 2013/14, DfE % achieving at GCSE or
equivalent: English Baccalaureate
% making at least the expected degree of progress between Key
explained by pre-existing differences rather than the impact of academy status.
BRIEFING PAPER
Number 6233, 16 October 2015
The House of Commons Library research service provides MPs and their staff with the impartial briefing and evidence base they need to do their work in scrutinising Government, proposing legislation, and supporting constituents. As well as providing MPs with a confidential service we publish open briefing papers, which are available on the Parliament website.
Every effort is made to ensure that the information contained in these publically available research briefings is correct at the time of publication. Readers should be aware however that briefings are not necessarily updated or otherwise amended to reflect subsequent changes.
If you have any comments on our briefings please email [email protected]. Authors are available to discuss the content of this briefing only with Members and their staff.
If you have any general questions about the work of the House of Commons you can email [email protected].
Disclaimer - This information is provided to Members of Parliament in support of their parliamentary duties. It is a general briefing only and should not be relied on as a substitute for specific advice. The House of Commons or the author(s) shall not be liable for any errors or omissions, or for any loss or damage of any kind arising from its use, and may remove, vary or amend any information at any time without prior notice.