THE CHANGE OF ECONOMIC STRUCTURE OF BALKAN COUNTRIES AS A CONDITION FOR INTEGRATION IN EUROPEAN UNION
- the example of Serbia –
Panel session five: 5B Regional disparities in an enlarged EU, Friday May 18, 2007
Zoran Arandjelović, PhD Vladislav Marjanović, M.A.
Dejan Djordjević, M.A. UNIVERSITY OF NIS FACULTY OF ECONOMICS
Trg kralja Aleksandra Ujedinitelja 11, 18 000 Nis,
SERBIA
E – mail: [email protected] [email protected]
INTRODUCTION
The idea of united Europe is probably dated as far back as the Roman Empire, which, two millenniums ago, united a vast area from Britain on the north to Persia and Sahara on the south. Balkan countries at that time were a part of a single community, and therefore of a single market which existed at that time in accordance with the level of economic development. Even after the breaking of the large and inviolable Roman Empire, the idea of a union did not lose its importance. It just changed its form over time.1
New forms of the idea of united Europe appeared after the First World War, but only after the Second World War did a series of initiatives and practical questions on regional cooperation start. Those initiatives were at first the consequence of both political and later on economic intentions. Thus in 1951. European Coal and Steel Community was founded, the basis of which was the Paris – Bon axis. However, it has remained to this day one of the most original creations concerning various regional initiatives and organizations and it was organized according to the principle of the supranational, which is where its originality lies.
Several years later (1957), six countries of the Union created another two unions in Rome: European community for atomic energy (Euroatom) and European Economic Community. Finally, in 1965. all three unions were united into one.
The key to the integration of EU countries was at first the introduction of a single market, followed by the introduction of a single currency. Regardless of the fact that in the new entity named EU the national sovereignty was only formal, this Union for the
time being remained in the institutional sense "a specific legal structure, on the borderline between an international organization and a confederation."2
The effects given by the internal market should help in accomplishing a series of objectives of the Union: long-term sustainable and balanced growth, a high level of employment, a high level of social security, economic and social cohesion. All of this would at the end influence the increase of the standard of living and the quality of life of people living in the region, which is actually the final aim of this mutual structure.
Economic integration containing the internal market as its key element and in which there are no physical borders among the member countries is the highest aspect of the integration. It exceeds other forms of cooperation such as the free trade zone or the customs union, which maintain physical borders.
Parallel with the single market, cohesion policy is one of the key pillars of EU, and its purpose is to guarantee economic, social and territorial cohesion and support equality of opportunities for all parts of the unity. However, this policy has been questioned several times, above all for the disparity within member countries, and especially among the regions of expanded EU. Noticeable disparities in the regional development among certain regions of EU are one of the key problems imposed at this moment and which EU has to solve as soon as possible. It seems that regional problems are of structural nature and they include, besides problems of economic structure, also problems of demographic structure, the structure of employees, and even problems of spiritual structure.
Further on, this paper is not going to discuss all the structural problems, but is going to focus on the economic structure. In the first part of the overview character, it attempts, through a parallel view of models of EU and Balkan countries in three sectors, to draw the most important conclusions concerning differences in the economic structures among them, as well as the most important structural trends within these regions. In the second part, this paper is going to deal with a specific example of Serbia, a country in the heart of the Balkans, which is still in the process of transition and even “late transition”. As a potential EU member country, it is going to have to adjust its economic structure to the economic structure of EU, thus making it compatible and suitable for easier joining. Not only Serbia, but all Balkan countries, potential EU member countries, are going to have to work seriously on the process of the reconstruction of their economies so they could become a part of the single EU market in the foreseeable future.
The restructuring process of Balkan countries, which with all its complexity and long-term requires great accumulation, is an equal challenge not only for them, but also for EU, without whose logistic and financial support it will not be completed. Harmonization of the economic structures of Balkan countries will facilitate their introduction into EU family, and at the same time will not disturb the concept of the sustainable development which EU has been promoting and representing for a long time, as well as minimize the risk of aggravating "center – periphery dynamic" within EU.
I CHANGES IN THE ECONOMIC STRUCTURE OF BALKAN COUNTRIES AS A CONDITION FOR THE INTEGRATION INTO THE EUROPEAN UNION
1. Economic structure of European Union
If we try to define economic structure in the simplest way, it would represent the ratio between production of the sector, activity or branch and production on the level of the entire national economy (expressed through GDP). This kind of economic structure is also called vertical economic structure.3
Thus defined economic structure is not a fixed and unchangeable category, but it more or less changes through time, and structural changes in the economy can be set as a specific long term objective of development.4 Faster or slower changes in the economic structure are influenced by a number of factors, especially economic growth and accumulation as the most important. On a wider scale, economic structure is conditioned by the entire economic life.
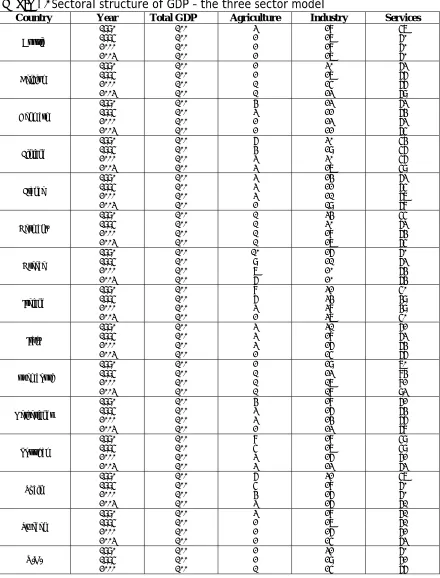
Further on, this paper is not going to discuss the factors influencing the completion of the economic structure, or the speed of acheiving "optimal economic structure". The stress is at first put on the explanation and short comment on the economic structure of EU countries and its implication on „other potential member countries from the Balkans“. The analysis is going to be simplified by using so-called the three sectors model, that views the economic structure through three sectors: agriculture, industry and services. The following table ilustrates the economic structure of EU countries.
The following can be observed. First, the economic structure of EU countries shows the condition of highly developed compact economic unity (EU – 25) where the services sector is dominating, followed by industry and agriculture respectively.
Second, the economic structure EU – 25 changes in such a way that services increase their participation in creating GDP mostly at the expense of the industrial sector which decreases its % in the structure. Agriculture insignificantly changes its part in the economic structure of EU – 25 countries.
Third, if this analysis is dynamised over individual countries, it can be observed that it is mostly equal among the countries, which implies that the service sector is dominating in creating GDP, followed by industry and agriculture, which is a sign of development of these economies.5
Fourth, the participation of agriculture is mostly equal among EU -25 countries, the most agrarian being Greece and Lichtenstein, where the participation of agriculture is far beyond the average for EU – 25 countries.
3 Horizontal economic structure, however, represents the ratio between the production of one region and
total production of the national economy.
4 Zoran Aranđelović, Ph. D, "National Economy", Faculty of Economics Nis, 2004, p. 102.
5 Extremes are Luxembourg with the highest participation of services (over 90 %) and the lowest of the
Fifth, new member countries (EU -10) have significantly changed their economic structure over the past decade in a positive sense, rapidly increasing % of participation of services and decreasing % of participation of the agricultural sector in creating GDP.
Table 1: Sectoral structure of GDP – the three sector model
Country Year Total GDP Agriculture Industry Services
2003 100 1 23 68
EU – 15
1990 1995 2000 2003 100 100 100 100 3 3 2 2 30 27 25 24 59 63 64 66 Cyprus 1990 1995 2000 2003 100 100 100 100 7 5 4 4 25 22 19 18 65 68 74 72 Czech Republic 1990 1995 2000 2003 100 100 100 100 8 4 4 3 43 37 35 35 43 52 53 55 Estonia 1990 1995 2000 2003 100 100 100 100 14 7 5 4 46 26 24 25 47 56 61 61 Hungary 1990 1995 2000 2003 100 100 100 100 9 6 4 3 32 27 29 27 47 55 55 58 Latvia 1990 1995 2000 2003 100 100 100 100 21 8 4 4 45 26 21 20 31 54 64 65 Lithuania 1990 1995 2000 2003 100 100 100 100 27 10 7 6 30 30 27 29 44 51 56 56 Malta 1990 1995 2000 2003 100 100 100 100 3 3 2 2 27 23 28 25 60 62 62 64 Poland 1990 1995 2000 2003 100 100 100 100 8 6 3 3 50 32 29 27 42 49 54 58 Slovakia 1990 1995 2000 2003 100 100 100 100 8 5 4 4 52 35 30 29 31 51 55 59 Slovenia 1990 1995 2000 2003 100 100 100 100 5 4 3 2 38 31 32 32 48 52 54 55
EU – 10
1990 1995 2000 2003 100 100 100 100 10 5 3 3 42 32 30 28 43 52 55 58
EU – 25
2. Economic structure of Balkan countries
[image:6.612.87.527.159.483.2]Having in mind the firm determination of Balkan countries to become a part of the „European family“, we consider a summary of economic structures of these countries very important. The following table illustrates this in the best way.
Table 2: Economic structure – the south eastern Europe
Country Year Total GDP Agriculture Industry Services
Albania 1990 1995 2000 2003 100 100 100 100 40 55 26 24 44 22 17 17 - - 50 51 Bosnia and Herzegovina 1990 1995 2000 2003 100 100 100 100 25 12 11 9 25 24 24 23 41 47 48 50 Bulgaria 1990 1995 2000 2003 100 100 100 100 18 13 12 10 44 31 27 26 35 51 50 51 Croatia 1990 1995 2000 2003 100 100 100 100 10 9 7 7 32 28 25 25 50 46 52 54 FYR Macedonia 1990 1995 2000 2003 100 100 100 100 8 11 10 12 44 29 28 26 39 47 47 49 Romania 1990 1995 2000 2003 100 100 100 100 22 20 11 12 46 39 32 33 26 36 46 45 Serbia and Montenegro 1990 1995 2000 2003 100 100 100 100 18 16 20 18 35 31 30 32 44 38 44 42
South – East Europe 1990 1995 2000 2003 100 100 100 100 18 16 12 12 40 33 28 29 37 41 48 48 Source: UNCTAD Handbook of Statistics, Geneva, 2004.
The following is concluded. First, the average participation of all three sectors of Balkan countries is significantly different from the average of EU – 25. It especially refers to agriculture (2% in EU – 25 and 12 % in Balkan countries) and services (48 % against 65%). The best economic structure in the three sectors model seems to show Croatia, and Albania the worst.
Second, the change in the economic structure of Balkan countries has been obvious during the last decade, but it is of different intensity and it differs from one country to another.
Third, unlike the trend of permanent growth of the share of the tertial sector and decrease of agriculture in GDP of all EU – 25 countries in the last decade, that is not the case with Balkan countries – changes in the economic structure vary from one country to another, with very different and unequal trends. It is obvious that Balkan countries are still wandering in searching for "optimal economic structure".
In the fist phase of transformation, all transitional economies moved toward deindustrialization and showed an absolute decrease of the employment level in industry. The size of the agriculture sector was also reduced in most of these countries (with the exception of Romania and Bulgaria). At the same time, all transitional economies showed a clear sign of the catching-up process of services in relative quantities, thus increasing the share of services to over 60 % of the added value. This increase occured ecpecially due to two things – statistical reclassification of services and substantial increase in the number of employees in that sector. However, overall progress viewed as the absolute amount in the employment in services was not nearly sufficient enough to compensate for the unemployment in other two sectors.
Initial deep transformational recession 1990-1992, followed by the process of reforms and recovery still gave results in second transformational phase, and the economic structure got a different and more stable form. An increased revival of industrial production, increase in work productivity and acceleration of economic growth introduced these economies into the phase of "active restructuring", unlike that in the first stage of transition, which can be called "passive restructuring".
3. Restructuring as the necessity for compatibility
Despite the progress achieved through the cohesion of EU countries in the last few years, there are still noticeable disparities among members (especially after the joining of EU – 10 countries). There is no doubt that such regional disparities are of structural nature, and that there are serious structural problems can be seen in the fact that differences in the income level between the most developed and the least developed EU countries are almost double. In EU – 15, a significant disparity in the development level among regions occured. As many as 48 regions (18% of total EU – 15 population had per capita income under the treshold of 75% of EU – 15 average). In expanded Europe, this difference in the income gets even bigger. It is the same for the unemployment, which is 2% in the most developed regions, whereas it goes over 20% in the least developed ones.
By joining new EU – 10 countries, there was a strong pressure on the unemployment rate, as well as strong influence on the sector`s composition of employment. Relative quantity of employees in agriculture increased from 4,4% in EU – 15 to 5,5% in EU – 25, whereas the relative share of employees in services decreased.6 The employment rate in industry mostly remained the same.
Having in mind the enlargement, the process of globalisation and transition which have not been completed in certain EU countries, there is a high risk of deteriorating
centre – periphery dynamic within EU as a whole. Economic dualism, i.e. the situation
where one economy has advanced, dynamic and highly employed regions of "centre" on one hand, and regions of "periphery" with weak growth and high unemployment rate on the other hand, might negatively influence the compact unity such as EU is. Inadequate economic structure of "periphery", as well as slow structural changes caused by weak growth of these regions, might jeopardize the functioning of EU as a unity and increase the divergence level of "centre" and "periphery".
For that reason, the acceleration of structural changes in "periphery" countries, among which are Balkan countries as potential members of EU, is a condition which must be seriously taken into consideration. The fulfillment of this condition is of utmost importance not only for Balkan countries, but also for EU, which must include this as a priority in its cohesion policy. Of course, the integral part of the EU cohesion policy must also be the cohesion fund as a necessity and financial support toward more intensive completion of the economic structure of Balkan countries, without which that restructuring dynamic would not be satisfactory.
II RESTRUCTURING OF SERBIAN ECONOMY AS AN INDISPENSABLE CONDITION FOR EU INTEGRATION
1. Change of Economic Structure in Support of Export Sector
Starting from the hypothesis that Serbia is a country late in transition, whose basic strategic developmental goals are creating an open, export-oriented economy and ultimate increase in the standard of living as the final instance, one may conclude that accession to one of the most important global integrations, such as the EU, would be of primary developmental importance. This is so since the EU is: first, the most profound economic integration in the world, with a large, economically powerful common market; second, a community with significant production, investment, and market potential; third, in the past and today, Serbia’s biggest foreign trade partner; and fourth, because Serbia, due to its specific geographic position, as a European and Mediterranean country, is foremost oriented to communication with the European countries.
In Serbia’s case, the process of EU accession will be neither easy nor quick. As a Western Balkan country enjoying special treatment through the Stabilization and Association Process, Serbia will first have to go through the association phase, to be initiated upon the conclusion of the Stabilization and Association Agreement. Only after this act will it enter the accession phase. In this time period, Serbia will have to embrace the principles EU is founded on, and also adapt to the EU common market, whose part it will one day become.
Although the position of Serbia at the beginning of EU accession process may be labelled unfavourable and complicated (the positive Feasibility Study notwithstanding), starting from Serbia’s comparative advantages,7 one of the key strategic goals at the moment is to promote a flexible, export-oriented economy. Serbia today may be viewed as a small economy with all characteristics typical of import-dependence, which means that only the strategy of export promotion may have a positive impact on the balance of revenues and expenditures, first in current transactions, and then in the balance of payments. As export is one of the manifestations of foreign trade, gradual liberalization and intensification of the domain of foreign trade would have a positive impact on the
7 The main comparative advantages are usually defined as: geographic position, qualified labour force,
increase of gross national product and reduction of deficit. Reduced deficit would further facilitate the servicing of the foreign debt, which is already alarming (over $14 billion).
The easier method of servicing deficit in balance of payments, by means of loans, donations, primary emission, exhaustion of foreign currency reserves and surplus in the balance of services, should finally be replaced with methods to fight the essence of the problem. And the essence of deficit is the balance of goods, which, if in the red, cannot be improved by the strategy of substituting import, nor by all-out liberalization. There is no doubt that the key tenet of future foreign trade strategy will be that of export-oriented penetration.
Graph 1.
EXPORT INCREASE RESTRUCTURING
INVESTMENT
COMPETITIVENESS
PROMOTIONAL ACTIVITY
FOREIGN TRADE LIBERALIZATION
INSTITUTIONAL SUPPORT
Source: Vladislav Ž. Marjanović, master's thesis, p. 124.
Graph 1 clearly shows which factors can directly influence the dynamics of export.
Successful completion of ownership transformation and economic restructuring in Serbia will be the primary condition, without which increased export
will be impossible. A normal, completed, and moderately flexible economic structure, based on propulsive, export-oriented sectors, is an indispensable component in solving balance of payments` deficit and accelerating economic growth. Naturally, as the creation of economic structure is a long, burdensome and very specific task, wanting much accumulation, the problem should be approached with a specific, subtle strategy. It is well known that national accumulation is too meager to support and finalize the restructuring process. For this reason, one must point out the importance of foreign direct investment (FDI) in the overall investment structure. From the macro aspect,
However, high risk factors (primarily political) and low competitiveness stand as obstacles to major FDI influx. As risks reduce, more FDI can be expected.
Competitiveness of a product (or group of products) is one of the key
precond
nts of competitiveness in this respect
on quality will only be possible if standardization and quality
ut increased promotional activities, and without introduction of national
brand n
iberalization is big, not without a reason, since
the rate
ional support is perhaps the most important determinant in the increase
of expo
clear foreign trade legislation.
itions for increased export. Good competitiveness of the entire economy is, on the other hand, a precondition for dynamic export in general.
Put most narrowly, there are two key determina
– price and quality. In order for a product to have a competitive price, its production needs to be rational. Basically, the entire economic branch from which the product comes would need to be competitive. As for the competitiveness of companies, apart from good management and business policy, timely and well thought-out reactions of the state can play an important role. All this helps an economy to become regionally competitive, where possibilities for industrial clustering in Serbia are currently being discussed.8 The cluster – a critical mass of related industries and services bundled in one location, or region, can provide strong export impetus through increased performance, competitiveness, and quality.
Competitiveness based
control become the standard practice in the country, in accordance with international norms and principles. As Serbian economy's competitiveness (from both macro and micro viewpoints) is so important, this issue will be analyzed in more detail in further text.
Witho
ames familiar round the world, long-term increase in export will not be possible. Delay in promo activities and branding may lead to the outcome in which, instead of key Serbian products, positions in the market could end up changed by products of other countries, winners in the marketing race.
The importance of foreign trade l
of liberalization directly conditions foreign trade dynamics, and its conception defines the structure of foreign trade. Free international trade, rid of all barriers (customs or other) could be deemed an optimal trade model. However, foreign trade policy would need to use instruments which could mitigate the effects of liberalized trade, until that moment when the country becomes developed enough to compete with its main foreign trade partners.
Institut
rt, since it directly influences some of the factors related to export, mentioned above. However, it is a fact that one institution to support the growth of export is not enough to ensure effects in the long run. For this reason, there should be a whole range of institutions, networks which would strategically and operatively create and monitor all foreign trade currents. Among the most important institutions to comprise this "network" for the promotion and increase of export, we should point out: organization for promotion of export, organization for product development and design, banking institutions with a well-established system for financing export-oriented companies, and, ultimately, the National Bank, Ministry of International Economic Relations, Chamber of Commerce. Naturally, this system for export promotion and increase would need to be backed by
8 Together with the National Council for Competitiveness and USAID, Serbian Chamber of Commerce is
In addition to poor economic structure, which caused the unfavourable structure of Serbian export (focusing on raw materials, primary products, and low degree process
ted legislation,
ation, often unacceptable for most countries, of subsidies,
incompatibility in practically all types of
br high, and exported products are not competitive in the international market
actions. Basically, it can be viewed through two components – the structural compon
ong to treat inappropriate economic ed products), one may identify additional constraints which have limited Serbian export to date, as follows:
inefficiency of local production, insufficiently adjus
inappropriate covering document lack of adequate and regular system undeveloped quality control system, expensive and slow banking,
low development and international
transport9.
In consequence of all these factors, expenses of preparing and sending goods oad are too
a
.
Foreign trade deficit is a long-term problem and therefore cannot be solved with short-term
ent and the component of economic policy.
Long prevailing, structural problems of Serbian economy are the leading cause
of increased deficit, year after year. As it takes l
structure (because completing the economic structure is a long-term process), and this wants accumulation (there is none in Serbia), the problem is even more difficult. For this reason, insufficient investment is a problem directly related to economic structure and belongs to the realm of structural problems.
Apart from bad economic structure, the structure of employees is also unfavourable, and is one more cause of the overall poor condition.
Foreign trade structure, another structural problem, very important at present, looks as follows. In 2004 Serbia's principal foreign trade partners in export were Bosnia and Herzegovina, Italy, Germany, Macedonia, and Slovenia. In terms of import, these were Germany, Russia, Italy, China, and the USA. Around 52% of all export and 54% of all import comes from the exchange with the EU. This is but one indicator testifying that there is no real alternative to EU accession. Viewed by sector in Standard International Trade Classification (SITC), dominant in export are iron and steel, fruit and vegetables, non-ferrous metals, various finished products and various rubber products. These amount to 35,5% of total Serbian export. In 2004, Serbia typically imported: oil and derivatives, motor vehicles, industrial machines, electric machines and appliances, and specialized machines. This totalled around 31% of all import.
There is yet another element to mention in relation to the current balance deficit, and this is the structure of demand. First of all, we point out here the structure of import demand, classifiable into investment- and consumption-oriented import.
9 Dr S. Milosavljević, "Increased production and export – the most significant goals in 2005", Economic Policy and Development 2004/2005, Faculty of Economics Belgrade, 2004, p. 25-30;
These two structures (directed at investment or consumption) will directly determine future growth of export-oriented production, and ultimately determine the results in the balance of payments. Therefore, the problem of foreign trade deficit has to be solv
alue of dinar. Import liberalization, commenced in early 2001, meant t
balance of payments.
of foreign ade,
export and the mpet
ian Economy as a Structural Problem
creased economic competitiveness is one of the most significant strategic aims.
It is ev hus to
export, which it directly determines. One ould distinguish between two concepts of compet
es. Rather, it should be viewed in the context of interna
tegy) or because they do not timely apply the strategy, even though it might be appropriate.
ed starting from demand and its structure, and not from liberalization and exchange rate policies.
Among problems caused by economic policy so far (specifically, we cover the
most recent years), one typically pinpoints the rash and uncontrolled liberalization of import and overrated v
hat the average customs rate decreased to only 9,4%. In addition, almost all other non-custom-based protection measures were discontinued, though they are today used by even the most developed countries in the world. For that matter, certain types of non-tarif protection are allowed by WTO, and therefore the EU.
Stubborn adherence to the overestimated national currency exchange rate, followed by a pronounced growth of prices, as a rule leads to reduced export (and increased import), with all negative implications on the
As a result of structural disturbances and incautious economic policy, the problem of competitiveness of Serbian economy is becoming ever more serious.
With all elements given above in mind, it is clear that a new strategy
tr as one of the most important segments of the overall strategy of Serbian development, must be primarily based on the strategy of increasing
co itiveness of Serbian economy.
2. Competitiveness of Serb In
en more so, as it is in direct relation to the deficit of current balance, and t sh
itiveness – macro and micro competitiveness.
Micro competitiveness is related to concrete business entities, i.e. companies. It is therefore defined as the companies' relative efficiency to place their products and services in internationally competitive markets.10
Macro economic competitiveness dimension is rather based on comparative advantages of an economy. However, in new conditions it cannot be solely linked to the traditional paradigm of comparative valu
tional competition. Accordingly, macro competitiveness entails the ability of a country to create surplus value and thus increase national wealth by managing crucial resources in the given time period, and by integrally relating them to its own economic and social model.11
Most developing countries of today are undergoing deep crisis, for two reasons: either because they do not have an appropriate developmental strategy (and, within it, the competitiveness stra
10 “Competitiveness of Serbian Economy", Jefferson Institute, Belgrade, 2003, p. 25.
Economies which, when selecting a competitive strategy, overestimate the importance of external production factors (labour, capital, and natural resources) are bound to fail in modern conditions. The problem lies in the fact that natural resources and inexpensive labour force are a resource combination that can be easily imitated, so that there is
e ultimate goal of any macro strategy is to boost standard of living and quality
pproach to competitiveness from th
he world, Serbia assumes a very low position.
ort.
for hug
, or concrete products, depending on the level of observa
high probability that competitors will emerge, offering the same product at a lower price.
Competitive strategy based on traditionally viewed comparative advantages, i.e. lower production expenses, is unstable in modern times. Repetition of this strategy results in accelerated exhaustion of natural resources and ever lower wages and standard of living. As th
of life, the strategy of increasing economic competitiveness based on the classic comparative advantages is doomed to failure from the start.
As a country slowly increasing pace in the trajectory of transition, Serbia found its reason for starting this process in low efficiency levels. Raised efficiency of the economy should be the primary strategic goal in the time ahead of us, and a new competitive strategy a major tool to help support macro-efficiency. A
e macro point of view should encompass the joint issues in the appropriate strategy and high productivity on the national economic level. An appropriate strategy turns temporary monopolies, based on low expenses or differentiation, into permanent monopolies, based on innovation.12
As it lasted too long, commitment to the strategy of low expenses resulted in the fact Serbia is today competitive in the international market only with products for further processing (low in added value). Therefore, in the competitiveness ranking, when compared with other economies of t
Lack of knowledge of market evolution and relative position of competitors in particular business entities, but also on the macro level, has led to the fact Serbia currently does not have a single product (or sector) which could be globally competitive, even if one also considers products for further processing, which dominate in all exp
The principal element to start from when analyzing the competitiveness of a country is its balance of payments. Since in the red, the balance of goods and ultimately current balance, is one of the major macroeconomic problems of Serbian economy. Chronic and growing deficit and weak covering import by export are as well a condition
e external liabilities, whose servicing is starting to become a serious problem. As it may be, the growing tendency of foreign trade deficit is one of the indicators of decline in competitiveness of Serbian economy.
The second element observed in the analysis of competitiveness is the very foreign trade structure, both by sector and by groups of products. In the analysis that follows, a simple RCA index has been used, showing revealed comparative advantages of the economy, sectors, groups of products
tion. RCA (Revealed Comparative Advantage) index13 is a simple, yet clear
enough, indicator of competitiveness, where the mathematical equation is usually as follows:
12 D. Đuričin, D. Petraković, "New Serbian Competitive Strategy", Competitiveness and Transition,
y", Jefferson Institute, Belgrade, 2003, p. 90. Economist No. 1, Budva, 2003, p. 31.
RCA=
Mj Xj
Mj Xj
+ −
, where Xj is the export value of product j (or sector j), while Mj
is the import value of product j (or sector j).
n the export of the given product or sector. If it is negative, there is no comparative
duct or sector outrates its export.
2002 2003 2004
If the coefficient is positive, it is assumed that there is a comparative advantage i
advantage, as the import of the particular pro
It is recommended that the RCA index should be as high as possible, as in that situation comparative advantages are higher.
[image:14.612.85.527.256.437.2]Table 3 lists RCA index of sectors according to Standard International Trade Classification (SITC).
Table 3: RCA indices by SITC sectors in the Republic of Serbia
Equipment -0.745 -0.775 -0.816
Consumer goods -0.160 -0.231 -0.416 Semi-manufactures -0.501 -0.520 -0.442
Food 0.083 0.030 0.017
-0.719 -0.620 -0.486
Beverages and tobacco
Crude materials, inedible -0.279 -0.235 -0.253
Mineral fuels and lubricants -0.843 -0.896 -0.893
An ls
a
imal and vegetable oi
nd fats 0.086 0.030 0.566
Chemicals -0.650 -0.607 -0.569
Manufactured goods -0.363 -0.375 -0.280
Machinery and transport
equipment -0.705 -0.747 -0.792
Miscellaneous manufactured
articles -0.167 -0.218 -0.301
Commodities and
transactions -0.193 -0.236 -0.623
Source: lations, based on t a of National Bank of Serbia and Serbian Statistics Bureau.
oncludes that Se only in terms of food, anim ble oils and f en in these sectors, the tendency of RCA dropping is
re egativ
own calcu he dat
One c rbia has comparative advantages al and vegeta at. Ev
obvious, which means that competitiveness is decreasing. All remaining sectors a n e in the RCA index, which means there are no comparative advantages. In addition, we notice a tendency of their further fall, especially in sectors amounting to most export overall, such as consumer goods, machinery and devices, and various final products.
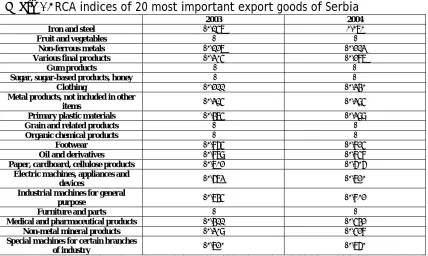
If we put this analysis one step down, and address particular product groups, for major exported goods it is given in Table 4. It shows RCA indices of 20 leading Serbian exported goods. The result of this analysis is very alarming. In 2004 Serbia had comparative advantages in the export of only two types of products! The highest RCA coefficient is found for exported steel (0.070), and comparative advantage is also assumed in the export of the second leading product group – that of fruit and vegetables.
If viewed in such way, compatible strategy of competitiveness relies on low production expenses and exhaustion of external factors. In modern economic conditions, such competitiveness is unstable, as it is easily imitated.
Table 4: RCA indices of 20 most important export goods of Serbia
2003 2004
Iron and steel -0,157 0,070
Fruit and vegetables - -
Non-ferrous metals -0,127 -0,213
Various final products -0,305 -0,287
Gum products - -
Sugar, sugar-based products, honey - -
Clothing -0,211 -0,340
Metal products, not included in other
items -0,315 -0,395
Primary plastic materials -0,475 -0,399
Grain and related products - -
Organic chemical products - -
Footwear -0,865 -0,825
Oil and derivatives -0,879 -0,858
Paper, cardboard, cellulose products -0,702 -0,606
Electric machines, appliances and
devices -0,673 -0,720
Industrial machines for general
purpose -0,745 -0,802
Furniture and parts - -
Medical and pharmaceutical products -0,411 -0,542
Non-metal mineral products -0,309 -0,528
Special machin tain branches of industry
es for cer -0,720 -0,760
Source: ased on the data of National Bank of Serbia and Serbian Statistics Bureau.
or lack of e propulsive products is the fact that Serbia port offer. Th n be showed in different ways: the analysis
14
2
own calculations, b
One of the reasons f xport-does not have specialized ex
ws will u
is ca
[image:15.612.85.513.120.376.2]that follo se the HH index, most commonly utilized in similar comparisons. However, some analyses also use indicators of export diversification.
Table 5: Export concentration and diversification indices for some countries in Southeast Europe, 2002
1992 200
exported Diversification Concentration exported Diversification Concentration
Number of Number of
products index index products index index
Albania - - - 80 0,814 0,292
Moldavia - - - 125 0,791 0,284
Macedonia - - - 158 0,674 0,152
Rom nia a 202 0,561 0,125 207 0,576 0,122
212 0,537 0,108 210 0,507 0,119
Croatia
- - - 208 0,535 0,104
Bulgaria Serbia and
Montenegro 187 0, 4 0,52 090 203 0,558 0,091
Sou D Han ok of Statistics, Geneva, 2004.
ersific n index be mathe cally ex
rce: UNCTA dbo
Div atio can mati pressed as follows:
14
Sj =
2
∑
−i
hi hij
, where hij – is the share of product i in total export of the country j,
and hi – the share of the product i in total global export. Diversification index ranges
from 0 to 1 – the closer to the latter value, the bigger the gap between the foreign trade of a country and global averages.
Concentration index (Hirschman index)15 is usually given as follows:
Hj =
n n n
i
Xj
xij
1 1
1
1
2
− −
∑
⎟
⎠
⎞
⎜
⎝
⎛
=
, where i is the number of products turned over in the
export/import of a country j.
Xj =
∑
n= i 1xijThis coefficient also ranges from 0 to 1.16
Analyzing Table 5, we notice that Serbia and Montenegro had a small (almost neglectable) concentration index growth in the period of one decade, which means that, in the given time, no visible improvement in production and export specialization was made.17 Compared with indices of other Southeast European countries, the rate of Serbia and Montenegro is the lowest.
As to the diversification index, in the period of one decade, it increased (0.524 to 0.558), which further distanced Serbia and Montenegro's foreign trade structure from global averages.
The previous table reflected the export concentration and diversification of particular countries. Here, Table 6 shows concentration rates based on the most significant exported and imported products of Serbia:
[image:16.612.82.526.487.566.2]
Table 6: Concentration and specialization indices of 20 most common exported/imported goods in the Republic of Serbia
S HH
2003 2004 2003 2004
Import 0.0656 0.0627 0.042 0.037
Export 0.0624 0.0715 0.031 0.056
Source: own calculations, based on the data of National Bank of Serbia and Serbian Statistics Bureau.
The S index is called specialization index18, mathematically expressible as:
15 UNCTAD Handbook of Statistics, Geneva, 2004, p. 442. 16
1 signifies maximum concentration.
17 A reverse movement can be said to have taken place, since in relation to 1992, when the number of
exported products was 187, in 2002 it increased to 203. This means that the “concoction” of various, unrelated exported goods only became bigger.
S=
2
1
∑ ∑
= ⎟⎟ ⎠ ⎞ ⎜
⎜ ⎝ ⎛ n
i X
Xi
, where the bracketed expression is the share of each product group in
total import/export value. The closer S coefficient is to 0, the lower is the export/import
concentration rate.19
HH is the Hirschman index, already explained above. For the present purpose it
has been optimized for 20 products, and is therefore mathematically expressible as:
HH=
20 1 1
20 1
20 1
2
− −
∑
⎟
⎠
⎞
⎜
⎝
⎛
=
i
x
xi
.
The general conclusion is that indices are very low, both in 2003 and in 2004, and they stand quite far away from value 1. However, in the domain of export, a positive change can be noticed towards higher concentration (increase of both indices). Yet, at the same time, in the domain of import both coefficients dropped, which shows that export has become more diversified.
The size of the efficient economic sector can also be a very important element displaying the competitiveness of a country, especially if the economy in question is in transition, as is the case with Serbia. Indeed, since transition, among other things, means the transformation of inefficient ownership into efficient ownership, and thus the switch from inefficient into efficient economy, one concludes that the economic segment which has completed its ownership transformation is the efficient portion of the economy. With no room for a deeper analysis here, we should stress that a large part of Serbian economy is still inefficient.
Another indicator that could be viewed in the context of economic competitiveness is the country's external debt.In Serbia, as mentioned, external liabilities have surpassed the alarming figure of $14 billion, which opens up numerous problems related to the servicing of such an accumulated debt. In order to settle such external expenses, part of the national income needs to be put aside, which has a negative effect on economic efficiency, and therefore also on competitiveness.
With all relevant elements in mind, what kind of strategy for competitiveness is needed? The primary principle would require that the new Serbian competitive strategy should complete and ultimately renounce the first phase of its competitiveness – the price competitiveness period, whose repetition in the time to come would be fatal. With this in mind, priorities would be to finally:
a) complete the foundation of efficient institutions,
b) build all needed infrastructure (legal and physical),
c) sustain macroeconomic stability,
d) develop entrepreneurial capacities,
e) develop appropriate systems of industrial property protection and standards,
19 If the total export/import value is obtained via one product, S=1.
f) accelerate international integrations in all segments of this process (inter- and
intraregional)
Only this way will conditions be made for the much needed twist from the factor-led economy to efficiency-governed economy. More knowfactor-ledge needs to be used so as to advance inputs, production and distribution, and regulatory institutions, because only this way can growing poverty and social problems be avoided.20
Literature
1. D. Lopandić, PhD, "EU Trade Policy and Yugoslavia”", IEN Belgrade, 1997 2. "The future of EU Cohesion Policy", European Economic and social
Committee, Belgium, 2004.
3. Z. Arandjelović, PhD, "National Economy", Faculty of Economics, Niš, 2004. 4. "Measuring progress towards a more sustainable Europe (Sustainable
development indicators for the European Union)", European Commission, Luxembourg, 2005.
5. V. Marjanović, M.A, “The Economy System`s Aspects of Serbia and Montenegro Accession to European Union in the Field of Foreign Trade”, master’s thesis, Faculty of Economics Belgrade, 2006.
6. D. Đuričin, "Strategy of Serbian Competitiveness 2005-2010”, Business Forum, Kopaonik 2005.
7. "Competitiveness of Serbian Economy”, Jefferson Institute, Belgrade, 2003. 8. UNCTAD Handbook of Statistics, Geneva, 2004.
9. M. Jović, "Key Factors of Competitiveness and Transition”, Competitiveness and Transition, Economist No.1, Budva, 2003.
10.S. Milosavljević, PhD, "Increase of Production and Export – the Most Important Goals in 2005”, Economic Policy and Development 2004/2005, Faculty of Economics Belgrade, 2004.
11.R. Kovačević, PhD, "Possibilities and Measures for Increasing Serbian Export in 2005”, Economic Policy and Development 2004/2005, Faculty of Economics Belgrade, 2004.