Sixth
FP7 Monitoring Report
M
ONITORING
R
EPORT
2012
T
ABLE OF
C
ONTENTS
0 EXECUTIVE SUMMARY ... 1
1 INTRODUCTION ... 3
2 FP7PARTICIPATION PATTERNS IN 2012 ... 5
2.1 Overall participation ... 5
2.1.1 Calls, proposals, applicants and corresponding success rates ... 6
2.1.2 Project costs, requested EU contribution and corresponding success rates ... 6
2.1.3 Signed grant agreements, participants and EU contribution ... 10
2.2 Participation by funding scheme... 10
2.3 Participation by type of organisation ... 11
2.3.1 Academia participation ... 13
2.3.2 Participation of research organisations... 13
2.3.3 Industry participation ... 14
2.4 International and regional dimensions of FP7 ... 19
2.4.1 EU Member States ... 19
2.4.2 Candidate and Associated Countries ... 21
2.4.3 Third Countries ... 22
2.4.4 Regional dimension ... 25
2.5 Participation of women and the gender dimension in FP7 ... 29
2.5.1 Patterns of women participation in FP7 projects ... 29
2.5.2 Participation of women in FP7 advisory groups, panels and committees ... 32
3 FP7IMPLEMENTATION IN 2012–MANAGEMENT AND QUALITY ISSUES ... 34
3.1 Dissemination activities ... 34
3.1.1 Internet ... 34
3.1.2 National Contact Points meetings ... 36
3.2 Quality assessment of proposal evaluation and the redress procedure... 36
3.2.1 Proposal evaluation ... 36
3.2.2 Redress procedure ... 37
3.3 The FP7 Ethics Framework - Ethics reviews and ethics audits ... 38
3.4 Time-To-Grant ... 41
3.5 Independent assessment of FP7 implementation by National Contact Points ... 42
3.5.1 Project life cycle ... 42
3.5.2 FP7 in general context ... 44
3.6 Simplification... 45
3.6.1 Simplification measures in FP7 ... 45
3.6.2 Perception of simplification in FP7 by National Contact Points ... 46
3.7 Monitoring sustainable development in FP7 ... 47
3.7.1 FP7 and the renewed EU Sustainable Development Strategy ... 47
3.7.2 Web-based monitoring tool on research for sustainable development ... 48
3.7.3 Achievements regarding FP7 contribution to sustainable development ... 48
4 FP7IMPLEMENTATION IN 2012–SPECIAL FOCUS ... 50
4.1 European Research Council ... 50
4.1.1 The ERC Scientific Council ... 50
4.1.2 The ERC Executive Agency (ERCEA) ... 51
4.1.3 ERC in 2012 ... 51
4.1.4 Achievements and future goals ... 55
4.2 The Research Executive Agency (REA) ... 55
4.2.1 Programme management in the REA in 2012 ... 56
4.3 Marie Curie Actions ... 58
4.3.1 General overview ... 58
4.3.2 Focussing on researchers' careers ... 58
4.3.3 Key challenges in Horizon 2020 ... 59
4.4 EURATOM ... 60
4.4.1 Nuclear fission and radiation protection ... 60
4.4.2 Fusion energy ... 61
4.5 Joint Technology Initiatives... 62
4.5.1 Clean Sky Joint Undertaking ... 63
4.5.2 Innovative Medicines Joint Undertaking (IMI) ... 65
4.5.3 ARTEMIS (Embedded Computing Systems) ... 67
4.5.4 ENIAC (Nanoelectronics) Joint Undertakings ... 68
4.5.5 Fuel Cells & Hydrogen Joint Undertaking (FCH JU) ... 70
4.6 Article 185 (ex-169) Initiatives ... 72
4.7 Risk-Sharing Finance Facility (RSFF) ... 73
4.7.1 Rationale and aim ... 73
4.7.2 Risk-Sharing Finance Facility (RSFF) in 2012 ... 73
4.7.3 Transition from FP7 to Horizon 2020 ... 75
4.8 Participation of SMEs ... 76
4.8.1 Overview of SME Participation in FP7 ... 76
4.8.2 Funding for SMEs under the Cooperation Programme ... 76
4.9 European Research Area ... 77
5 FP7ACHIEVEMENTS AND FIRST PROJECT OUTCOMES ... 79
ANNEX A: MONITORING SYSTEM FOR FP7 ... 86
ANNEX B: STATISTICAL TABLES ON PARTICIPATION PATTERNS ... 89
ANNEX C: STATISTICAL RESULTS OF NCPSURVEY ON FP7PROMOTION AND IMPLEMENTATION IN 2012 ... 101
ANNEX D: GLOSSARY ... 107
0
E
XECUTIVE
S
UMMARY
The Sixth FP7 Monitoring Report focuses on the Framework Programme implementation in 2012, provides an integrated view on the different strands of FP7 activities and also presents a comparative analysis of FP7 implementation during 2007-2012.
Although the document structure is similar to the one used in the previous reports, there are a number of novelties added in this version. In section 2 this document provides a detailed analysis of FP7 participation patterns in 2012, and for the overall period from 2007 to 2012. FP7 implementation management and quality issues are the focus of section 3 and include the current situation with regard to the simplification process and also the results of an annual National Contact Points (NCPs) survey on FP7 implementation and simplification. Section 4 presents some of the elements of the Framework Programme which deserve special focus. Section 5 looks at the achievements of the Framework Programme.
The main new feature in this report is the presentation of the first results from the new SESAM Research Performance and Impact Reporting tool (RESPIR). This application provides, for the first time in the history of the Framework Programme’s implementation, a solid quantitative and some qualitative basis for assessing the outputs of Framework Programme projects. More specifically, the tool presents statistical data on bibliometrics, intellectual property rights, workforce statistics, gender and ethical issues based on FP7 project final reports. For the time being, RESPIR reports on data derived from projects administered by DG RTD and the Research Executive Agency (REA).
Section 2 provides information on FP7 participation patterns in 2007-2012. The following selected facts and figures highlight some of the main features of this chapter:
The magnitude of FP7 is illustrated by the impressive participation figures: during six
years of FP7, 379 concluded calls received more than 113.000 proposals, out of which more than 103.000 – involving more than 485.000 applicant organisations and individuals – were included in the evaluation procedure, and more than 20.000 – involving more than 105.000 participants – were finally retained for negotiations, with a corresponding requested EU funding of € 32,8 billion. Proposals and applicants had an average success rate of 19% and 22% respectively.
More than half of all recorded calls in 2012 were launched under the Specific
Programme Cooperation. Higher and secondary education institutes (HES) remain in 2012 the main beneficiaries of FP7, both in terms of numbers of applicants and requested EU funding, with respectively 39% and 29% of the total in retained proposals.
On the participation of Small and Medium Enterprises (SMEs), it is estimated that
during the first six years of FP7 implementation, 17% of all participants in signed grant agreements were SMEs.
As a novelty, maps present a visual distribution of FP7 participation counts, as well as
the EU financial contribution at NUTS3 level.
The significant international dimension of FP7 is illustrated by the fact that over a
period of five years it funds projects with participant organisations from as many as 170 countries. Outside the group of EU and Associated Countries the biggest participants are the USA, Russia, China, Brazil and India.
On the gender dimension of FP7 participation, it is estimated that 21,1% of contact
Section 3 focuses on FP7 implementation management and quality issues.
On the redress and ethical review procedures, out of the 3.160 requests for redress
received, only 72 led to a re-evaluation, whereas 1.766 ethical reviews were organised so far with no project having been stopped.
The average Time-to-grant for the whole of FP7 is 320 days representing an
improvement compared to previous years.
Section 5 provides information on achievements of the Framework Programme.
By mid-May 2013, over 16.000 publications were reported by the 3.220 projects for
which the final reports have been processed. Almost half of these reported publications were publications in High Impact Peer Reviewed Journals.
Similarly, these projects reported 505 patent applications.
Annex B provides more detailed statistical information on various aspects of FP7 implementation.
Feedback from readers and users is most welcome as it will help to improve the next reports to be produced under the Framework Programme.
Please send your comments to:
European Commission
Directorate-General for Research and Innovation Unit A.5 'Evaluation'
Dr Peter FISCH
1
I
NTRODUCTION
The legislative basis for FP7 states that "the overriding aim of the Seventh Framework Programme is to contribute to the Union becoming the world's leading research area. This requires the Framework Programme to be strongly focused on promoting and investing in world-class state-of-the-art research, based primarily upon the principle of excellence in research [...] The objectives [...] should be chosen with a view to building upon the achievements of the Sixth Framework Programme towards the realisation of the European Research Area and carrying them further towards the operation of the European Research Area to underpin the development of a knowledge-based economy and society in Europe which will meet the goals of the Lisbon strategy in Community policies." 1
A new structure was designed to capture the broad range of research activities funded by the European Union under FP7. The objectives of FP7 have been grouped into four categories: "Cooperation", "Ideas", "People" and "Capacities". For each type of objective, there is a specific programme that corresponds to one of the main areas of EU research policy. In addition, the Joint Research Centre's (JRC) direct actions relating to non-nuclear research are grouped under a specific programme with its own budget allocation. The JRC's direct actions in the field of nuclear research and the indirect actions supported
by the EURATOM 7th Framework for Programme for Nuclear Research and Training
Activities comprise distinct strands of FP7.
That structure can be further broken down into the general headings given in the diagram below. In broad terms:
The Specific Programme Cooperation provides project funding for collaborative,
transnational research. The programme is organised through themes such as health, energy, transport etc.
The Specific Programme Ideas provides project funding for individuals and their
teams engaged in frontier research. This programme is implemented by the European Research Council (ERC).
The Specific Programme People funds actions to improve the training, career
development, and mobility of researchers between sectors and countries worldwide. It is implemented through the Marie Curie Actions and Specific Actions to Support ERA policies (in particular EURAXESS).
The Specific Programme Capacities funds actions that are designed to improve
Europe's research infrastructure and the research capacity of SMEs. It also hosts smaller programmes relating to Science in Society, Regions of Knowledge, Research
Potential, International Cooperation, and the Coherent Development of Research Policies.
This structure of FP7 is illustrated in Table 1 below. Figure 1 shows the budget breakdown for FP7.
FP7 builds on the achievements and good practice of earlier Framework Programmes with a good deal of continuity both at an operational level and in terms of strategic objectives. There are however, a number of novelties which represent a significant change compared to previous Framework Programmes. These novelties were presented in more detail in the First FP7 Monitoring Report.
Table 1: Structure of FP7 – Specific Programmes and Thematic Areas.
Specific
Programmes Thematic Areas
Abbreviation used in graphs
C
OOP
E
R
A
T
ION
Health Health
Food, Agriculture, and Biotechnology KBBE
Information and Communication Technologies ICT
Nanosciences, Nanotechnologies, Materials and new Production Technologies NMP
Energy Energy
Environment (including Climate Change) ENV
Transport (including Aeronautics) Transport
Socio-economic Sciences and Humanities SSH
Space Space
Security Security
General Activities General
IDEAS Starting Independent Researcher Grants ERC
Advanced Investigator Grants ERC
P
E
O
PL
E
Initial Training of Researchers MarieCurie
Lifelong Training and Career Development MarieCurie
Industry - Academia Partnerships and Pathways MarieCurie
The International Dimension MarieCurie
Specific Actions SA
C
AP
AC
IT
IE
S
Research Infrastructures INFRA
Research for the Benefit of SMEs SME
Regions of Knowledge Regions
Research Potential Potential
Science in Society Society
Coherent Development of Research Policies Policies
Activities of International Cooperation INCO
EURATOM Indirect Actions
Fusion Energy Fusion
Nuclear Fission and Radiation Protection Fission
Direct Actions Nuclear Field (undertaken by JRC)
JRC (Direct Actions)
Prosperity in a Knowledge Intensive Society
Solidarity and the Responsible Management of Resources Security and Freedom
Europe as a World Partner
Figure 1: FP7 budget breakdown in € million (FP7 EURATOM budget of € 2,7 billion over 5 years not included).
COOPERATION 32.413
IDEAS 7.510
PEOPLE 4.750
CAPACITIES 4.097 JRC
2
FP7
P
ARTICIPATION
P
ATTERNS IN
2012
2.1
Overall participation
This section aims to provide a comprehensive statistical overview of FP7 implementation in 2012 as well as a comparative overview of the period 2007-2012. The data used in this section are exclusively drawn from the Common Research Data (CORDA) warehouse.
Some of the terms used throughout this section which require definition or clarification are the following:
A call for proposal is concluded when data on the evaluation and selection outcome
are available and have already been communicated to the respective FP7 Programme Committees at the time of data extraction.
The dataset of included proposals, on which the analysis of participation patterns
and success rates in this section is based, consists of eligible proposals, i.e. submitted proposals that fulfil the formal eligibility criteria set by the respective calls for proposals, without taking into account:
o duplicate and withdrawn proposals;
o eligible first stage proposals in the case of two-stage calls.
Success rates are always calculated as ratios of retained to included proposals. This report is based on statistical data on calls for proposals with closure dates in 2007 -2012, which have been concluded by February 2013. The reported numbers of concluded calls are not final, especially for 2012, and are likely to rise in the course of FP7 as more calls are concluded and recorded in the CORDA database. For this reason the reported statistical data for past years are always retrospectively updated in subsequent Monitoring Reports; this is also applied in this report to the data for 2010 and 2011, which have been updated according to the latest available information. It is, therefore, important to keep in mind the preliminary nature of the 2012 data included in this report, as later updates are likely to affect the analysis.
Recently signed grant agreements are continuously added in the CORDA database in the course of the Framework Programme implementation, and figures on signed grant agreements are updated accordingly. Due to the constantly changing picture of grant agreement statistics, the time lag of this procedure, and the consequent limited availability of data on grant agreements signed during the most recent year at the moment of data extraction, the Monitoring Reports follow the convention of only presenting cumulative statistics on grant agreements instead of statistics on a year by year basis.
Box 1: Data issues and methodology
The Monitoring Report 2012 is based on data from the E-CORDA. Data extraction was carried out on 26 February 2013. The presented tables and data analysis are based on 379 calls.
It should be noted that the proposals figures for 2012 are based on the calls concluded in 2012, while signed grant agreement figures are based on the grants signed in 2012.
For EURATOM, data for collaborative projects on Fusion is not included. Data on Galileo financing is also not included in the report.
The FP7 proposals and participants database contains information on calls for proposals for which validated evaluation and selection data is available centrally and has already been communicated to the respective FP7 Programme Committee configurations. Call-specific evaluation and selection results enter the system almost on a daily basis and are then validated by the responsible Commission services. Commission services cannot be held responsible for the quality and content of applicant-supplied information contained in submitted proposals.
'Unique Registration Facility' (URF) for participants.
Information on the type of activity and legal status, including SME status, at the proposal submission phase is provided by the applicant organisation; this information is not verified by Commission services before the proposal is retained for negotiation and, consequently, is subject to considerable identification and measurement error which limits the reliability of this type of data. It is expected that such inconsistencies will be sorted out with the introduction of more intelligent data acquisition system, such as a revised version of the Electronic Proposal Submission System (EPSS).
Summary statistics on FP7 including proposals, applicants and success rates by funding scheme, applicant activity type and nationality are based on (i) eligible proposal and participants data submitted to single stage calls for proposals and (ii) second stage eligible proposal and participants data for FP7 calls for proposals involving two-stage proposal submission and evaluation procedures, without taking into account data from proposals submitted to the first stage of the calls. First stage proposals are, in most cases, reduced or outline versions of the full proposal and they do not provide data on participants other than the coordinator and, therefore, no meaningful statistics on participant nationality or type of activity can be compiled. Following evaluation, each proposal is associated to an Evaluation Summary Report (ESR) and the resulting evaluation outcome. Those proposals that pass to the second stage of the evaluation are submitted in full together with complete participants' data thus allowing for statistical analysis, and first stage data are overwritten by second stage data. Following the second stage evaluation each proposal is once again associated with the corresponding ESR, evaluation outcome and, finally, an EC decision.
The following limitations in the availability of financial data in "Ideas" and "People" proposals need to be carefully considered when drawing conclusions on the basis of reported statistics:
Applicants' data in proposals submitted under the Ideas (ERC) and People (Marie Curie Actions) specific programmes generally refer to hosting organisations rather than to individual applicants. In proposals submitted under Ideas/Capacities no activity types are specified for the hosting organisations. Information on activity type is available only when the grant agreement is signed.
In proposals submitted under People data on total cost and requested EU contribution are generally not provided; the only exception is a limited number of People related calls for proposals for Coordination and Support Actions (CSA), which contain data on total cost and requested EU contribution both at proposal and applicant level.
2.1.1 Calls, proposals, applicants and corresponding success rates The 53 calls for proposals with call closures dates in 2012 recorded in CORDA by February 2013 attracted a total of 17.646 applications for funding. The majority of submitted proposals (98% or 17.374) was 'included' (as defined above), and less than a fifth of those (3.089) were retained for funding negotiations with an overall success rate of 18% – comparable to the average success rate of the 2007-2012 period (19%).
In February 2013, included and retained proposals involved a total of 70.955 and 14.821 applicants respectively with an overall success rate of 21%. The recorded numbers of applicants in retained proposals so far are higher than in 2011 (12.821), but still much lower than those recorded in 2009 (19.471). The success rate in 2012 is slightly lower than the average for the six years (22%).
The aggregate figures for the period 2007-2012 show that for a total of 379 concluded calls, 113.508 proposals were submitted, out of which 103.894 – involving 485.150 applicants – were included, and 20.190 – involving 105.909 applicants – were retained for negotiations. The average success rate for the five-year period was 19% in terms of proposals and 22% in terms of applicants. For more detailed statistics see Table B2 in Annex B.
2.1.2 Project costs, requested EU contribution and corresponding success rates
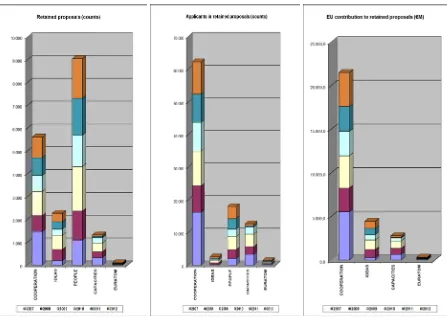
The included proposals, which correspond to the 53 recorded calls in 2012, involved a total project cost of € 37,1 billion with a requested EU contribution of € 30,7 billion. After the evaluation and selection stage the requested EU contribution is € 4,9 billion, corresponding to a success rate of 16%, lower than the average for the six years (19%).
For more detailed statistics on the numbers of included and retained proposals, applicants, budgets and the corresponding success rates see also Figure 2 below, as well
[image:10.595.74.521.136.455.2]as Tables B8-B11 in Annex B2.
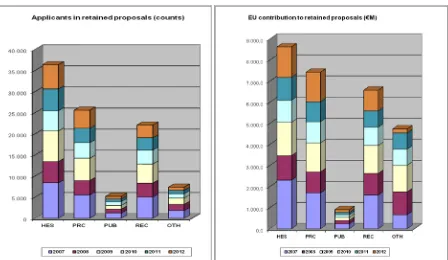
Figure 2: Numbers of proposals, applicants and amounts of requested EU financial contribution (in €million) in retained proposals for FP7 calls concluded in 2007 - 2012 by specific programme.
Specific Programme COOPERATION
More than half (31) of all recorded calls in 2012 was launched under the Specific Programme Cooperation. Under Cooperation, a quarter of all included (4.402) and retained (898) proposals were received, involving more than 60% of all applicants (43.251 and 9.863 respectively).
The aggregate figures for FP7 subscription and participation under Cooperation in 2012 in terms of numbers of proposals, applicants and amounts of budgets as recorded in CORDA at the time of data extraction (February 2013) are higher than in 2011 and 2010, but lower than in 2009, both in terms of included and retained proposals, while success rates are generally lower than those in past years (see Table B2 in Annex B).
More than one third of all retained proposals under Cooperation in 2012 come from the thematic area of Information and Communication Technologies followed by Health (17,6% of proposals) and Nanosciences, Nanotechnologies, Materials and new Production
Technologies (12%). The highest success rates in one stage calls were recorded in Transport, the lowest in Socio-economic Science and Humanities.
2 When comparing the information provided for the different years, it should be kept in mind that in 2007, European Research
Specific Programme IDEAS (European Research Council)
As recorded in the CORDA database by February 2013, 6 calls with closure dates in 2012, which were launched by the European Research Council (ERC) attracted 3.177 proposals, 3.104 of which were included in the selection but only 373 of those were retained for negotiations – representing slightly more than a tenth of the total number of retained proposals in 2021 – with a corresponding success rate of 12%.
The requested EU contribution amounts to an estimated € 836 million or € 1,87 million per applicant with a success rate of 8%.
Specific Programme PEOPLE (Marie Curie Actions and specific policy initiatives)
11 concluded calls (10 calls managed by the Research Executive Agency (REA) and 1 by DG RTD) with closure dates in 2012 were launched under the Specific Programme People. The calls received more than half of all included and retained proposals (9.360 and 1.736 respectively) with 27% and 25% of all applicants respectively.
The recorded average success rates at the level of proposals and at the level of
applicants3 were 19%. This is lower than the average success rates for the six-year
period – 24% and 23% respectively.
Due to the specific design of a number of the Marie Curie Actions (financial support to individual researchers in liaison with a 'host organisation' as legal entity – see box 1 for a more detailed explanation) the CORDA database does not provide comprehensive information on projects costs and corresponding EU financial contribution.
Specific Programme CAPACITIES
The 4 calls with call closure dates in 2012, which were launched under the Specific Programme Capacities, attracted around 3% of all included and retained proposals. In 2012, the numbers of applicants and amounts of requested EU contributions were slightly higher than in 2011, but considerably lower than those of previous years. The thematic area under Capacities with by far the largest share of included proposals was Research
Potential (60% of proposals), while the highest number of retained proposals was
recorded in Science in Society (58% of proposals).
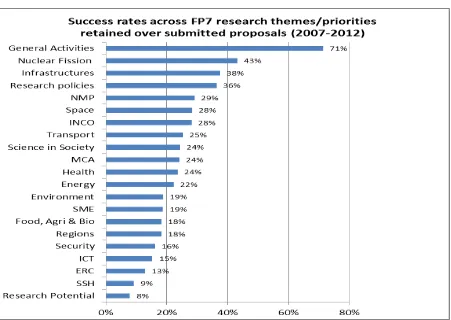
FP7 Success rates
Overall, the FP7 success rate (proposals) is moving around 20% over the years of FP7 implementation, but is varying across different programmes. Success rates in the Cooperation programme is continuously improving, while the specific programme People is getting more competitive over time. Very competitive calls were recorded under the Capacities programme in 2012. The Ideas programme remains the most competitive programme: despite its growth the success rate still remains under 15%.
3It should be noted that 70% of the Marie Curie Actions budget is allocated for actions with much lower success
Figure 3: Trend in the FP7 success rates in retained over submitted proposals by specific programme 2007-2012.
Success rates across FP7 research themes vary significantly from the overall global FP7 success rate (19%). In some cases, this is a result of different types of call procedures. In two-stage calls (mostly in Health, Environment, Nanosciences, Nanotechnologies,
Materials and new Production Technologies), 1st stage proposals are excluded from
calculations; these thematic priorities therefore generally record higher success rates.
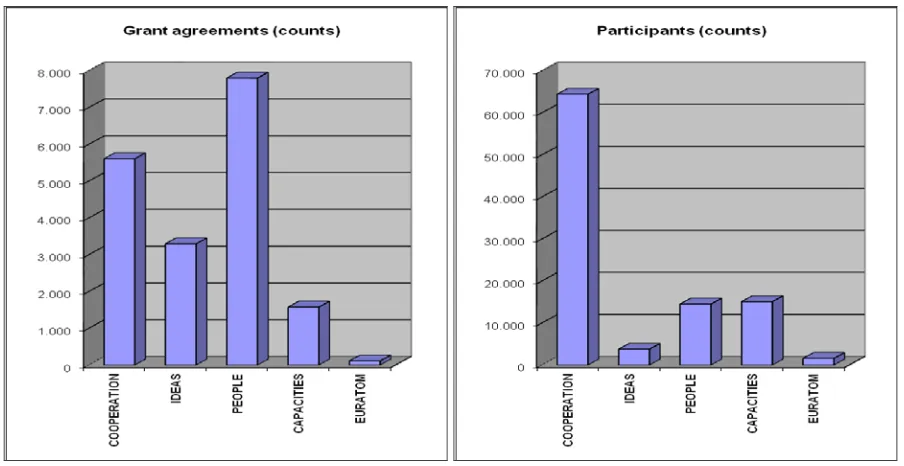
[image:12.595.75.526.424.744.2]2.1.3 Signed grant agreements, participants and EU contribution
As explained in the introductory paragraph of this section, recently signed grant agreements are continuously added in the CORDA database. Given the constantly changing picture of the statistics on grant agreements, due to the continuous update of the database, it is deemed more informative to examine the cumulative situation, as presented in Table 2 and Figure 5 below.
[image:13.595.69.521.388.621.2]For the concluded calls with closure dates in 2007-2012 as of February 2013, 18.394 grant agreements have been signed, which involve 99.346 participants and will be funded by the EU with an amount of € 32,5 billion.
Table 2: Numbers of FP7 signed grant agreements, participants and EU contribution (in € million) for concluded FP7 calls with closure dates in the period 2007-2012 by specific programme.
SPECIFIC PROGRAMME GRANTS HOLDERS GRANT EU CONTRIBUTION (€ Million) CONTRIBUTION PER AVERAGE EU GRANT (€ Million)
COOPERATION 5.606 64.410 20.567 3,67
IDEAS 3.297 3.776 5.289 1,60
PEOPLE 7.801 14.500 3.371 0,43
CAPACITIES 1.577 15.071 3.002 1,9
EURATOM 113 1.589 293 2,6
TOTAL 18.394 99.346 32.523 1,77
Figure 5: Numbers of signed grant agreements and participants for FP7 calls concluded during the period 2007-2012 (as of February 2013)
2.2
Participation by funding scheme
This report examines the following funding schemes which have been employed in FP7:
Collaborative Projects, including combinations of Collaborative Projects and
Coordination and Support Actions (CP)
Coordination and Support Actions (CSA)
Networks of Excellence (NoE)
Research for the Benefit of Specific Groups (BSG)
European Research Council (ERC)
Similarly to previous years, in 2012 Marie Curie Actions attracted by far the largest number of included and retained proposals (more than half of the total) followed by
Collaborative Projects with a quarter of the total. However, Collaborative Projects made
up more than half of the total number of applicants and more than two thirds of the total requested EU contribution in retained proposals.
Only 2 retained proposals were recorded under the Networks of Excellence funding scheme involving a mere 22 applicants, slightly less than in 2011 (3 and 57 respectively).
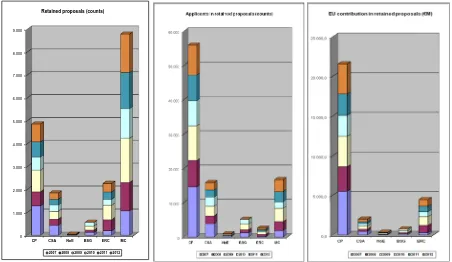
[image:14.595.71.523.256.518.2]367 retained proposals involving 435 applicants were recorded for the ERC, slightly more than in 2011 (323 and 363 respectively), but still less than in 2009 (629 and 680).
Figure 6: Numbers of retained proposals, numbers of applicants and amounts of requested EU financial contribution (in € million) in retained proposals for FP7 calls concluded in 2007 - 2012 by funding scheme
0 1.000 2.000 3.000 4.000 5.000 6.000 7.000 8.000 9.000
CP CSA NoE BSG ERC MC Retained proposals (counts)
2007 2008 2009 2010 2011 2012
2.3
Participation by type of organisation
Data on the type of activity of participating organisations in FP7 is collected according to a classification scheme which groups organisations in the following categories:
Higher or secondary education (HES)
Private for profit (excluding education) (PRC)
Public body (excluding research and education) (PUB)
Research organisations (REC)
Other (OTH)
Figure 7: Numbers of applicants and amounts of requested EU financial contribution (in € million) in retained proposals for FP7 calls concluded in 2007 - 2012 by type of organisation
The amount of FP7 financial contribution is steadily growing over the years of FP7 implementation. With the exception of public bodies excluding education (PUB) with relatively marginal and stable growth trend and Research organisation (REC) in 2012, all other organisation types are recording a stable growth in FP7 financial contribution over the years of FP7 implementation. Higher and secondary education organisations (HES) - also the biggest shareholder of FP7 funds - record higher growth than other types of organisations, which all show a similar trend of more than € 100 million increase in FP7 financial contribution per year.
Figure 8: EU financial contribution (in € million) in the signed grant agreements for FP7 calls concluded in 2007 -2012 by type of organisation.
Relative % (2012)
[image:15.595.72.526.493.755.2]2.3.1 Academia participation
Higher and secondary education institutes (HES) remain in 2012 the main beneficiaries of FP7, in terms of both numbers of applicants and requested EU funding, with 39% and 29% respectively of the total in retained proposals. This is a slight decrease compared to the previous year (40% and 30% respectively).
Top academic participants
Table 3 below presents the general and within-group rankings of the 10 higher or secondary education institutions with the highest numbers of FP7 participations in signed grant agreements during the period 2007-2012. There are no changes in the top 10 HES list compared to the top 10 list in 2011.
Table 3: Ranking of top 10 HES organisations in FP7 signed grant agreements in terms of counts of participations for the period 2007-2012.
HES
rank Overall rank Organisation Participa-tions Country
1 3 THE UNIVERSITY OF CAMBRIDGE 570 UK
2 8 THE UNIVERSITY OF OXFORD 504 UK
3 9 IMPERIAL COLLEGE OF SCIENCE, TECHNOLOGY AND MEDICINE 490 UK 4 10 EIDGENOESSISCHE TECHNISCHE HOCHSCHULE ZURICH 442 CH
5 11 KATHOLIEKE UNIVERSITEIT LEUVEN 433 BE
6 12 UNIVERSITY COLLEGE LONDON 428 UK
7 13 ECOLE POLYTECHNIQUE FEDERALE DE LAUSANNE 413 CH
8 18 DANMARKS TEKNISKE UNIVERSITET 300 DK
9 19 KOBENHAVNS UNIVERSITET 297 DK
10 20 THE UNIVERSITY OF EDINBURGH 296 UK
Table B4 in Annex B provides a list of the 50 higher or secondary education institutions with the highest numbers of FP7 participations in signed grant agreements during the period 2007-2012. The top 50 HES organisations represent 12 countries (10 Member States and 2 Associated Countries). The highest number comes from the United Kingdom (14), Germany (6) and the Netherlands (6) followed by Sweden (5). There is just one change in the top 50 list compared to the previous year – Ludwig-Maximilians-Universität
München (DE) instead of Technische Universität Berlin (DE), which was in 55th place in
2012. The biggest jump was demonstrated by the University of Birmingham (UK) - from
37th position in 2011 to 26th position in 2012. The other institutions remained
approximately in the same positions.
2.3.2 Participation of research organisations
Top research organisation participants
Table 4 Ranking of top 10 REC organisations in FP7 signed grant agreements in terms of counts of participations for the period 2007-2012
REC
Rank Overall rank Organisation Participations Country
1 1 CENTRE NATIONAL DE LA RECHERCHE SCIENTIFIQUE 1189 FR
2 2 FRAUNHOFER-GESELLSCHAFT 889 DE
3 4 CONSIGLIO NAZIONALE DELLE RICERCHE 556 IT
4 5 COMMISSARIAT A L’ENERGIE ATOMIQUE ET AUX ENERGIES
ALTERNATIVES 550 FR
5 6 MAX PLANCK GESELLSCHAFT ZUR FOERDERUNG DER
WISSENSCHAFTEN E.V. 540 DE
6 7 AGENCIA ESTATAL CONSEJO SUPERIOR DE
INVESTIGACIONES CIENTIFICAS 528 ES
7 14 TEKNOLOGIAN TUTKIMUSKESKUS VTT 347 FI
8 15 INSTITUT NATIONAL DE LA SANTE ET DE LA RECHERCHE
MEDICALE (INSERM) 332 FR
9 16 DEUTSCHES ZENTRUM FUER LUFT - UND RAUMFAHRT EV 327 DE 10 17 NEDERLANDSE ORGANISATIE VOOR TOEGEPAST
NATUURWETENSCHAPPELIJK ONDERZOEK - TNO 303 NL
Table B5 in Annex B provides a list of the top 50 research organisations. The top 50 research organisations represent 16 countries (12 Member States, the JRC of the European Commission and 3 Associated Countries). The highest number comes from France (9), Italy (7) followed by Germany (6) and Greece (5). There is no significant change compared to the top list of the previous year.
2.3.3 Industry participation
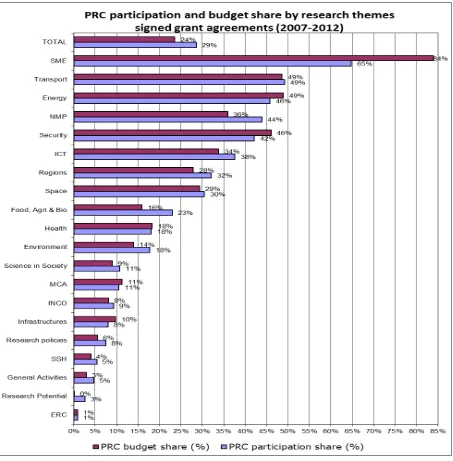
Industry participation in the context of this report means the participation of private-for-profit organisations (PRC), with SMEs being a sub-group. Similarly to previous years, in 2012 private-for-profit organisations (PRC) account for nearly a third of the total number of applicants and the total amount of requested EU contribution in retained proposals.
Figure 9: PRC participation and budget share by research themes in signed agreements 2007 -2012
Top industry participants
Table 5 below presents the general and within-group rankings of the top 10 private-for-profit organisations with the highest numbers of FP7 participations in signed grant agreements during the period 2007-2012. The top 10 list consists of the same companies as in the previous years (2011 and 2010).
Table 5 Ranking of top 10 PRC organisations in FP7 signed grant agreements in terms of counts of participations for the period 2007-2012
PRC
RANK OVERALL RANK COMPANY NAME PARTICI-PATIONS COUNTRY STATUS SME
1 121 SIEMENS AG 105 DE N
2 129 ATOS SPAIN SA 98 ES N
3 142 TELEFONICA INVESTIGACION Y DESARROLLO SA 92 ES N
4 145 THALES COMMUNICATIONS & SECURITY SAS 90 FR N
5 149 D'APPOLONIA SPA 89 IT N
6 155 EADS DEUTSCHLAND GMBH 87 DE N
7 158 SAP AG 86 DE N
8 177 PHILIPS ELECTRONICS NEDERLAND B.V. 78 NL N
9 191 ACCIONA INFRAESTRUCTURAS S.A. 74 ES N
Table B6 in Annex B provides a list of the top 50 private-for-profit organisations with the highest numbers of FP7 participations in signed grant agreements during the period 2007-2012. It is interesting to note that none of the companies figure among the top 100 participants in the overall ranking and only 9 among the top 200. The same situation was recorded in 2011. Overall, there are just 6 new companies in the top 50 list compared to the previous year.
The top 50 private-for-profit organisations represent 13 countries (11 Member States and 2 Associated Countries). The highest number comes from France (13) and Germany (11) followed by Italy (7) and Spain (5). There is no substantial change compared to the top list of the previous year; there are just 4 new companies in the top 50 list compared to the previous year (2011).
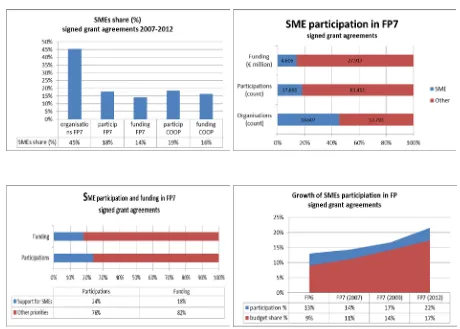
SME participation
[image:19.595.65.525.375.704.2]Figure 10 reflects SME participation patterns in FP7. With the continuous improvement of SME participation rates from FP6 onwards, SMEs now account for 18% of all FP7 participations (17% in 2011) and 14% of FP7 budget (19% and 16% respectively in the Cooperation programme). At the same time they represent over 45% of all FP7 participating organisations (43% in 2011). These figures indicate SMEs have highly fragmented FP7 participation patterns. While around 20% of all participations and funding comes from the FP7 SMEs specific programme, the vast majority originates from the other FP7 priorities.
Top SME participants
For the period 2007-2012, 63% of distinct organisations participating in FP7 signed grant agreements have participated only once, while 94% of the organisations have participated less than 10 times.
SMEs account for 45% of all organisations participating in grant agreements for the period 2007-2012. 72% of distinct SME organisations participating in FP7 signed grant agreements have participated only once while 98.9% of the organisations have participated less than 10 times, with only 120 SMEs (1,1%) participating 10 or more times.
The average EU contribution to SMEs participating in FP7 for the period of 2007-2012 is € 257.240. This is about three-quarters of the average EU contribution to non-SME participants (€ 380.858).
Table 6 below presents the general and the within-group rankings of the 25 private-for-profit SMEs with the highest numbers of participations in FP7 signed grant agreements during the period 2007-2012. The top 25 private-for-profit SMEs represent 13 Member States. The highest number comes from France (6) and Italy (5) followed by Spain (4). There is some change compared to the top list of the previous year, with 6 new companies in the top 50 list compared to the previous year (2011).
Table 6: Ranking of top 25 SME (PRC) participant organisations in FP7 signed grant agreements in terms of counts of participations for the period 2007-2012.
SME
RANK OVERALL RANK COMPANY NAME PARTICI-PATIONS COUNTRY
1 289 CENTRE DE RECERCA I INNOVACIO DE CATALUNYA S.A. 50 ES
2 311 ARTTIC 45 FR
3 491 EUROPEAN ROAD TRANSPORT TELEMATICS IMPLEMENTATION
COORDINATION ORGANISATION S.C.R.L. 30 BE
4 498 GABO:MI GESELLSCHAFT FUR ABLAUFORGANISATION:
MILLIARIUM MBH & CO KG GAB O 30 DE
5 533 INNOVACIO I RECERCA INDUSTRIAL I SOSTENIBLE SL 28 ES
6 557 LABOR S.R.L. 27 IT
7 626 UNION INTERNATIONALE DES CHEMINS DE FER 24 FR
8 631 SIGMA ORIONIS SA 24 FR
9 635 MFKK FELTALALOI ES KUTATO KOZPONT SZOLGALTATO KFT 24 HU
10 642 GEIE ERCIM 23 FR
11 649 ATHENS TECHNOLOGY CENTER SA 23 EL
12 732 ISTITUTO DI STUDI PER L'INTEGRAZIONE DEI SISTEMI (ISIS) 20 IT
13 772 PANTEIA BV 19 NL
14 777 INNOVA SPA 19 IT
15 780 CF CONSULTING FINANZIAMENTI UNIONE EUROPEA SRL 19 IT
16 810 VERMON SA 18 FR
17 833 PROFACTOR GMBH 17 AT
18 841 EUROPEAN RESEARCH AND PROJECT OFFICE GMBH 17 DE
19 842 STARLAB BARCELONA SL 17 ES
20 849 CENTRE FOR SCIENCE, SOCIETY AND CITIZENSHIP 17 IT
21 850 ITTI SP ZOO 17 PL
22 861 INOVAMAIS - SERVICOS DE CONSULTADORIA EM INOVACAO TECNOLOGICA S.A. 17 PT
23 876 C-TECH INNOVATION LIMITED 16 UK
24 882 SOLINTEL M&P SL 16 ES
25 886 LAGRANGE SARL 16 FR
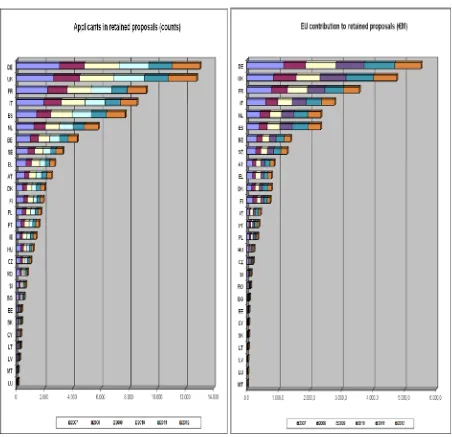
Map 1 below presents FP7 participation by organisation activity type (number of
2.4
International and regional dimensions of FP7
The Framework Programme by conception is a collaborative programme with global outreach open to all researchers and research organisations irrespective of their country of origin. During its first five years of implementation FP7 has attained unprecedented levels of international participation by involving researchers in retained proposals from as many as 170 countries from all continents.
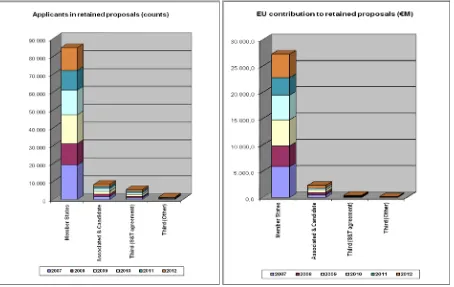
For analytical and comparative purposes participating countries are conventionally grouped in this section in four groups, namely EU Member States, Candidate and Associated Countries, Third Countries with Science and Technology (S&T) agreements, and other Third Countries. It should be emphasised that these groups are largely heterogeneous in terms of the socio-economic characteristics and the scientific and technological capacities of their members, as well as in terms of their FP7 participation levels and performance.
[image:22.595.73.527.351.638.2]For detailed statistical figures on participation by country or group of countries see Table B7 in Annex B. Figure 11 below shows the shares of each of the above groups of countries in applicants and requested EU financial contribution.
Figure 11: Numbers of applicants and amounts of requested EU financial contribution (in € million) in retained proposals for FP7 calls concluded in 2007-2012 by country group.
In the NCP survey conducted in the context of the 2012 monitoring exercise, FP7 National Coordinators and FP7 Coordinators for Specific Fields were asked to assess if FP7 provides sufficient opportunity for international STI cooperation and potential of FP7 to support international STI cooperation. A majority of the 175 respondents (57,71%) consider that FP7 provides 'very good' and 'good' opportunities for international STI cooperation.
2.4.1 EU Member States
corresponding success rates as well as the amounts of EU contribution per applicant in calls with closure dates in the period 2007-2012.
Figure 12: Average success rates of EU27 applicants and requested EU financial contribution for FP7 calls concluded during the period 2007-2012 by country.
Figure 14: Requested EU financial contribution per applicant (in € thousand) in retained proposals for FP7 calls concluded in 2007-2012 by country.
2.4.2 Candidate and Associated Countries
For FP7, the number of Associated Countries is higher than ever, with 14, mainly European countries, currently associated, including all of the Western Balkan States. This makes FP7 a true Pan-European programme and strongly underpins the objective of building a wider ERA. Figures 15 - 17 present the situation in terms of numbers of applicants and requested EU contribution in retained proposals, corresponding success rates, and EU contribution per applicant from Candidate and Associated Countries in the period 2007-2012.
Figure 15: Numbers of applicants from candidate and associated countries and requested EU financial contribution (in € million) in retained proposals for FP7 calls concluded in 2007-2012 by country.
Candidate and Associated Countries constitute a heterogeneous group4, which in 2012
accounted for around 8% of the total number of applicants (no change from the last year) and 9% of the requested EU financial contributions in retained proposals. The corresponding success rates are 21,4% and 16,6% respectively – which are similar to those of the EU27 Member States (20,9% and 16,2%) in 2012.
4 In 2012, the Candidate and Associated Countries were Albania (AL), Bosnia-Herzegovina (BA), Croatia (HR), Faroe Islands,
(FO) Former Yugoslav Republic of Macedonia (MK), Iceland (IS), Israel (IL), Liechtenstein (LI), Montenegro (ME), Moldova (MD), Norway (NO), Serbia (RS), Switzerland (CH), and Turkey (TR).
Figure 16: Average success rates of applicants from Candidate and Associated Countries and of requested EU financial contribution for FP7 calls concluded during the period 2007-2012 by country.
Figure 17: Requested EU financial contribution per applicant (in € thousand) in retained proposals for FP7 calls concluded in 2007 - 2012 for candidate and associated countries.
Switzerland, Norway and Israel rank in the top three positions for the number of applicants and requested EU contribution among this group of countries. The top 5 collaborative links for these 3 countries are exactly the same – Germany, United Kingdom, France, Italy and Spain. In Switzerland, the biggest number of grant holders is in the Information and Communication technologies thematic sector, followed by Marie Curie Actions and Health. In Norway, the leading thematic areas are Research for the benefit of SMEs, Information and Communication Technologies and Environment (including Climate change). Israel is most active in Marie Curie Actions, followed by Information and Communication Technologies and Health thematic sectors. There are no structural changes compared to the previous year in either collaborative links or leading thematic priorities.
2.4.3 Third Countries
For FP7, a new approach towards international cooperation was developed, aiming to reinforce international research collaboration throughout the Framework Programme. Special instruments (SICA - Specific International Cooperation Actions, coordinated calls, twinning of projects, etc.) were established to implement these objectives allowing both
geographical and thematic targeting5. In addition, a specific programme dedicated to
international cooperation provides funding to support activities (INCO-NETs, BILATs, ERA-NETs, NCP networks, etc.) designed to underpin the S&T policy dialogue and promote cooperation opportunities under FP7 for international partners.
International Cooperation activities are also reinforcing the external dimension of the European Research Area (ERA), particularly through the implementation of the Strategic
European Framework for International S&T Cooperation6 and the establishment of the
Strategic Forum for International S&T Cooperation (SFIC), consisting of high-level representatives from the Member States and the Commission.
In addition, the 'EURAXESS Links' initiative7 (funded under the Specific Actions part of
the People Programme) helps to maintain the link with European Researchers abroad to keep them updated on research policy, funding and cooperation opportunities in Europe, while reinforcing their role as catalysts to boost cooperation with their host countries (USA, Japan, China, Singapore and India).
This approach, together with the general opening of all activities to Third Country teams, has reinforced the international dimension of FP7, which has grown in volume and focus.
In 2012, there were 897 applicants from as many as 87 Third Countries with a total requested EU financial contribution of €68 million in retained proposals and corresponding success rates of 24,5% and 14,5% respectively. These figures represent just 6% of the total number of applicants and 1,4% of the total amount of requested EU contribution in retained proposals.
19 Third Countries concluded S&T cooperation agreements8 with the European Union.
This group of countries includes all the industrialised and emerging economies and several developing countries. These countries accounted in 2012 for more than three quarters (86,3%) of the total number of Third Country applicants and for 67,3% of the total requested EU contribution to Third Countries in retained proposals, with success rates of 25,7% and 13,5% respectively.
In terms of numbers of successful applicants, the 10 biggest Third Country participants in 2012 have been (in descending order) the USA, Russia, China, Brazil, India, South Africa, Australia, Canada, the Ukraine, and Argentina. In terms of EU financial contribution, the 10 biggest beneficiaries (in descending order) have been the USA, Russia, India, South
Africa, China, Brazil, the Ukraine, Egypt and Mexico. All of these countries have S&T
agreements with the EU. Figures 18, 19 and 20 below present the situation of the 19 Third Countries with S&T agreements in terms of numbers of applicants and requested EU financial contribution (in € million) in retained proposals, the corresponding success rates and the EU financial contribution per applicant (in € thousand). The ranking is according to the cumulative performance of the countries during the period 2007-2012.
6 European Commission (2008): Communication "A strategic European Framework for International Science and Technology Cooperation". COM (2008) 588.
7 http://ec.europa.eu/euraxess/links/index_en.htm
8 Argentina (AR), Australia (AU), Brazil (BR), Canada (CA), Chile (CL), China (CN), Egypt (EG), India (IN), Japan (JP), Jordan (JO), Mexico (MX), Morocco (MA), New Zealand (NZ), Russia (RU), South Africa (ZA), South Korea (KR), Tunisia (TN), Ukraine (UA), United States (US).
Figure 18: Numbers of applicants from third countries with S&T agreements and amounts of requested EU financial contribution (in € million) in retained proposals for FP7 calls concluded in 2007 - 2012.
Figure 20: Requested EU financial contribution per applicant from third countries with S&T agreements (in € thousand) in retained proposals for FP7 calls concluded in 2007 - 2012
The USA, Russia and China ranks in the top three positions for number of applicants, while the USA, Russia and India are in the top three positions for requested EU contribution among this group of countries. Top 2 collaborative links for these 4 countries are exactly the same – Germany and United Kingdom followed by France, Italy, Spain and the Netherlands. In the USA, the biggest number of grant holders is in the Health Theme in FP7, followed by Information and Communication technologies and by Food, Agriculture and Biotechnology. In Russia, the leading Themes are Transport, Space and Food, Agriculture and Biotechnology. India is most active in Health, Environment (including Climate change) and Information and Communication technologies. In China, the most active research areas are Environment (including Climate change), Food, Agriculture and Biotechnology and Information and Communication technologies.
2.4.4 Regional dimension
The European Union has developed a geocode standard for referencing the subdivisions of countries for statistical purposes. The Nomenclature of Units for Territorial Statistics (NUTS) is instrumental, for instance, in the European Union's Structural Fund delivery mechanisms. For each EU Member State, a hierarchy of three NUTS levels has been
established9. It should be noted that the subdivisions in some levels do not necessarily
correspond to administrative divisions within the country.
This report presents information on FP7 participation by European region, based on NUTS3 regions identified in CORDA. There are currently 1.184 NUTS3 EU27 regions recorded in CORDA, covering 91% of the total EU (the remaining participations not being attributed to a specific region, but at NUTS2 or the national level), so coverage is complete and reliable.
Top 50 regions as participants
The top 5 regions are the same as in the previous year. Maps 1 and 2 illustrate FP7 participation (number) and the EU financial contribution (million Euro) at NUTS3 level. Table B3 in Annex B provides statistics on collaborative projects for EU27.
Table 7: Ranking of top 50 EU27 NUTS3 (NUTS2 where NUTS3 is not available) regions in terms of counts of participations in FP7 signed grant agreements and in terms of EU contribution for the period 2007-2012.
Rank by
participation Contribution Rank by EU NUTS Code Region Partici-pations Contribution EC Financial
1 1 FR101 Paris 4.381 1.893.534.458
2 4 ES300 Madrid 2.545 785.345.185
3 5 ITE43 Roma 2.348 702.641.532
4 2 DE212 München, Kreisfreie Stadt 2.288 1.093.299.488
5 3 UKI11 Inner London - West 2.133 911.052.029
6 6 ES511 Barcelona 1.815 603.586.937
7 10 EL300 Attiki 1.673 465.019.232
8 17 BE100 Arr. de Bruxelles-Capitale 1.542 360.232.447
9 12 AT130 Wien 1.341 429.349.677
10 11 ITC45 Milano 1.335 438.170.314
11 9 FI181 Uusimaa 1.310 474.566.443
12 7 SE110 Stockholms län 1.255 506.130.256
13 16 DE300 Berlin 1.013 364.365.481
14 8 CH040 Zürich 993 488.860.511
15 13 NL326 Groot-Amsterdam 946 409.139.345
16 18 FR105 Hauts-de-Seine 899 340.491.917
17 14 UKH12 Cambridgeshire CC 879 400.667.853
18 44 HU101 Budapest 847 155.466.745
19 36 PT171 Grande Lisboa 789 177.662.739
20 15 UKJ14 Oxfordshire 779 386.778.674
21 19 BE242 Arr. Leuven 770 332.746.179
22 21 NL333 Delft en Westland 753 306.502.361
23 23 SE232 Västra Götalands län 732 264.055.391
24 30 ITC11 Torino 710 206.402.374
25 46 PL127 Miasto Warszawa 704 149.205.022
26 26 IE021 Dublin 691 237.817.654
27 20 CH011 Vaud 645 315.107.172
28 27 DK011 Byen København 602 222.435.426
29 32 NL221 Veluwe 582 200.668.994
30 65 CZ010 Hlavní město Praha 575 111.760.906
31 35 ES213 Vizcaya 571 179.843.256
32 28 NL310 Utrecht 563 214.124.538
33 70 SI021 Osrednjeslovenska 556 106.814.805
34 41 NO011 Oslo 545 161.314.748
35 29 DEA23 Köln, Kreisfreie Stadt 512 208.393.848
36 62 ES523 Valencia / València 472 115.625.770
37 31 UKM25 Edinburgh, City of 460 203.960.881
38 24 DE125 Heidelberg, Stadtkreis 455 253.723.856
39 39 UKI12 Inner London - East 446 162.616.684
40 34 BE234 Arr. Gent 441 183.093.492
41 119 BG411 София (столица)/ Sofia (stolitsa) 439 60.496.904
42 25 CH013 Genève 438 248.601.248
43 40 DE111 Stuttgart, Stadtkreis 438 162.558.380
44 33 NL414 Zuidoost-Noord-Brabant 426 183.602.649
45 59 EL122 Thessaloniki 411 116.442.343
46 37 DK01* Hovedstaden 410 174.381.942
47 138 RO321 Bucureşti 393 48.998.286
48 52 SE224 Skåne län 392 140.259.137
49 50 DE122 Karlsruhe, Stadtkreis 390 142.806.412
Map 3 – EU Financial contribution (Euro million) 2007-2011 at NUTS 3 level CORDA Common Research Datawarehouse 2013. E-CORDA extraction date: 2013/02/26
2.5
Participation of women and the gender dimension in
FP7
In 1999, early in FP5, the Commission adopted a Communication in which it undertook the commitment to develop a coherent approach towards promoting women in research
financed by the European Union10. The Commission's stated aim was to achieve at least a
40% representation of women in Marie Curie fellowships, Advisory Groups, Assessment Panels and Monitoring Panels of FP5. This target was subsequently expanded to include all groups, panels, committees and projects involved in the Framework Programmes. The 40% target remained in place for FP6 and is also valid for FP7.
2.5.1 Patterns of women participation in FP7 projects
The CORDA database contains data on individuals with assigned contact person roles for each of the organisations participating in FP7 funded projects, for which grant agreements have already been signed. This data includes gender identity. In the thematic area
Information and Communication Technologies data of this type is recorded in the CORDA
database only for the 'Contact Person' role.11
At the moment of data extraction (February 2013) the database contained an estimated total of 310.356 individuals from EU27 participant organisations with assigned contact person roles, whose gender identity has been registered in the database, of which 81.639, or 26,3%, were women. Of all individuals with assigned contact person roles in coordinator organisations, 30,2% (20.966) are women; in participant (non-coordinating) organisations the corresponding share of women is 25,2% (60.673).
Table 8: Gender of individual participants with contact person roles in signed grant agreements from FP7 calls concluded during the period 2007-2012.
Role Coordinator Participant All
F M % F F M % F F M % F
Contact Person 8.534 10.159 45,7% 28.825 51.121 36,1% 37.359 61.280 37,9%
Contact Person for
Legal Aspects 7 4 63,6% 13 13 50,0% 20 17 54,1%
Contact Person for
Scientific Aspects 2.669 10.617 20,1% 13.074 47.961 21,4% 15.743 58.578 21,2%
Marie-Curie
Individual Fellows 2.285 4.169 35,4% n.a. n.a. - 2.285 4.169 35,4%
First Administrative
Officer 3.603 13.135 21,5% 9.905 53.369 15,7% 13.508 66.504 16,9%
Principal Investigator 618 2.599 19,2% n.a. n.a. - 618 2.599 19,2%
Secondary Administrative
Officer 3.250 7.853 29,3% 8.856 27.717 24,2% 12.106 35.570 25,4%
Total 20.966 48.536 30,2% 60.673 180.181 25,2% 81.639 228.717 26,3%
*figures valid for the number of persons linked to the participants in signed FP7 contracts *data for People programme is available only for individual fellowships.
*E-CORDA does not contain gender information in ICT projects Source: E-CORDA as of 26/02/2013
A fifth (20,1%) of all individuals characterised as contact person for scientific aspects in signed grant agreements are women. Women represent more than a third (35,4%) of
10 European Commission (1999): Communication "Women and Science: Mobilising women to enrich European research",
COM(1999)76. Brussels.
11 This is due to differences in the reporting format of the contract management systems used by the different Commission
individuals in the category fellow, which corresponds to the specific programme People (Marie Curie Actions).
7.494 women (24% of total contact persons) were recorded as contact persons in the signed project grant agreements for ICT theme (Cooperation programme) by 31 December 2012. Slightly above one tenth (12,1%) of all individuals characterised as contact person
for technical aspects in signed grant agreements are women. As for the e-infrastructures
activity, 745 women (or 26,4% of total contact persons) were recorded as contact persons in the signed project grant agreements. Approximately 15% of all individuals characterised as contact person for technical aspects in signed grant agreements are women.
[image:33.595.73.530.270.731.2]Figure 21 presents the participation share of women in contact person roles in FP7 signed grant agreements from 2007 to 2012 by country of origin of the participating organisation, for the group of EU27 Member States.
Figure 21: Participation share of women from project participant and project coordinator organisations in contact person and contact person for scientific aspects roles in FP7 signed grant agreements during the period 2007-2012 by EU27 Member State.
women applying to each of the two grant schemes, with an average of 29% in Starting Grants and 15% in Advanced Grants (respectively 29% and 14% in 2011).
Following up on the implementation of the ERC gender equality plan, the ERC has continued to raise awareness about ERC gender policy among potential applicants and to challenge any potential gender bias in evaluation procedures. The numbers of female applicants and their success rates have slightly increased in 2012, particularly with regard to Starting Grants. The ERC is continuously working towards achieving gender balance in the composition of its evaluation panels. The share of women among ERC panel members is, overall, equal to or larger than the share of female applicants, with 29% of women among the panel members for Starting Grant calls and 25% for Advanced Grant calls.
[image:34.595.72.535.343.742.2]Figure 22 presents the participation share of women in contact person roles in FP7 signed grant agreements from 2007 to 2012 by thematic area. It is interesting to observe the considerable variation of female participation shares as the contact person for scientific aspects role among different thematic areas. The highest female participation was recorded in Science in Society, Regions of Knowledge, Socio-economic sciences and Humanities and activities in International Cooperation areas with more than a third of the total. The lowest female participation was recorded in Security (15,4%), Research Infrastructure (15,4%) and Space (14,8%) areas.
Figure 22: Participation share of women in contact person and contact person for scientific aspects
2.5.2 Participation of women in FP7 advisory groups, panels and committees
The share of women in FP7 evaluation panels, i.e. of registered FP7 evaluation experts, was 37,5% a slight decrease from 38,0% in 2011. Out of the existing 14 Advisory Groups under FP7, the percentage of women was 32,5%, no change compared to the previous year.
Table 9: Gender of individual participants in FP7 Advisory Groups
Advisory Group
Total
Members members FEMALE Members MALE %F
1 Energy 23 10 13 43%
2 Environment (including Climate Change) 18 8 10 44%
3 Health 20 9 11 45%
4 Food, Agriculture, Fisheries and Biotechnology 27 9 18 33%
5 International Cooperation 10 4 6 40%
6 NNMP 25 5 20 20%
7 People 15 6 9 40%
8 SME 15 5 10 33%
9 Security 22 6 16 27%
10 SSH 13 5 8 38%
11 Space 23 6 17 26%
12 Transport 21 4 17 19%
13 Regional aspects 14 6 8 43%
14 ICT 25 6 19 24%
271 89 182 33%
In 2012 the percentage of female members of FP7 Programme Committees was 38% (no change compared to the previous year). In the same year female members of the ERC Scientific Council represented 36,3% of the total number of members (increase from 27,3% in 2011). The corresponding figure for the European Research Area Board (ERAB) – the consultative body responsible for advising the EU on the realisation of the ERA – was 45,5% (no change from 2011), which is higher than the respective figure (33% until 2006) for the European Advisory Board (EURAB) – the high-level advisory board established for FP6.
[image:35.595.72.533.503.777.2]Figure 23 below presents in more detail the shares of the participation of women in groups, panels and committees from FP4 to FP7 (1998-2012).
Figure 23: Participation share of women in advisory groups, panels and committees (FP4, FP5, FP6,
FP7).*
Following the evolution of FP7 monitoring and the implementation of the SESAM Research Performance and Impact Reporting tool (RESPIR see section 5), new indicators on gender aspects have been gathered through the final reports of projects of the Cooperation Programme. Gender aspects have been split into two major categories. The first focuses on Gender Equality Actions as further detailed in table 10, while the second relates to the gender dimension in the research content (as shown in table 11). Of the 745 completed Cooperation projects, the Gender aspects section of the Final report was filled in for 737 projects.
Out of the 737 completed projects with a gender aspects report, 208 (28%) provided details on Gender Equality actions undertaken. Actions most frequently undertaken were aimed at designing and implementing equal opportunity policies and at setting targets and measures to improve work life balance. All actions have been judged effective with an average of 89%.
Table 10: FP7 Cooperation programme - completed projects (by June 2013) that reported gender aspects and with Specific Gender equality Actions and Gender Action Types
Priority Area No. of projects having answere d to gender aspects questio ns No. of projects with specific Gender Equality Actions
Gender Action Types Design and
implement an equal opportunity
policy
Set targets to achieve a gender
balance in the workforce
Actions to improve work-life balance
No. % Effective Effective Not Effective Effective Not Effective Effective Not
C OO P E R A T ION
Health 203 71 35% 70 8 60 5 45 5
KBBE 52 14 27% 11 1 13 1 7 1
NMP 125 40 32% 32 6 24 10 25 1
Energy 37 8 22% 4 5 5 1
ENV 91 26 29% 21 2 19 2 17 2
Transport 98 15 15% 8 3 11 2 8 4
SSH 71 26 37% 16 22 2 14
Space 27 3 11% 3 1 2 2 5
Security 27 3 11% 4 4 1
General
Activities 6 2 33% 2 2 2
Total 737 208 28% 171 21 162 24 129 14
As shown in table 11, on average one fifth of the projects that reported on gender aspects in the Cooperation Programme developed the gender dimension in the content of the research. It should be noticed that this percentage varies across priority areas and it ranges from the lowest values of 0% for Space and 6% in the Nanosciences, Nanotechnologies, Materials and new Production Technologies (NMP) to 52% for Socio-economic Sciences and Humanities (SSH).
Table 11: FP7 Cooperation programme - completed projects (by June 2013) that reported gender aspects and number of projects where gender dimension was associated with research content
Priority Area No. of projects with a gender aspects report
No. of projects where gender dimension was associated with the research content
No. %
C OO P E R A T ION
Health 203 50 25%
KBBE 52 7 13%
NMP 125 7 6%
Energy 37 5 14%
ENV 91 11 12%
Transport 98 14 14%