Wilasinee Kingkam1, Chengzhi Zhao1, 2, Hong Li 1, Hexin Zhang 1, 2,*, Li Zhiming 3 1
College of Materials Science and Chemical Engineering, Harbin Engineering University, Harbin 150001, China
2
Key Laboratory of Superlight Materials and Surface Technology, Ministry of Education, Harbin Engineering University, Harbin 150001, China
3
College of Power and Energy Engineering, Harbin Engineering University, Harbin 150001, China *
E-mail: [email protected]
Received: 14 November 2017 /Accepted: 5 January 2018 / Published: 5 February 2018
The hot deformation behavior and corrosion properties of HSLA steels under compression processes were studied. In this paper, the hot compression tests were conducted at a deformation temperature of 800 and 1100°C with strain rates of 0.1, 1 and 10 s-1 using an MMS-200 thermal-mechanical simulator. The true stress-strain curves under different conditions were obtained. The flow stress increases with the increase of strain rate and decreasing deformation temperature. The microstructure, hardness, and electrochemical properties of the specimens were investigated to discover/understand the effect of the deformation temperature on specimens. Microstructure observation shows that the grain size increased with an increase of deformation temperature, and fine AF grains were observed in specimens, which had direct effects on the resulting hardness, leading to the highest hardness values. From the final, optimized hot deformation process, the specimens deformed at the temperature of 800°C and the strain rate of 0.1 s-1 had a completely recrystallized and homogeneous grain structure and could be improved by corrosion resistance better than the as-cast specimens.
Keywords: high-strength low-alloy, hot compression test, ferrite, strain rate, deformation temperature
1. INTRODUCTION
the early 1970s, they have been widely used in many applications in the industry, including in oil and gas production and transportation pipelines, in which there were great economic incentives in developing the methods and materials to alleviate corrosion in metal alloys [3-5].
In order to increase the transport efficiency with a higher pressure and transmission rate in a long-distance pipeline, a high-grade steel with a higher strength and better low-temperature toughness and corrosion resistance is needed. It is well known that the corrosion products formed on steel and iron exposed to various atmospheres consist of lepidocrocite (γ-FeOOH), goethite (α-FeOOH) and magnetite (Fe3O4). Lepidocrocite is usually formed in the early stages of atmospheric corrosion but, as the exposure time increases, it is transformed into goethite in which the content of these materials in the formed rust is dependent on the corrosion condition [6-9]. Corrosion of low carbon steel pipelines can occur in various forms. Many studies have shown that natural gas, crude oil, transportation systems, and bacteriological processes in the seawater contain quantities of hydrogen sulfide and chloride ions which affect the integrity of low carbon steel and continuous damage by the permanent corrosion product layer facilitates the active dissolution of the substrate metal, which causes significant economic loss [10-14].
The corrosion behavior has been tested mainly for solution-treated alloys [15]. It is known that the microstructure and corrosion properties of austenitic steels depend on the heat treatment applied and plastic deformation [16-17]. However, the effect of deformation temperature and strain rate during hot deformation on the corrosion behavior has not attracted the required attention so far. In this study, the comparative investigations of the potentiodynamic polarization behavior of hot deformation with different deformation temperatures and strain rates of HSLA pipeline steels were carried out. Therefore, the combined effects of hot deformation related to the microstructure and corrosion properties of the HSLA pipeline steels were carefully investigated to optimize the hot deformation parameters.
2. EXPERIMENTAL PROCEDURES 2.1. Materials
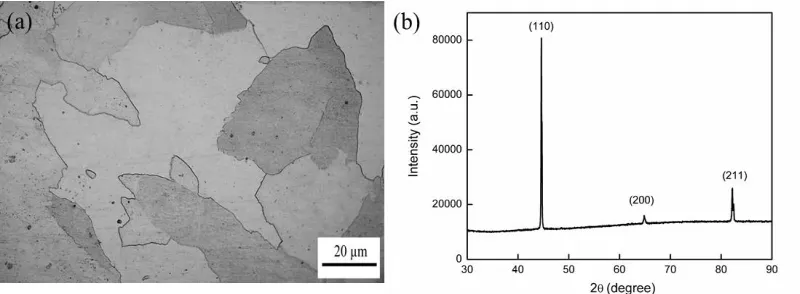
The chemical composition of HSLA pipeline steels casting ingot is shown in Table 1. Fig. 1a shows the microstructure of the steel in the as-cast condition. The XRD pattern of specimens is detected as a single α-ferrite phase of the bcc type in the microstructure (Fig. 1b), proving that the austenite and martensitic transformation did not appear.
Table 1. Chemical composition of HSLA pipeline steels (in wt )
C Si Mn Cr Mo Ni Al Cu Nb Ti V
Figure 1. Microstructure of the HSLA pipeline steels in the as-cast condition: (a) Optical micrograph and (b) X-ray diffraction (XRD) profiles
2.2. Hot compression tests and conditions
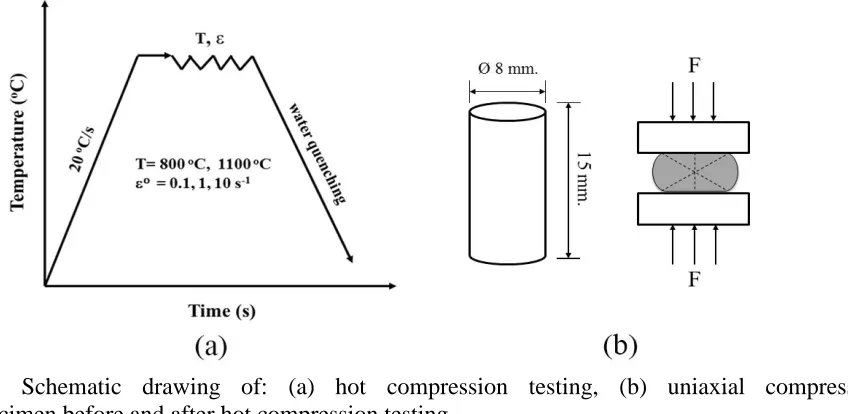
[image:3.596.97.497.70.217.2]Hot compression tests were conducted using an MMS-200 thermal mechanical simulator. The schematic drawing of compression testing is shown in Fig. 2. Cylindrical specimens were prepared that were 8 mm in diameter and 15 mm in height, and the specimens were heated from room temperature to 1250 oC at a heating rate of 20 oC/s for 5 min and then cooled to a deformation temperature with a cooling rate of 5 oC/s. Compression deformation temperatures were performed at 800 and 1100 oC with different strain rates of 0.1, 1, to 10 s-1. After high temperature compression, specimens were immediately quenched in water and all specimens deformed to a total true strain of 0.7. The hot compression under different conditions are shown in Table 2.
Table 2. Hot compression conditions of HSLA pipeline steels
Specimen Temperature (oC) Strain rate (s-1)
as-cast - -
H1 800 0.1
H2 800 1
H3 800 10
H4 1100 0.1
H5 1100 1
H6 1100 10
2.3. Microstructure characterization and Hardness test
[image:3.596.132.471.490.629.2]
1000 micro hardness test (Beijing Wowei Technology Co. Ltd., China) with a load of 9.8 N for loading time 10 s.
Figure 2. Schematic drawing of: (a) hot compression testing, (b) uniaxial compression specimen before and after hot compression testing
2.4. Electrochemical test
The electrochemical test of HSLA pipeline steels were measured using a CHI 660D electrochemical workstation (Beijing Chinese science days Technology Co., Ltd.) using a standard three-electrode cell with the specimen as a working electrode, Platinum foil as the counter electrode and a silver/silver chloride electrode (Ag/AgCl) as the reference electrode. The polarization curves were conducted in 1 M NaCl solution at room temperature, between -1 V and 0.4 V with a scanning rate of 1 mV/s. All specimens acting as working electrodes were embedded in epoxy resin. Electrochemical Impedance Spectroscopy (EIS) was carried out at open circuit potential through a frequency range of 100 kHz to 0.01 Hz at an amplitude of 5 mV.
3. RESULTS AND DISCUSSION 3.1 True stress-strain curve
[image:4.596.103.527.115.322.2]Figure 3. Typical stress-strain curve at the elevated temperature.
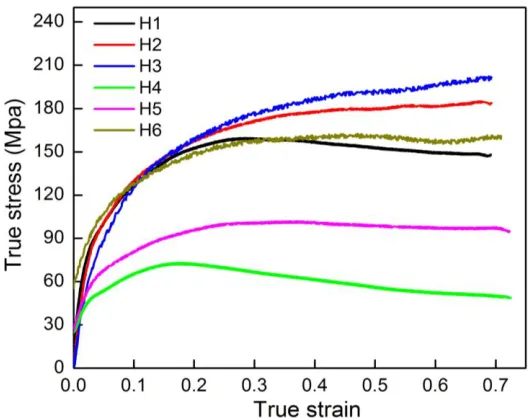
Figure 4. True stress-strain curve of HSLA pipeline steels at different compression conditions
The true stress-strain curves of HSLA pipeline steels deformed at deformation temperatures 800 oC and 1100 oC and different strain rates are shown in Fig. 4. The effect of strain rate and temperature on flow stress are significant under all test conditions. Both the strain and stress peak increases with the elevating strain rate and the peak stress increase with increasing strain rate and decreasing of temperature because dynamic softening dominates work hardening at higher temperatures [21, 22]. Subsequently, the flow stress curves continuously decreases until a balance with work hardening and dynamic softening is achieved.
[image:5.596.187.403.83.263.2] [image:5.596.162.427.300.509.2]
3.2 Microstructure characterization
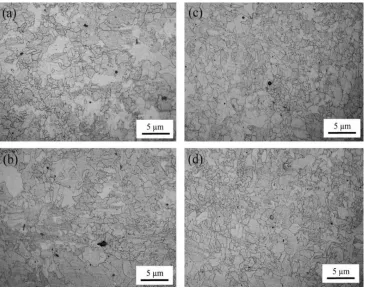
Figure 5. Optical micrograph of HSLA pipeline steels deformed at different strain rates (a) H1, (b) H2, (c) H4 and (d) H5
Figure 6. SEM micrographs of (a) H6 and (b) acicular ferrite microstructure and EDS spectrum area
[image:6.596.117.483.96.385.2] [image:6.596.85.513.449.634.2]this category consisted of stacks of coarse parallel ferrite lamellae occurring intra-granularly, formed by the diffusion of carbon during cooling to form a carbide phase between ferrite plates. In the cast of AF, AF formed during period austenite transformed to martensite after quenching. The characterization of AF is a randomly oriented needle-shaped grain with a basket-weave appearance. Fig. 6a shows the SEM micrographs of acicular ferrite structure and the EDS analysis results was also studied. Complex elements are observed in area, which are rich in Mn, Mo, C, Si and O elements. The oxide inclusion usually has high concentration of Mn, while a few oxide inclusions are observed at the acicular ferrites, which means these oxide inclusions have no obvious role in the formation of acicular ferrite in the specimens.
3.3 Microhardness test
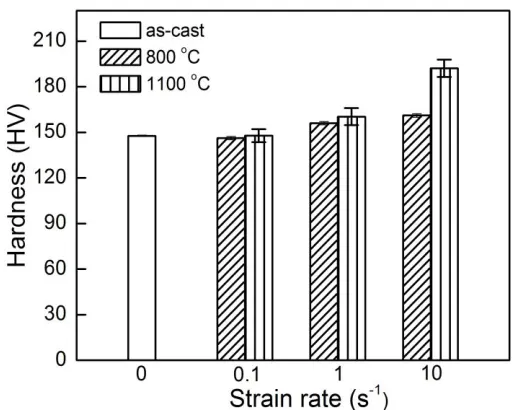
Figure 7. Microhardness results of the HSLA pipeline steels at different compression conditions
[image:7.596.158.415.444.649.2]
cause of the microstructure observations; fine AF grains were observed in specimens which had direct effects on the resulting hardness and led to higher hardness values respectively. Furthermore, the microhardness value of AF is higher than that of PG. Therefore, an increase in deformation temperature increased microhardness values and decreased the grain size.
3.4 Potentiodynamic polarization measurements
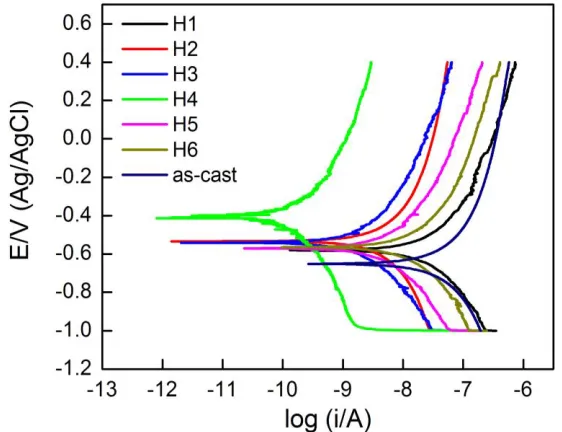
Figure 8. Potentiodynamic polarization curves of HSLA pipeline steels (as-cast, H1, 2, 3, 4, 5 and 6)in 1 M NaCl solution at room temperature
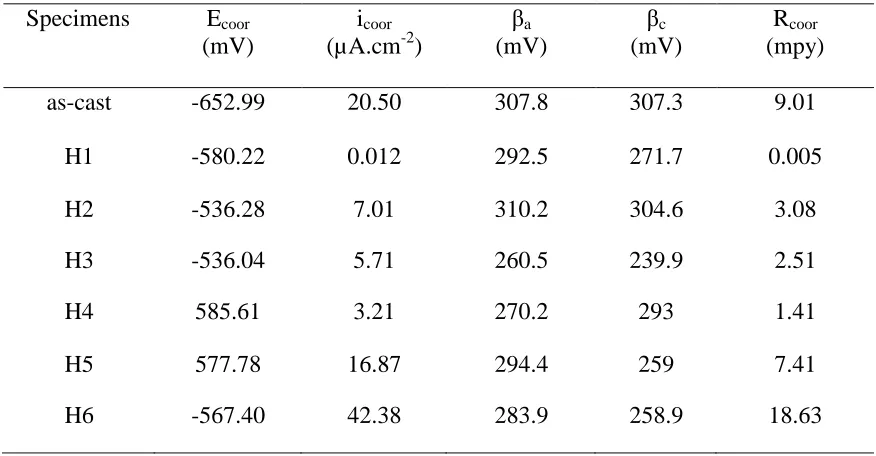
The potentiodynamic polarization curves behavior of HSLA steels after hot compression test at different strain rates is shown in Fig. 8. The anodic current density varies significantly with increase of temperature and strain rate which indicates that in all specimens, the curves exhibited an active zone behavior only and no apparent active-passive transition potential peak observed in NaCl solution test. The values of potentiodynamic polarization parameters, such as anodic Tafel constants (βa), cathodic Tafel constants (βc), corrosion potential (Ecorr), corrosion current densities (icorr), and corrosion rate (Rcoor) obtained by extrapolation of Tafel lines and curves-fitting are given in Table 3. The potentiodynamic polarization curves have a shift towards higher corrosion current density values with increasing temperature. The specimens deformed at low temperature showed lower values of icoor than the as-cast specimen while all specimens deformed at high-temperature exhibit higher values of icoor than the specimens deformed at low temperature. The specimens deformed in compression test at 800 o
[image:8.596.147.428.216.432.2]as-cast -652.99 20.50 307.8 307.3 9.01
H1 -580.22 0.012 292.5 271.7 0.005
H2 -536.28 7.01 310.2 304.6 3.08
H3 -536.04 5.71 260.5 239.9 2.51
H4 585.61 3.21 270.2 293 1.41
H5 577.78 16.87 294.4 259 7.41
H6 -567.40 42.38 283.9 258.9 18.63
3.5 Electrochemical impedance spectroscopy
[image:9.596.79.517.172.400.2]
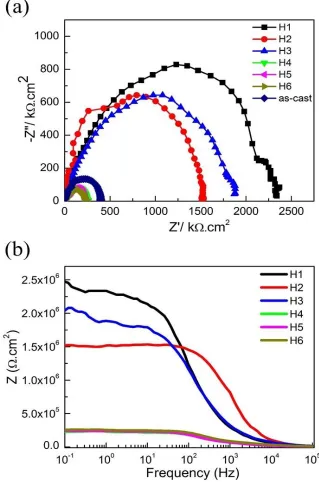
Figure 9. (a) Nyquist and (b) Bode plots of HSLA pipeline steels (as-cast, H1, 2, 3, 4, 5 and 6) for different condition
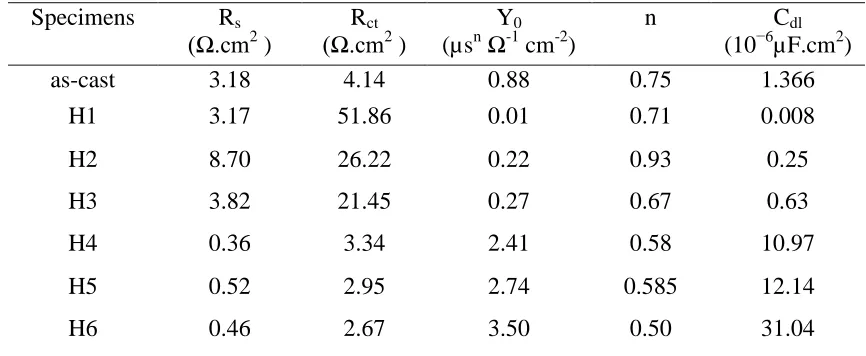
[image:10.596.128.447.80.570.2] [image:10.596.190.397.641.713.2]H4 0.36 3.34 2.41 0.58 10.97
H5 0.52 2.95 2.74 0.585 12.14
H6 0.46 2.67 3.50 0.50 31.04
The EIS spectra were analyzed using the equivalent circuit in Figure 10. The constant phase element (CPE) was represented as following equation:
n o j
Y
Z() .( ) (3)
where Yo is the CPE constant, ω is the angular frequency (rad/s), j2 = -1 and n is the CPE exponent. Double layer capacitance (Cdl) and charge transfer resistance (Rct) were obtained from EIS measurements as described elsewhere. The electrochemical parameters, such as Yo, Rs, Rct and n were obtained from fitting data by using Zview software, and the double layer Cdl was calculated by equation [31-33]:
nct ct o dl R R Y C / 1 (4)
where Rct and o ct
R are the charge transfer resistances with and without inhibitor, respectively. According to Table 4, the increasing of deformation temperature increase has led to the decreasing of Rct value. This is because the corrosion inhibitor molecules absorbed on the surface of the specimens will undergo condensation when the temperature is increasing [34]. The values of Rs and Rct for HSLA pipeline steels deformed at 800 oC with a strain rate of 0.1 s-1 also recorded higher than the as-cast specimen and all specimens deformed at 1100 oC. The increase in Rct value can be attributed to the formation of a protective film on the metal interface and charge transfer. On the other hand, the decrease in value of Cdl is attributed to the increase in the film layer thickness formed by the adsorption of inhibitor molecules which is in agreement with the potentiodynamic polarization data, according to which the corrosion resistance reduced after increase in deformation temperature at 1100 o
C
4. CONCLUSION
[image:11.596.80.513.111.289.2]
potentiodynamic and EIS techniques to characterize the corrosion mechanism. The conclusions are as follows:
(1) Hot deformation behaviors of HSLA pipeline steels are significantly affected by the deformation temperature and strain rate. The flow stress curves show characteristics of dynamic recrystallization and dynamic recovery under various conditions and the flow stress increases with the increase of strain rate under a fixed temperature and decreases with the increase of deformation temperature.
(2) The hot deformation process significantly refined the microstructure and increased microhardness, but hot deformation at a high temperature and increased a strain rate of 10 s-1 led to a reduction of corrosion resistance of the specimens.
(3) The result of potentiodynamic polarization measurements indicated that the corrosion rate of HSLA steel increases with an increase in the deformation temperature and strain rate. It can be seen that the specimens deformed at temperature of 800 oC and strain rate of 0.1 s-1 could improve the corrosion resistance of specimens when compared with as-cast specimen.
ACKNOWLEDGEMENT
Project is supported by the Fundamental Research Funds for the Central Universities of Ministry of Education of China (Grant No. GK2100260214) (Grant No. GK2030260169) and Department of Physics and Materials Sciences, Chiang Mai University.
References
1. S.L. Chawla, Materials Selection for Corrosion Control, (1993), ASM international. 2. J.M. Zhang, W.H. Sun and H. Sun, J. Iron. Steel. Res. Int., 17 (2010) 63.
3. M. Charleux, W. Poole, M. Militzer and A. Deschamps, Metall. Mater. Trans. A., 32 (2001) 1635. 4. A. Fatehi, J. Calvo, A.M. Elwazri and S. Yue, Mater. Sci. Eng., A, 527 (2010) 4233.
5. J.L. Yao, B. Ren, Z.F. Huang, P.G. Cao, R.A. Gu, and Z.Q. Tian, Electrochim. Acta., 48 (2003) 1263.
6. J.F. Marco, M. Gracia, J.R. Gancedo, M.A. Martın-Luengo, and G. Joseph, Corros. Sci., 42 (2000) 7. 753.
8. S. Elbeik, A. C. C. Tseung, and A. L. Mackay, Corros Sci., 26 (1986) 669.
9. E. K. Ioakeimidis, V. N. Kytopoulos, and E. Hristoforou, Mater. Sci. Eng., A, 583 (2013) 254. 10.I. Tatsuo, K. Yoshinori, Y. Akemi and K. Kazuhiko, J. Corros. Sci., 40 (1998) 1239.
11.F. M. Song, D.W. Kirk, J.W. Graydon and D.E. Cormack, Corrosion., 60 (2004) 736. 12.M. A. Deyab and S.S. Abd El-Rehim, Electrochim. Acta., 53 (2007) 1754.
13.Y.S Choi, S. Nesic and S. Ling, Electrochim. Acta., 56 (2011) 1752. 14.M. Alizadeh and S. Bordbar, Corros. Sci., 70 (2013) 170.
15.M. B. Kermani and A. Morshed, Corrosion., 59 (2003) 659.
16.M.B. Kannan, R.K.S. Raman and S. Khoddam, Corros. Sci., 50 (2008) 2879.
17.T. Dieudonne, L. Marchetti, M. Wery, F. Miserque, M. Tabarant, J. Chene, C. Allely, P. Cugy, and C.P. Scott, Corros. Sci., 83 (2014) 234.
18.I.J. Park, S.M. Lee, M. Kang, S. Lee, and Y.K. Lee, J. Alloy. Compd., 619 (2015) 205.
19.R.E. Smallman and R.J. Bishop, Modern physical metallurgy and materials engineering. (1999), Butterworth-Heinemann.
30.W. Lee, Z. Lewandowski, P. H. Nielsen and W. A. Hamilton, Biofouling., 8 (1995) 165. 31.A. K. Singh, G. Ji, R. Prakash, E. E. Ebenso and A. K. Singh, Int. J. Eletrochem. Sci., 8 (2013)
9442.
32.E.E. Ebenso, I.B. Obot, L.C. Murulana, Int. J. Eletrochem. Sci., 5 (2010) 1574. 33.A.Ghanbari, M. M. Attar and M. Mahdavian, Mater. Chem. Phys., 124 (2010) 1205. 34.A. Al-Amiery, A. Kadhum, A. Mohamad and S. A Junaedi, Materials, 6 (2013) 1420.