DNA from Caledia captiva
A thesis submitted for the degree of Doctor of Philosophy of The Australian National University.
Michael L. Arnold
Declaration
The research carried out in the course of this investigation and the results presented in this thesis are, except where
acknowledged, the original work of the author.
Michael L. Arnold
Acknowledgements •
.
.
•.
.
.
Abstract.
. .
.
.
.
• • • • • •.
.
Chapter 1 - Introduction 1 • 1
1. 2
Literature Survey • The Biology of Caledia.
• •
• • • • • • • •
Chapter 2 - Material and Methods 2. 1
2.2 2.3
2.4
Collection and Processing of Animals • • DNA Isolation. • • • • • Shearing of DNA and Isolation of a Highly
Repeated Fraction. • • • • • Nick-Translation of DNA • • • 2.5 Synthesis of 3H c-RNA for in situ
2.6
2.7
Hybridization Probes.
. .
.
.
.
Restriction Endonuclease Experiments. Gel Electrophoresis..
.
• •• •
2.8 Transfer of DNA from Agarose Gels to a
Nylon Membrane • . • • . • . • • 2.9 Hybridization of 32P-Nick-Translated DNA to
•
• •
DNA Fragments Immobilized on Gene Screen . 2. 10 Electroelution of DNA from Agarose Gels. • 2.11 Cloning Caledia Highly Repetitive DNA
Using the Plasmid Vector pBR322.
.
. .
2.12 Cloning Caledia Highly Repetitive DNAUsing the Vector Phage 1059 • • •
Page . i
• ii
• 1 • 17
• 22 • 22
.
24
. 24
. 28 • 29 • 29
• 31
• 32 • 34
.
35
2. 13 Cloning of Caledia Highly Repeated DNA into the Vector M13.
.
.
2. 14 Melting Point (Tm) Determinations and Saturation Hybridization Experiments.
2.15 In situ Hybridization of 3H c-RNA from Caledia Highly Repeated DNA to Prepared
Chromosomes •
2. 16 DNA Sequencing .
.
.
•
2.16.1 Dideoxy Chain Termination Method.
2.16.2 Base-Specific Chemical Cleavage Method . 2. 17
2. 18
Isolation of Total RNA
Electrophoresis of RNA Samples.
2. 19 Transfer of RNA from an Agarose Gel to a Nitrocellulose Filter and Hybridization of Radioactive Probes to the Immobilized RNA.
.
.
•2.20 Computer Assisted Analysis of the Repeated Sequences .
.
.
Chapter 3 - The Heterochromatin of Grasshoppers from the Caledia captiva species Complex I .
Sequence Evolution and Conservation in a Highly
Repeated DNA Family •
•
Chapter 4 - The Heterochromatin of Grasshoppers from
• 42
• 45
. 46
. 48
. 48
• 50 • 51 • 51
. 52
• 53
• 54
5.1 Introduction .
.
. .
5.2 Results and Discussion.
. .
. .
Chapter 6 - Eco Repeated Sequences
6.1 Introduction . • •
6.2 Results and Discussion.
.
.
.
.
.
.
.
Chapter 7 - Final Remarks
7.1 Introduction.
.
.
•.
.
.
7.2 Evolution of Highly Repeated DNA Families
7.3
Functional Aspects of Highly RepeatedSequences
Bibliography •
•
• 10 3 • 103
• 110
• 110
• 112
. 112
i
Acknowledgements
I thank David Shaw and Rudi Appels for their guidance, many times in spite of my stubborness. I also wish to thank them, along with Bernard John, for reading and vastly improving this thesis.
I profitted greatly from interactions with the following people: R. Appels, A. Brown, I. Boussy, L. Christidis, D. Coates, D. Colgan, N. Contreras, S. Easteal, M. Fischer, R. Honeycutt, B. John, D. Llewellyn, L. McIntyre, G. Miklos, L. Moran, C. Moritz, D. Rowell, D. Shaw and P. Wilkinson.
I received excellent technical advice from R. Appels, B. Clarke, K. Ferguson, L. Moran, D. Shaw and P. Wilkinson.
K. Christian produced the computer program for comparing the repeated sequences.
The Commonwealth Scientific and Industrial Research Organization provided extensive support in the form of materials and equipment during the entirety of my tenure.
I would also like to acknowledge the encouragement I have
received from my two sets of parents, Mr. and Mrs. R.C. Arnold and Mr. and Mrs. G.E. Swinson.
Abstract
Five highly repeated DNA families were isolated from the grasshopper Caledia captiva. These families were analyzed with DNA reassociation, restriction endonucleases, DNA sequencing and in situ hybridization. Results from the first three analyses demonstrated that there was a large range of nucleotide sequence variation among repeats from these DNA families, from a low of 0% to a high of 16%. However, at least within the Taq family of
repeats, there was a conserved region which showed no variati.on at the individual, populational, racial or subspecific levels. Furthermore, this conserved region formed a part of a region of dyad or two-fold symmetry, which is suggestive of protein-DNA interaction. The Taq sequence family was distributed in
different chromosomal regions in the various taxa and,
quantitatively, shows a negative correlation with the grade of reproductive isolation present in the species group. In
contrast, the Barn family sequences are considerably more variable in nucleotide sequence than the Taq family sequences. Thus the tandem array of Barn sequences showed more interrepeat variability than the intersubspecific comparisons of the Taq repeats. This increased variation may be due to the age of the Barn family. Except for the comparisons of repeats from a tandem array, the Barn family sequences demonstrate equivalent amounts of variation at all taxonomic levels. The Barn family repeats apparently have
iii
highly repeated Eco RI fragments from a single bacteriophage
clone were also analyzed. In ~itu hybridizations indicated that
these sequences were dispersed throughout the genomes of the C.
~~~~iv~ taxa, as well as C. ~pe~~es nova
l·
Preliminary sequencing data suggested that these three sequences wererelated, but belong to different highly repeated DNA families. In addition, at least one of these repeats has a sequence
structure which is necessary for forming the Z-DNA conformation.
The results from this study of the ~~~~dia repeated DNA sequences are discussed in terms of the evolution and potential functional
CHAPTER 1: INTRODUCTION 1.1 Literature Survey
An analysis of the organization of DNA within the genomes of eukaryotes was greatly facilitated by the discovery that, given the proper biochemical conditions, dissociated complementary strands of bacterial DNA would specifically reassociate (Marmur et al. , 1963) . Although this reassociation was defined by
second-order kinetics, it was soon apparent that various portions of the eukaryote genome possessed differing "rates of
reassociation" and differing levels of stability for the Ko~"-e
reassociated DNA (Britten and ., 1968). These differences were subsequently attributed to dissimilarities in the repetition frequencies of various DNA sequences and the repetition
frequencies were found to vary greatly within a genome. For example, the mouse genome was defined as consisting of
approximately
70%
unique or non-repetitive sequences,20%
sequences which are represented by 103-105 copies and 10%sequences with 106 or more copies (Britten and , 1968). In the mouse genome, the latter fraction was defined as a highly repeated sequence "family" in the sense that sufficient homology was present between individual repeats which allowed
reassociation. In contrast to the pattern of genome organization in the mouse, Flavell et al. (1974) found that the repeated
-2-intermediate and rapidly reannealing fraction which constituted
approximately 12%, 83% and 4-10% of the genome, respectively.
The initial analyses of highly repeated DNA families were
reported almost a decade after the secondary structure of the DNA
molecule had been defined by Watson and Crick (1953). A number
of studies which utilized the technique of equilibrium
ultracentrifugation of DNA in CsCl gradients, resolved multiple bands within a genome (Kit, 1961; 1962 a,b; Sueoka, 1961; Sueoka and Cheng, 1962; Szybalski, 1962). Sueoka (1961) detected a
bimodal distribution in the guanine+ cytosine content when selected samples of crab, calf and mouse DNA were subjected to
this process. Likewise, Kit (1961; 1962 a,b) noted that the
density gradients of mouse and guinea pig DNA differed from
experiments involving both rat and human DNA in that the latter
two demonstrated a single band following centrifugation.
Although the presence of minor or "satellite" (Kit, 1961) bands
in only two of three crab species examined led Sueoka (1961) to
suggest that these bands might somehow be artifactual, both he and Kit (1962b) recognized that they could represent DNA which had a relatively higher ratio of adenine+ thymine (A+T) to
guanine+ cytosine (G+C). This conclusion was drawn from the observation that an increase in the mean molar G+C content caused a linear increase in the mean buoyant density of DNA (Rolfe and Meselson, 1959). Therefore, these relatively less dense minor
utilizing chromatography following enzymatic breakdown of the DNA into 5 - monophosphates.
Further studies of mouse satellite DNA specified that this component had a high degree of homogeneity both in terms of the molecular weights as well as the G+C content of the individual DNA molecules (Flamm et al. , 1966) . This homogeneity was
indicated by both the sharpness of the mouse minor band formed in CsCl gradients and the three to four-fold narrower DNA melting curve for the satellite fraction relative to unfractionated mouse DNA. Moreover, it was noted that this DNA fraction had the
ability to renature rapidly relative to other portions of the mouse nuclear and mitochondrial genomes and bacterial genomes
(Bolton et al. , 1965; Walker and McLaren, 1965; Flamm et al.,
1966; Waring and Britten, 1966; Flamm et al., 1967). In light of the rate constant of reassociation calculated for this DNA, it was estimated that this fraction consisted of approximately 1.0 x
106 tandemly repeated copies of a 300 - 400 base pair long sequence (Bolton et al., 1965; Waring and Britten, 1966).
In addition to the molecular characteristics of the
satellite DNA, which suggested a structure composed of relatively simple, homogeneous components, the chromosomal location of
rapidly reannealing DNA was defined cytologically in human, mouse and Droso~hila genomes (Pardue and Gall , 1969; 1970; Jones, 1970; Rae, 1970; Jones and Cornea, 197 Gall et al., 97 ; Peacock et
-4-rapidly reannealing DNA components from Drosophil~ ~~~~nogaster, isolated both by hydroxyapatite chromatography and buoyant
density gradients, showed a variety of hybridization sites
including the chromocenter, the nucleolar organizer and a region near the tip of chromosome
3.
Peacock et al. (1974) extended the analysis of the D. melanogaster highly repeated families by the isolation of previously undetected satellite sequences. This was accomplished by the utilization of antibiotic - CsCl gradients. The rationale for the use of such gradients was that certain antibiotics had been demonstrated to bind differentially to various DNA sequences, thus causing a change in their buoyant densities and thereby facilitating their separation in a CsCl gradient (Brown et al., 1971). Such satellites were later termed "cryptic" (see Singer, 1982 for review) because they were not detected in standard buoyant density gradients. In D.m~lanogaster, actinomycin-D-CsCl gradients resolved four major satellite peaks (Peacock et al., 1974) . These satellites, as with those previously identified (Rae, 1970; Gall et al., 1971), demonstrated limited cytological distributions. The sites of hybridization of c-RNA's synthesized from the four satellites included the chromocenter, a single band in the ?.1 C-D region of chromosome?. and the centromeric regions of each of the large autosomes, the X and chromosome 4 (Peacock et al., 1974) . The localities of hybridization of the highly repeated fractions from each of these organisms, corresponded mostly to regions
On the basis of reassociation kinetics, repetitive
sequences were shown to be ubiqui tous in all but bacterial, viral
and blue-green algae genomes (Britten and kch~e , 1967; 1968).
However, repetitive DNA and in particul ar satellite sequences isolated from different organisms were found to be di stinct from
one another both on the basis of buoyant density and
reassociation data (Hennig and Walker, 1970; Skinner and Kerr,
1971; Walker, 1971; Beattie and Skinner, 1972). Hennig and
Walker (1970) found that, within and between the two rodent
families Cricetidae and Muridae, variation existed in the banding
position of minor satellites as well as in the relative amounts
of these satellites. Even within a single genus (Apo~~mus)
"remarkable variation" was detected between the satellites from
four species (Hennig and Walker, 1970). Likewise, Skinner and
Kerr (1971) discovered variation in the buoyant density values
and relative amounts of light and heavy satellites from four
species of crab and a single lobster species. In addition to the
differences detected by buoyant density analyses, heterologous
DNA-DNA hybridizations involving repeated sequences from a number
of mammalian species revealed, on average, only 20% homology
(Hoyer et al., 1964).
The unique properities of these sequences (ie. highly
repeated, tandemly arranged and distinctive base composition
between closely related species) led to proposals of novel
evolutionary mechanisms to account for their formation and K.oft...t'\.e
organization. Britten and (1967) and Southern (1970)
suggested that such sequences had originated relatively recently
-6-also proposed that the repetitiveness of these families of
sequences was the result of numerous copies of a sequence being made over a short time period by a process they referred to as saltatory replication. In addition, Southern (1970) suggested that evolution of the guinea pig a-satellite could be explained by multiplication events followed by periods of no amplification, but with the occurrence of base pair mutations. This model was used to explain the differential repetition of sequence variants
detected in the guinea-pig satellite via pyrimidine tract
analysis (Southern, 1970). If a sequence variant arose early in the evolutionary history of the family and was subsequently
amplified by unequal crossing-over it would have a relatively higher frequency than a variant which arose late in this process and, therefore, had not undergone the same level of amplification
(Southern, 1970; Walker, 1971).
The view that highly repeated or satellite DNA was
relatively simple in sequence, as suggested by earlier studies (Flamm et al., 1967), had to be modified when data from
pyrimidine tract analysis (Southern, 1970; Peacock et al., 1974; Biro et al., 1975), quantitative estimates (Sueoka, 1961;
Mazrimas and Hatch, 1972), restriction endonuclease mapping
(Botchan, 1974; Southern, 1975a) and DNA sequencing (Fry et al, 1973; Brutlag and Peacock, 1975; Endow et al., 1975; Shmookler Reis and Biro, 1978) were considered. All of these suggested the presence of a highly complex and integrated organization for
' these sequence families. For example, whilst the~- melanogaster
sequence variation (Peacock et al., 1974; Brutlag et al., 1977), each of the four major satellites had related sequences (Brutlag and Peacock, 1975). Strachan et al. (1982) using, in particular,
the techniques of restriction endonuclease mapping and filter
hybridization also detected interspecific homologies for
Dr:~~ophila satellites as well as sequence homologies between some
of these satellites. In addition, these authors detected
variation in the repeat lengths of the "500 bp" satellite
sequences using the restriction enzyme analysis. More recent
analyses of satellite sequences from other animal taxa, involving
nucleotide sequencing of cloned repeats (bovine: Plucienniczak et
al., 1982; Tapasowsky and Gerbi, 1982; nematode: Muller et al.,
1982; mouse: Pietras et al., 1983; african clawed-toad: Meyerhoff
et al., 1983; sheep: Novak, 1984; and rat: Epstein et al., 1984)
have also demonstrated the presence of i) sequence heterogeneity
within highly repeated DNA families and ii) homology among
satellites from a given species.
The utility of nucleotide sequence data, in terms of defining
the organization of a highly repeated DNA family, is discussed
here using the studies of the primate "a-satellite" sequence (Maio, 1971 ) as an example. The "fundamental" unit of the a
-satellite DNA was determined to be a 170 bp repeat as measured by
restriction endonuclease cleavage. However, various primate
species have repeat sequences which are defined as multiples (ie.
170n; n=1,2 or 4) of the fundamental unit (Donehower and
Gillespie, 1979). Thus, baboons (Pae2:_~_), macaques (Macaca)
and mangbeys (Cercocebus) are distinguished by a basic repeat
-8-other hand, have a 170 bp repeat, whilst the colobus monkey
(Colobus) has a repeat unit of 680 bp. The initial sequence
analysis of the primate a-satellite was carried out on the
African Green monkey (AGM) repeat family (Rosenberg et al.,
1978). This analysis demonstrated that the AGM repeats were not
identical, but rather constituted a family of closely related 172
bp sequences. Rosenberg et al. (1978) showed that the repeat
units were not internally repetitive and that divergence at the
172 bp positions was not random, but occurred more frequently at
some positions than at others. In a further analysis of the AGM
a-satellite, Thayer et al. (1981) found that neighboring repeats
were no more similar to one another than randomly isolated 172 bp
units. Sequence analysis of human a-satellite identified a 171
bp monomer unit which was 65% homologous to the 172 bp AGM repeat
(Manuelidis and Wu, 1978). Both the human and the AGM sequences
were shown to have numerous stop codons as well as several
regions of dyad symmetry (Manuelidis and Wu, 1978). An analysis
of a-satellite repeats from the baboon defined a
343
bp sequence(Donehower et al., 1980). This repeat unit was shown to consist
of two "wings" of 172 bp and 171 bp which shared 69% homology.
In contrast, the 172 bp wing was 92% homologous to the AGM repeat
unit. A comparison of the baboon, AGM and human a-satellites led
to the suggestion that each of their respective repeats had a
common ancestor (Donehower et al., 1980) . An examination of
a-satellite DNA from the bonnet monkey (Mac~ca radiata) genome
revealed a similar pattern of organization to that found in the
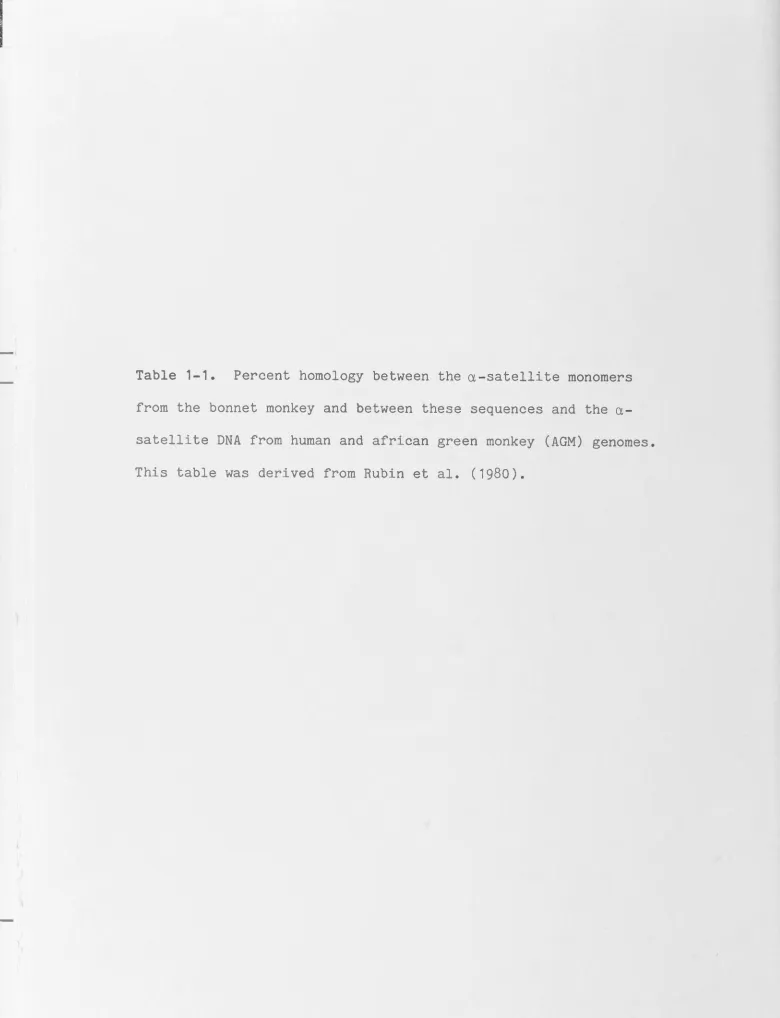
monkey was shown to be a 344 bp sequence which consisted of two related 172 bp sequences (Monomer I and II). Results from the comparison of these two sequences to each other as well as to the human and AGM a-satellite DNA are shown in Table 1-1 (derived from Rubin et al., 1980). Both of the 172 bp sequences
demonstrated greater homology with the AGM sequence than they did with each other. These two monomer units shared less homology with the human repeat (Table 1-1). Recent analyses of the a-satellite sequences have involved the detailed examination of junctions between these sequences and non-a-satellite DNA
(Mccutchan et al., 1982; Maresca and Singer, 1983; Maresca et al., 1984). The AGM satellites at such junctions were found to be not only divergent forms of the major a-satellite sequence
(Mccutchan et al., 1982), but in some instances novel satellites were identified (Maresca and Singer, 1983; Maresca et al., 1984).
The D. ~ela~~&~ster satellites were shown to be
distributed in numerous chromosomal locations such that each chromosome had"··· a quantitatively and qualitatively unique segmented makeup of its heterochromatin" (Peacock et al., 1978). This segmental pattern of organization had previously been
documented in the red-necked wallaby (Dunsmuir, 1976) and was also demonstrable for satellites from various plant (cereal) genomes (Peacock et al., 1978; Appels and Peacock, 1978).
As noted above, the complex pattern of organization between highly repeated DNA families included sequence relatedness among satellites from a given species. Furthermore, comparative
Table 1-1. Percent homology between the a-satellite monomers
from the bonnet monkey and between these sequences and the
[image:18.813.20.800.25.1043.2]Monomer I
67%
90% 100%
-10-Mccallum, 1972; Gall et al., 1974; Peacock et al., 1978).
However, these sequence homologies were in contrast to the marked quantitative differences for a given satellite present in related species (Peacock et al., 1978). The obvious question generated from these findings was: How could a repeated sequence family which possesses up to 106 copies remain re~~t~vely homogeneous in
terms of its basic sequence and yet fluctuate dramatically in quantity between related species? As mentioned previously a number of mechanisms had been envisaged to explain the
amplification and evolution of these sequences (Britten and k()k""e
, 1967; Southern, 1970). Smith (1976) demonstrated
mathematically that the process of unequal crossing over will, by chance, lead to the "homogenization" of an originally
heterogeneous array of tandem repeats. This homogenization results in the predominance of one sequence variant. In
addition, the simulations utilized to define the mechanism of unequal crossing over also suggested that in the absence of
selective forces, the "natural state" of a DNA sequence was that of a tandem array (Smith, 1976). Subsequent to the analysis by Smith (1976), studies of yeast ribosomal RNA loci have indicated
that unequal crossing over can occur between sister chromatids during both mitosis (Szostak and Wu, 1980) and meiosis (Petes,
1980) •
In addition to the amplification and "homogenization" of a sequence array, it is also apparent that highly repeated DNA families have in some cases spread from a single to many
circle" model of DNA amplification was the most plausible
explanation for the pattern of organization observed in the
bovine satellite I DNA. An inherent component of this process is
the formation of rings of satellite DNA which are excised
products of reciprocal intrastrand recombination. It is proposed
that these rings then undergo a rolling circle mechanism of
amplification analogous to that exhibited by rDNA in !enopus
oocytes (Hourcade et al., 1973). This results in an array of
identical tandem repeats which have been postulated to
reintegrate into the germ line genome (Botchan, 1974). If this
reintegration occurs in a nonhomologous chromosomal region the
sequence would then be established in a novel position. More
recently, the discovery of moderately repetitive elements which
have the ability to transpose either themselves or, in the case
of the prokaryotic IS elements, entire chromosome segments from
one site to another (see Iida et al., 1983 for review) has
suggested a further mechanism capable of dispersing highly
repeated DNA sequences throughout the genome. Although it is
speculative, a transposition event involving a highly repeated
DNA from a tandem array could involve a process whereby the
repeated sequence was positioned between two such transposable
elements and subsequently shifted along with the transposons to a
novel chromosomal location.
In the above discussion the question was raised concerning
how a sequence family, which ~ight possess as many as 106 copies,
could remain relatively homogeneous. The data which suggest
homogeneity within a sequence family will be discussed in detail
-1?.-well be facilitated by the mechanism of amplification (eg.
rolling circle model). Maintenance of homogeneity could also be
accounted for by unequal crossing over in instances where the
sequence family is localized on a single pair of homologous
chromosomes (Smith, 1976). However, if a sequence family is
present on nonhomologous chromosomes, as for example in the mouse satellite (Pardue and Gall, 1970), factors other than recency of
origin may account for the sequence similarity among the repeats. One such mechanism is gene conversion. In its classical sense,
gene conversion occurs when one allele at a locus converts a second allele at an homologous locus into its own allelic state
(Roman, 1963). Such ~~tr~~enic conversion results in an atypical
ratio of the segregants produced by meiosis (Case and Giles,
1964; Hurst et al., 1972). A similar process has seemingly been
responsible for ~n~~~~enic conversion events in the chorion and globin multigene families (Iatrou et al., 1984; Slightam et al.,
1980) and in a duplicated leucine gene (Klein and Petes, 1981). For a new sequence variant to spread throughout a family of
repeats, as the result of conversion events, the conversion must be "biased" (ie., it must favor the new variant). This type of
biased conversion has been observed for intragenic recombination
involving spore color loci in As~obolus imm~rsus (Leblon, 197?.)
and So~dari~ br~vicollis (Yu-Sun et al., 1977).
Mechanisms which may account for the generation,
amplification, spread and maintenance of highly repeated DNA families have been described in the above discussion. However,
repeated DNA plays any functional role or roles within the
genome.
The failure to detect overt cases of specific highly
repeated DNAs with specific functions, has led various authors to
suggest that these DNA families may be selfish (Doolittle and
Sapienza, 1980) or parasitic (Orgel and Crick, 1980) in terms of
their replication, neutral in terms of phenotypic expression
(Doolittle and Sapienza, 1980; Orgel and Crick, 1980; Miklos and
Gill, 1981), or the products of a process which selects and
amplifies non-adaptive variants and spreads them between
different chromosomes (Dover, 1982; Ohta and Dover, 1984). Each
of these hypotheses regards highly repeated sequences as
functionless although it has been suggested that the gradual
accumulation of non-adaptive variants via the process of
"molecular drive" (Dover, 1982) might result in reproductive
isolation (Ohta and Dover, 1984). In contrast, the distinctive
characteristics of satellite DNA, themselves, have led many
investigators to conclude that this highly repeated fraction had
a specific functional aspect. Thus Walker (1971), after noting
t hat satellite DNAs appeared to be unique between closely related
species and that they could vary extensively in quantity,
nevertheless, concluded that"··· the presence of satellite DNA
confers some selective advantage; otherwise we cannot account for
its spread throughout a population as large as that of the house
mouse." Walker (1971) suggested specifically that the selective
advantage might occur at the level of the chromosome, in that a
homologue which possessed satellite sequences might have a higher
-14-its homologue which lacks such a sequence. Similarly, Mayfield
and Ellison (1975) suggested that satellite DNAs might provide
sites of recognition for homologous chromosome pairing at
meiosis. Highly repeated DNAs have also been cited as possible
candidates for acting as sterility barriers between species
(Cornea, 1976; Fry and Salser, 1977) and in facilitating high
genetic flexibility (Mazrimas and Hatch, 1972). Both Cornea
(1976) and Fry and Salser (1977) hypothesized that the putative
sterility barrier caused by differences in satellite DNA
composition could be due to disruption of meiotic pairing sites associated with the highly repeated DNA. It should be noted,
however, that with respect to each of the above hypotheses, John
and Miklos (1979) concluded that none could be supported by experimental data.
A further factor which has intimated that highly repeated
DNA may have functional attributes was the discovery of sequence
homologies between both closely and more distantly related taxa.
In spite of the numerous examples of such sequence conservation
(Gall et al., 1974; Fry and Salser, 1977; Peacock et al., 1977; Peacock et al., 1978; Manuelidis and Wu, 1978; Witney and Furano,
1983; Pietras et al., 1983; Epstein et al., 1984; Dennis and
Peacock, 1984; Novak, 1984), Miklos (1985) has pointed out that
without estimates of species variation"··· hypotheses relating to conservation (of highly repeated sequences) are severely constrained."
grasshopper Atracta~orpha similis possessed a large amount of
satellite-1 sequences which had an effect on the pattern of male
meiotic recombination. Specifically, in chromosomally
polymorphic populations of Atractamorpha, the presence of large
telomeric blocks of satellite DNA resulted in a redistribution of
chiasmata away from the blocks (Miklos and Nankivell, 1976).
This type of effect has also been documented in a variety of
other grasshopper species both for telomeric and centromeric
heterochromatin (John and King, 1985). It is important to note,
however, that this effect does not appear to be present in the
chromosomal race of the grasshopper Cal~di~ ~aptiva which
possesses large centromeric blocks of highly repeated DNA (Shaw
and Knowles, 1976; Appels and Peacock, 1978). A second attribute
which has been demonstrated for several highly repeated
sequences, and which may have functional significance, is the
provision of specific sites for DNA-protein binding (Hsieh and
Brutlag, 1979a; Levinger and Varshavsky, 1982 a, b; Avila et al.,
1983; Strauss and Varshavsky, 1984; Andrews et al., 1984). Data
from these studies suggest that specific functions for the
various protein - DNA interactions may include nucleosome phasing
(Strauss and Varshavsky, 1984), involvement in microtubule
-chromosome association (Avila et al., 1983) and the influencing
of gene activity (e.g., Andrews et al., 1984).
The above discussion clearly indicates the immense
complexity of highly repeated DNA in terms of its origin,
maintenance, evolution and potential for functional interactions.
Some of these aspects have been examined with the techniques of
-16-examined a group of related taxa with the view of understanding
how highly repeated sequences originate, evolve and interact in
their respective genomes. The research work described in this
thesis is directed toward resolving the following questions:
1) What is the level and distribution of sequence variation
in specific highly repeated DNA families within an
individual animal and a population of animals compared to
that present between different populations of the same
species which show increasing degrees of reproductive
isolation?
?.) How are the various sequence families organized at the
chromosomal level?
3) What, if any, is the relationship between the families in
terms of their sequence composition?
4) Do the patterns of evolution in these highly repeated
DNAs agree with models which predict how such DNA should
evolve?
5) Are the data from this study of specific highly repeated
DNA families suggestive of any function?
In order to approach the above questions, there are specific
attributes which must be present in the organism chosen for
analysis. First, the selected species must contain taxa which
demonstrate a grade of reproductive isolation from local
populational status though to taxonomic species. Second, the
chromosomes which belong to the various taxa must be individually
and unambiguously distinctive, possessing regions of
complements from the various taxa must demonstrate intra- and intertaxonomic variation in their patterns of heterochromatin distribution. As will be documented in Section 1.2, grasshoppers of the genus Caledia captiva provide all of these biological
attributes.
1.2 The Biology of Caledia
The organism chosen for this study was the grasshopper genus
Caledia (Orthoptera: Acrididae: Acridinae). Individuals from both of the conventionally recognized taxonomic species, Caledia capt~~ and Caledia species nova
l,
were analyzed. This genus is currently known from localities ranging from 8° - 38° latitude, and so includes within its distributional range, populations in Papua New Guinea, the Torres Strait region, northern coastal Australia and the entire eastern seaboard of Australia.Specimens off· species nova
l,
which is restricted to Papua New Guinea, have been collected from monsoon rain forest on theOriomo Plateau (Fig. 1-1). In contrast, C. captiva is found throughout the entire distributional range of the genus and so occurs in a variety of habitats including tropical rain forest, tall mixed savannah, open forest and grassy open forest (Fig. 1-1). C. captiva and C. species nova 1 are easily distinguishable on
the basis of both size and coloration (Shaw, 1976).
Figure 1-1. Geographic distribution of the Ca~edia taxa.
Note: The Torresian taxon also occurs sympatrically with C.
[image:28.819.7.807.27.1067.2]AIRIIIIAA
111111ona
....
,.
...
'TORRESIAN' RACE
no
Rft '"
an
ill t\l\ii AA
""""
...
---
---Sympatry of the DAINTREE and TORRESIAN races at Northern Limits of DAINTREE distribution .
'DAINTREE' RACE
nnn•"•I\•
A A
ft II AA ft A,.,.
...
--'MORETON' RACE
iiinXni•
Parapatric association ofI
~ ---,.lit •,. ft .. !! t! ..I
A-the TORRESIAN andI
I I • A
MORETON races
V
VFormation of a Hybrid . . • ;:
It
•
•
_. •
Zone 200km long and r -less than 200m wide.' of karyotypes-of the
( Recorded from S.W. Australia)
DISTRIBUTION PATTERN OF THE FOUR DISTINCT CHROMOSOMAL RACES OF Caledia caetiva (Orthoptera: Acridinae)
V
J;I • 1 MORETON and SOUTH-EAST AUSTRALIAN races.
'SOUTH-EAST
AUSTRALIAN' RACE
iitliii•I
- • •i ••••
-18-of centromere position (Shaw, 1976), and all chromosomes are
telocentric (Fig. 1-2). C. captiva, on the other hand, shows
extreme levels of chromosomal variation which allows the
recognition of four chromosomal taxa (Shaw, 1976; Shaw et al.,
1976; Shaw et al., 1980). The Daintree (DT) taxon has a
telocentric complement (Table 1-2; Fig. 1-2), the Torresian (TT)
taxon possesses an acrocentric karyotype, (Table 1-2; Fig. 1-2),
the Moreton (MM) taxon exhibits a metacentric complement (Table
1-2; Fig. 1-2) and the South-east Australian (S.E.A.) chromosomal form is characterized by a mixture of metacentric, acrocentric and telocentric chromosomes (Table 1-2; Fig. 1-2). The complexity of the chromosomal system off· captiva is further evidenced when techniques are utilized to identify C-band heterochromatin (Shaw
et al., 1976; Shaw et al., 1980; Coates and Shaw, 1984; Shaw et
al., in prep.). C-band variation is extensive both within and between populations. Hence, Daintree populations are
characterized by large procentric blocks of heterochromatin (Table 1-2; Fig. 1-2), Torresian populations by centromeric or short arm heterochromatin (Table 1-2; Fig. 1-2) and Moreton and S.E.A. populations by numerous interstitial C-band positive regions (Table 1-2; Fig. 1-2). In addition, C. ~ecies nova 1 individuals possess mainly small procentric regions of C-band heterochromatin (Fig. 1-2).
Additionally, there is a cline in centromere position between the Moreton and S.E.A. populations (Shaw et al., 1980;
SPECIES
C. captiva
C. captiva
C. species nova 1
RACE
Daintree
Torresian
Moreton
South-east Australian
CENTROMERE
-
~-LOCATION
Telocentric
Acrocentric
Metacentric
Polymorphic
Telocentric
HETEROCHROMATIN DISTRIBUTION
Large Procentric Blocks
Centromeric and Short Arms
Interstitial (Polymorphic)
Interstitial (Polymorphic)
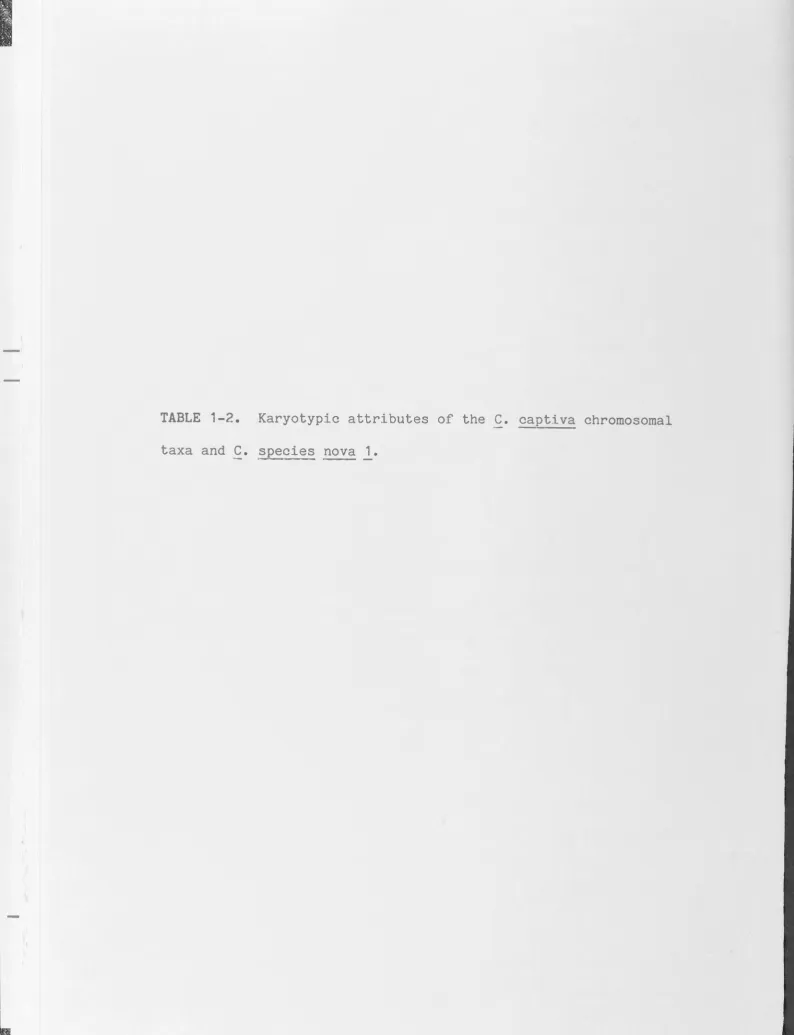
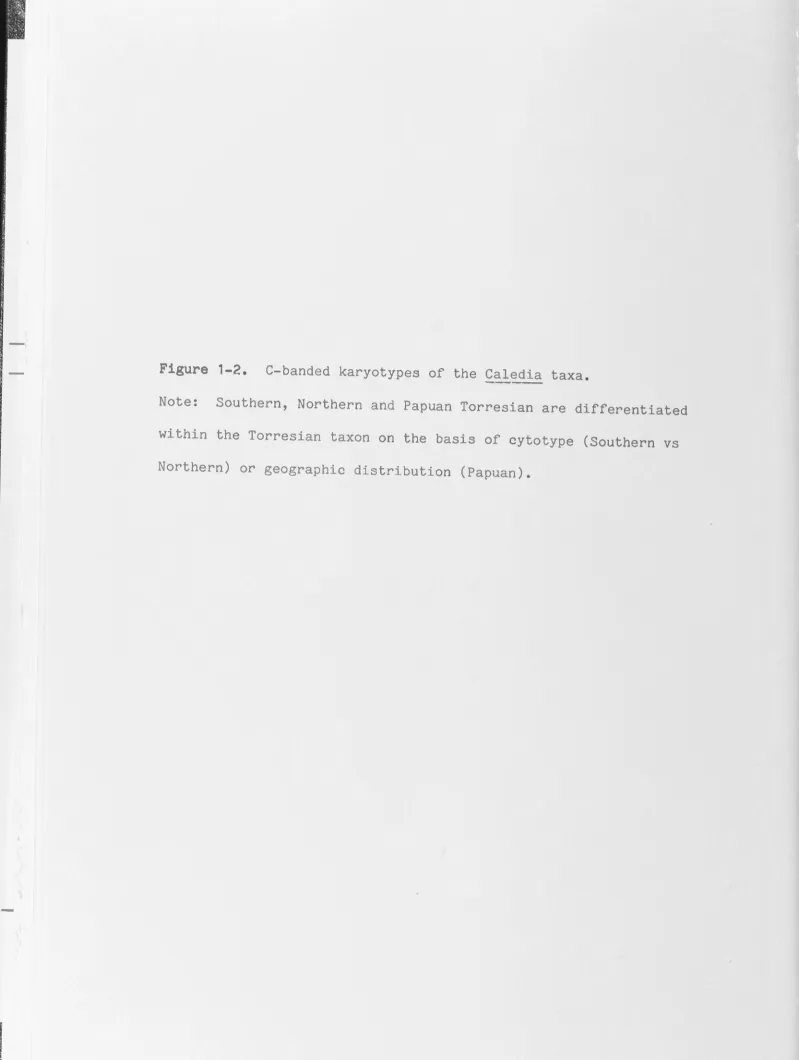
Note: Southern, Northern and Papuan Torresian are differentiated
within the Torresian taxon on the basis of cytotype (Southern vs
[image:33.821.11.810.28.1088.2]C.
captiva
(
MORETON)
C.
captiva
(LAKES
ENTRANCE)
(. captiva
(SOUTHERN
TORRESIAN)
C.
captiva
(PAPUAN}
C.
captiva
(NORTHERN
TORRESIAN}
C.
captiva
(DAINTREE}
C. species
·
nova
1
1 2 X 4 5 6
7
8 9 10 11 12S.E.A. populations (Shaw and Coates, 1983). It is of interest
that both of these populations from the ends of the cline still
maintain the interstitial C-band heterochromatin, as do the
intermediate populations (Shaw et al., in prep.).
Laboratory crosses, along with field observations, indicate
that differing levels of reproductive isolation are present among
the various Caledia taxa (Shaw et al., 1980; Coates and Shaw,
1984; Fig. 1-3). The Daintree form is reproductively isolated from
each of the other three taxa by premating mechanisms in the case
of the Torresian chromosomal type and both pre- and postmating in
respect of both the Moreton and S.E.A. taxa. Although the
Daintree and Torresian taxa occur sympatrically in at least some
populations (Shaw et al., 1980), they do not appear to form
natural hybrids (Shaw, pers. comm.). Cytogenetic analysis of
meiosis in F1 hybrids from (MM X DT) and (S.E.A. X DT) crosses
have detected the presence of numerous aberrant configurations
involving "nonhomologous" associations between chromosomes from
the same genome (Shaw and Wilkinson, 1978). The Torresian form,
when crossed to either the S.E.A. or Moreton race, produces
fertile F1's. However, in the (MM X TT) crosses there is
complete F2 breakdown while the (S.E.A. X TT) matings produce
from 25 - 54% viable F2's (Daly et al., 1981; Coates and Shaw,
1984) . In the (MM X S.E.A.) crosses the resulting F1 hybrids are
fully viable (Shaw et al., 1980; Shaw et al., in prep.).
However, in the F?. generation there is a range of viabilities
(58- 100%) depending upon which S.E.A. population is utilized
Figure 1-3. Schematic representation of the reproductive
isolation present between the C. captiva taxa.
[image:36.821.8.809.25.1051.2]'S.E.
Allopatric Fertile F1, F2
AUSTRALIAN'
race
11
Partial
'f
T
Pre mating SympatryI
~Isolation'DAINTREE'
race
Parapatric Fertile F1, F2
F1 Fertile (Tetraploid meiocytes)
Gradual lntergradation
'MORETON'
-20-In relation to the above findings, Daly et al. (1981) in a
study of the pattern of allozyme divergence among the~- captiva
taxa, established that genetic distances (Nei and Roychoudhury,
1974) increased directly with the level of reproductive
isolation. However, these authors concluded that the divergence
in the genie component within animals from the various taxa had
not given rise to the reproductive isolation seen in the present
population (Daly et al., 1981). Data which support this
hypothesis are available from crosses involving the Lakes
Entrance S.E.A. population and the Moreton population. These two
populations are equivalent in terms of their genie component
(Daly et al., 1981) yet when crossed the F2 generation shows a
42% reduction in viability. This is directly attributable to
chromosomal differences between the two populations (Shaw and
Coates, 1983).
A more precise definition of some of the elements
responsible for the reproductive isolation of t he Moreton and
Torresian taxa, has been facilitated by the discovery and
subsequent analysis of a zone of hybridization between them
(Moran and Shaw, 1977; Moran, 1979; Shaw et al., 1979; Shaw and
Wilkinson, 1980; Moran et al., i980; Shaw et al., 1985). This
zone is situated in South-east Queensland and extends
latitudinally for at least 150 km (Moran and Shaw, 1977). In
spite of the extensive parapatric association in this region, the
changeover in the frequency of eight of the twelve members of the
Torresian and Moreton genomes occurs over a distance of only 200
meters (Moran, 1979). It was originally demonstrated that
Moreton subspecies, but without reciprocal introgression (Moran and Shaw, 1977). Earlier work on the chromosomal parameters of the
f
·
captiva complex, as well as the hybrid zone data, ledMoran and Shaw (1977) to conclude that this contact zone was"··· probably a result of an interaction between both ecological
tolerance and competitive exclusion". The maintenance of the abrupt changeover in the frequencies of Torresian and Moreton chromosomes was attributed to total embryonic breakdown in the F2 generation and approximately 50% backcross inviability (Shaw et al., 1980) . This was initially hypothesized, and subsequently demonstrated, to be due to the redistribution of chiasmata into chromosome regions which do not normally undergo recombination
(Shaw and Wilkinson, 1980; Coates and Shaw, 1982; 1984; Shaw et al., 1982) . It has been suggested that this pattern of novel recombination perturbs the internally coadapted gene complexes present within the chromosomes of a given complement thereby leading to dysfunctional combinations (Shaw and Coates, 1983). More recently it has been demonstrated that the structure of the hybrid zone is also due in part to the action of selection which favors the metacentric Moreton karyotype during mesic years and the acrocentric Torresian karyotype in arid years (Shaw et al., 1985) . These data have led to the proposal that the overall structure of the karyotype may have a functional significance over and above its genie content (Shaw et al., 1985; Shaw et al., in prep.).
-?2-CHAPTER 2: MATERIAL AND METHODS
2.1 Collection and Processing of Animals
The majority of the animals used in this research project were collected from wild populations. The remainder of the
samples were obtained from offspring of the wild caught animals. Within the laboratory, grasshoppers were maintained in 45cm X 37cm X 37cm cages with a 75 watt photoflow incandescent light source. These cages were kept at 26-28°C and 50-60% relative humidity during the daytime (14 hr) and 16-18°C and 70-85%
relative humidity during the night time (10 hr). A mixture of Rhodes (Chloris gayana) and Paspalum grass, wheat seedlings and rabbit pellets, as well as a moistened pad of cotton wool, were maintained in each of the cages. In addition, plastic containers
(10cm diameter X 12cm depth) filled with moist sand were kept in each cage to facilitate the laying of eggs. These containers were checked on alternate days for the presence of egg pods. Egg pods were kept at 30°C until the embryos were needed for
experimentation or until hatching occurred (28 ~ 1 days). Prior to their use, adult grasshoppers were killed, eviscerated and stored in liquid nitrogen.
2.2 DNA Isolation
DNA, from either pooled samples or individual grasshoppers, was isolated using a modification of the protocol of Appels and Dvorak (1982). Whole, eviscerated animals were added to a mortar along with approximately 1 gm of acid washed sand (BDH). Liquid nitrogen was then added and the immersed grasshopper(s) ground
added as necessary to ensure that the sample was immersed. The
powder obtained was transferred to a 15 ml corex centrifuge tube
and 1 ml of buffer (0.1M NaCl, 0.1M EDTA, 0.05M Tris-Sigma, pH
7.5), 100 µl of 5% Lauryl Sulphate (SDS-Sigma) and 100 µl of
Proteinase K (Boehringer - 0.2 mg/ml) were added. Following
vigorous agitation of this mixture, the tube was covered with
parafilm and incubated at 37°C for from 30 min to 3 hr while
other samples were being processed. One ml of phenol was then
added to each tube and the samples agitated occasionally at room
temperature prior to centrifuging at 8000 rpm for 5 min. The
supernatant was transferred to a second 15 ml corex tube, using a
cut pasteur pipette to avoid shearing the DNA. One ml of a
Tris-EDTA (TE) buffer (0.01M Tris, 0.001M EDTA, pH 8.4) was added to
the original tube, the tube was agitated, respun and the
supernatant was transferred to the previously collected sample.
In order to precipitate the native DNA from the supernatant, an
amount equivalent to 0. 1 of the supernatant volume of sodium
acetate (2M, pH 5.5) and two volumes of absolute ethanol were
added. Upon addition of these solutions, the DNA became visible
as long strands. The DNA was collected either by "spooling" via
a pasteur pipette or by centrifuging the sample at 10,000 rpm for
5 min. The DNA was then added to 1 ml of TE buffer and 0.2 ml of
20 X SSC (3M NaCl, 0. 3M NaCitrate), and after it had dissolved,
1.2 µl of RNA'ase A (10 mg/ml Boehringer) was added and the
solution was incubated at 37°C for 30 min. Fifty µl of
5% SDS and 1 ml of phenol were added and the mixture was treated
-24-DNA was dissolved in 1 ml of TE and stored at -20°C until its
use.
2.3 Shearing of DNA and Isolation of a Highly Repeated Fraction
Isolated DNA which had been stored in the TE buffer was
dialyzed into a 0.12M sodium phosphate buffer. This DNA was then
passed three times through a french press at 16,000 psi in order
to shear the DNA to an average size of approximately 500 bp. The sheared DNA was heat denatured and allowed to renature to a Cot
value of approximately 0.02. This value represents a point on the Cot curve which is in the range of highly repeated DNA
koh~e
(Britten and ., 1967). The entire DNA sample was then loaded
onto a hydroxylapatite column using a continuous column loading
system (Appels et al., 1978). After loading, the column was
initially rinsed with aliquots of the 0.12M sodium phosphate
buffer to ensure that single-stranded DNA was washed from the
hydroxylapatite. Subsequently, 5 ml aliquots of 0.5M sodium
phosphate buffer were passed across the column in order to elute
the double-stranded molecules. This fraction was collected,
dialyzed into TE buffer and stored at -20°C.
2.4 Nick-Translation of DNA
Radioactive probes used in various hybridization experiments
were produced using the nick-translation method of Rigby et al.
(1977). For each nick-translation reaction, 0.5 - 1 µg of the
5 µl of [a-32p]dATP (?'-deoxyadenosine 5'-triphosphate, 5µCi/µl,
Amersham), and 15 µleach of 0.5mM dCTP (2'-deoxycytidine
5'-triphosphate, P-L Biochem.), dGTP (2'-deoxyguanosine
5'-triphosphate, P-L Biochem.) and dTTP (thymidine 5'-triphosphate,
P-L Biochem.). This solution was then vacuum dried using a
rotary vacuum and was subsequently resuspended in 8 µl of the
cocktail mix (130 µl of 0.25M NaP04, 5 µl of 1M MgCl2). The
reaction mixture was added to a 1.5 ml eppendorf centrifuge tube
and consisted of the DNA sample (37 µl), 6 µl of the triphosphate
solution, 1 µl of DNA'ase (0.01 mg/ml, Boehringer), 1 µl of 50µM
dATP (2'-deoxyadenosine 5'-trisphosphate, P-L Biochem) and 5 µl
of DNA polymerase I (Kornberg polymer, Biolabs). This solution
was incubated at 14°C for 1 hr. To monitor the extent of the
reaction, 1 µl of the reaction mixture was then added to 100 µl
of H20. Ten microlitres of this dilution was added to 50 µl of
sonicated salmon sperm.DNA (2 mg/ml) and 1 ml of 5%
trichloroacetic acid. This mixture was placed on ice for 5 min
to allow precipitation and was then loaded onto a glass fibre
filter (Whatman), washed twice with 2 ml aliquots of 0.1M
Na2H2P20] (Sigma) in 1M HCl and finally with approximately 10 ml
of absolute ethanol. This filter represented the incorporated
radioactivity. The total amount of radioactivity was measured by
spotting 10 µl of the diluted reaction sample onto a glass fibre
filter. Replicate filters were prepared for both the total and
incorporated measurements. The filters were dried, placed in
1 Unless otherwise noted, the H20 used in the experiments was
-26-scintillation vials, scintillant (0.06% 2,5-Diphenyloxazole,
Calbiochem and 0.006% 1,4-di[2-(5-Phenyloxazolyl)]-benzene
Calbiochem, in Toluene) was added and the radioactivity present
in each vial measured using a Packard Tri-Carb Liquid
Scintillation Spectometer. The percentage of incorporation of
radioactive nucleotides was then calculated. In order to remove
the enzymes present in the reaction mixture, 100 µl of TE, ?5 µl
of 0.25M EDTA, 5 µl of 5% SDS, 100 µl of phenol and 100 µl of
chloroform were added. Following vigorous vortexing, the
phenol/chloroform and aqueous phases were separated by
centrifugation for 1 min in an Eppendorf (Model 5414) centrifuge.
The aqueous phase was transferred with a pipettman to a fresh
eppendorf centrifuge tube. The phenol/chloroform was then washed
with an additional 50 µl of TE and, following separation of the
phases, the aqueous portion was added to the previously removed
aliquot. This sample was ethanol precipitated after which the
pellet was washed with 70% ethanol and then vacuum dried. In
order to increase the single-strand length of the nick-translated
DNA from 50-100 nucleotides up to approximately 300 nucleotides
(Appels and Dvorak, 1982), the sample was ligated using T4 DNA
ligase (see Higgins and Cozzarelli, 1979 for a review of the
properties of T4 ligase) . The pellet was resuspended in 13 µl of
H20, 4 µl of 5 X ligase buffer (50mM Tris-HCl pH 7.8, 10mM MgCl2,
50 µg/ml bovine serum albumin), 2 µl of 10 mM ATP, 0.2 µl of 1M
DL-Dithiothreitol (DTT-Sigma) and 0.5 µl of T4 DNA ligase (4 X
105 units/ml-Biolabs) . This reaction was incubated at 15°C from
2 - 20 hrs. Subsequently, 1 µl of 5% SDS and 6 µl of proteinase
for 30 min. The sample was then extracted (as described above)
with 100 µl TE, 130 µl phenol and 130 µl chloroform and the
phenol/chloroform phase was washed with an additional 100 µl of
TE. The aqueous portion was loaded onto a sephadex G-75 column
(
'f""..-
x.135
...,__
0
(Pharmacia) and 20 X 14 drop samples were collected using a
Gilson Micro Fractionator. The passage of the labelled DNA as
well as the unincorporated nucleotides were monitored by placing
the output tube from the sephadex column onto a radiation
monitor. The first peak of radiation, which contained the
nick-translated DNA, was collected and stored at -20°C until needed.
An alternative method for preparing nick-translated DNA has
involved the use of the "Nick-translation Kit" purchased from
Bresa. The kit includes the non-radioactive nucleotides along
with an enzyme mix containing DNA'ase and DNA polymerase I.
Nick-translation is accomplished by adding 3 µl of an aqueous
solution of [a -32P] dCTP (2'-deoxycytidine 5'-triphosphate,
Amersham), 4 µl of the nucleotide mix and 5 µl of the enzyme mix
to 8 µl of the appropriate DNA template in H20 and incubating
this reaction mixture at 14°C for 90 min. The processing of the
nick-translated DNA is identical to that previously described
except for the following modification. The nick-translated and
ligated sample was not passed over a sephadex column, but rather,
was subjected to two ethanol precipitations. Two hundred
-28-2.5 Synthesis of 3H c-RNA for in situ Hybridization Probes
The protocol used in these experiments involved a
modification of the procedure reported by Pardue et al. (1970).
In an acid washed tube, 100 µleach of 3H CTP ([5-3H] l)'\f\'\O I
3 cytidine 5'-triphosphate, 25 Ci/ , Amersham), 3H UTP ([5,6- H]
" ' l\'\l1 I
uridine 5'-triphosphate, 40 Ci/ , Amersham) and 3 H ATP ([2,8-3 H]
M ff\" I
adenosine 5'-triphosphate, 29 Ci/ , Amersham) along with 10rnM
GTP (guanosine 5'-triphosphate, P-L Biochem) were mixed and then
evaporated using a rotary vacuum. These nucleotides were
resuspended in 20 µl of H20 and transferred to an eppendorf tube
containing 1 µg of the selected DNA in 15 µl of H20. To this
tube were added 10 µl of 5 X RNA polymerase buffer (40rnM Tris
HCl, pH 7.9, 10rnM MgCl2, 0.1rnM EDTA, 150rnM KCl, 500 µg/ml bovine
serum albumin), 0.5 µl of 1M DTT and 5 µl RNA polymerase (0.9
units/µl, Boehringer). The reaction mixture was incubated at
37°C for 30 min. at which time the percentage of incorporated 3H
nucleotides was determined as described in section 2.4. Two
hundred and fifty µl of 0.05M Tris, 10 µl of DNA'ase
(0.01 mg/ml, Boehringer), 5 µl of yeast RNA (10 mg/ml) and 5 µl
.OSM
ofACaC1 2 were added to the reaction solution and the mixture was
allowed to incubate a further 30 min. at room temperature. The
c-RNA reaction solution was subsequently extracted by adding 25
µl of 0.25M EDTA, 1 µl of 5% SDS, 100 µl of phenol and 100 µl of
chloroform. The phenol/chloroform phase was washed with 100 µl
of 0.05M Tris and the pooled aqueous phases were loaded onto a
sephadex 200 column. Twenty-four X 14 drop fractions were
collected utilizing a Gilson Micro Fractionator. One µl
glass fibre filters. The filters were then assayed for the amount of 3H present and the first peak of radiation was collected for use in in situ hybridization experiments.
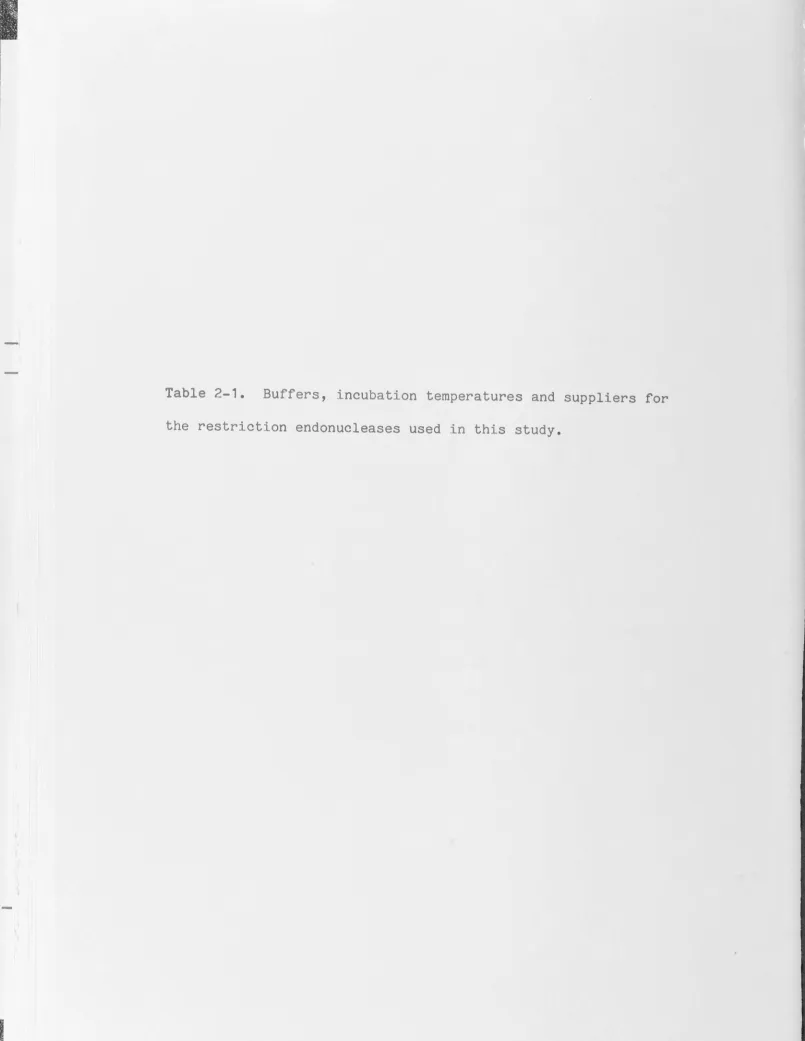
2.6 Restriction Endonuclease Experiments
Numerous analyses involving the use of restriction
endonucleases were carried out during the course of this study (see Table 2-1 for enzymes used). In all reactions the following percentages of the various constituents were held constant:
selected DNA sample, 66% of the final volume; appropriate 10 X buffer (Table 2-1), 10% of the final volume; 2-mercaptoethanol (1% solution), 6.6% of the final volume; appropriate enzyme (used at 2 units/µg of DNA unless otherwise noted) plus an amount of H20 to equal 17.4% of the final volume. This mixture was
incubated at the suitable temperature (Table 2-1) for 1 hr. The enzyme reaction was terminated by adding 5% SDS to a final
concentration of 0.1% and then incubating the sample at 65°C for 3 min. Loading dye (50% glycerol, 0.12M EDTA pH 8.0, 0.5% SDS, 0.25% Bromophenol Blue) was added to each sample equivalent to 20% of the final volume and the sample was stored on ice until required.
2.7 Gel Electrophoresis
Depending upon the length of the DNA restriction fragments under investigation, either an agarose or acrylamide matrix was utilized. In addition, various percentages of agarose and
Taq
I
3 65 R. AppelsBarn HI 4 37 Biolabs
Eco RI 1 37 Biolabs
Hind III 2 37 Biolabs
Pst I 4 37 Biolabs
Pvu I 4 37 Biolabs
Ace I 3 37 Biolabs
Ava II 3 37 Biolabs
Xma III 3 37 Biolabs
Rsa I 3 37 Biolabs
Hae III 3 37 Biolabs
Hha I 5 37 Biolabs
Sau 3A1 3 37 Biolabs
Cla I 3 37 Biolabs
* See Roberts (1979) for a list of sources and references
** 1 = 1 OOmM Tris-HCl ( pH 7. 5), 50mM NaCl, 5mM MgCl2, 100 µg/ml bovine serum albumin;
**
2=50mM Tris-HCl (pH 8.0), 50 mM NaCl, 10mM MgCl2, 100 µg/rnl bovine serium albumin;** 3=6mM Tris-HCl (pH 7.4), 50mM NaCl, 6rnM MgCl2, 6mM ?-mercaptoethanol, 100 µg/ml bovine serum albumin;
** 4=6mM Tris-HCl (pH 7.9), 150 rnM NaCl, 6mM MgCl2, 100 µg/ml bovine serum albumin;
-30-fragments. Agarose gels consisted of the suitable amount of agarose (Sigma, Type II: Medium EEO), 7.5 ml of 20 X
electrophoresis buffer (0.8M Tris, 0.4M sodium acetate, 0.04M EDTA, pH 8.4), 142.5 ml of H20 and 0.15 ml of ethidium bromide
(0.5 mg/ml, Sigma). Subsequent to dissolving the agarose with boiling, the solution was used for either horizontal slab gels or disc gels. The disc gels were employed in analyzing an aliquot of the samples in order to verify that complete digestion had occurred. These gels were electrophoresed at 10mA per gel. The running buffer for both the disc and slab gel electrophoresis consisted of 100 ml of the 20 X electrophoresis buffer,?. ml of ethidium bromide and 1898 ml of H2
o.
The horizontal gels were electrophoresed at 100mA until the bromophenol blue had migrated approximately 75% of the gel length.A vertical slab acrylamide system was also employed for higher resolution of restriction fragments. The percentage of acrylamide used in any one gel ranged from 8-1?%. An 8%
gel consisted of 27 ml of a 30% acrylamide solution (142.5
gm of acrylamide, Sigma, 7.5 gm of N,N'-methylene-bis-acrylamide-Sigma, in 500 ml H20), 10 ml of 10 X TBE buffer (108 gm Tris, 9.3 gm EDTA, 55 gm Boric acid, up to 1 1 with H2
o,
pH 8.3), 3.3 ml of a 1.6% solution of ammonium persulphate (BDH), ?O ml of a 50% glycerol solution plus H20 to bring the final volume up to 100 ml. This solution was filtered, by suction, through two no. 1 qualitative paper filters (Whatman) and was then left undervacuum for approximately 2 min to remove any air bubbles. Forty µl of N,N,N' ,N'-tetramethyl-ethylenediamine (TEMED, Sigma)
then poured between two 390 mm X ?00 mm glass plates with 0.3 mm
spacers. Samples to be run on these gels were treated in the same manner as for agarose gels. The running buffer for these gels consisted of 1 X TBE (1/10 dilution of 10 X TBE).
Following electrophoresis, it was necessary to stain the acrylamide gel in a 0.005 mg/ml solution of ethidium bromide. Visualization of the electrophoresed samples were then possible
(in both the acrylamide and agarose systems) by placement of the gels onto a light box equipped with ultraviolet lamps (15 watt). The DNA bands were then photographed with a mounted Polaroid Land Camera (MP4) using Polaroid Coaterless Land Pack film (Type 667 or 665).
2.8 Transfer of DNA from Agarose Gels to a Nylon Membrane
In numerous experiments, DNA fragments electrophoresed in an
agarose matrix were transferred to Gene Screen (New England
Nuclear) using a modification of Southern's (1975b) technique.
Gels containing the DNA fragments were trimmed so that an
approximately 1 cm border remained on each side. In addition, the cathodal portion of the gel was removed as well as the
portion from 3 cm anodal to the bromophenol blue dye front. The
remaining gel was immersed in a 1.5M NaCl, 0.5M NaOH denaturing solution and was stirred gently for 30 min. The denaturant was removed, the gel rinsed twice with approximately 200 ml of
distilled H20, neutralizing buffer (3M NaCl, 0.5M Tris-HCl, pH 7.0) was added and the solution stirred gently for at least 4~ min. Prior to the denaturing step, a piece of Gene Screen