Int. J. Electrochem. Sci., 13 (2018) 6858 – 6869, doi: 10.20964/2018.07.27
International Journal of
ELECTROCHEMICAL
SCIENCE
www.electrochemsci.org
Effects of Initial Powder Size on Microstructure and Corrosion
Resistance of in situ (Ti-V)C Reinforced Fe-based Laser
Cladding Layers
Kai Chong, Hui Zhang*, Guangchun Xiao, Hui Xu, Wei Zhao
College of mechanical and automotive engineering, Qilu University of Technology (Shandong Academy of Sciences), 250061, Jinan, China
*
E-mail: [email protected]
Received: 18 February 2018 / Accepted: 30 April 2018 / Published: 5 June 2018
The effects of initial powder size on in situ carbide morphology, hardness and the corrosion resistance in Fe-based cladding layers were studied. The results indicated that Ti-V carbides were obviously refined with decreasing the ferrotitanium-ferrovanadium, graphite and iron powder particle size. However, decreasing the iron powder size individually leads to carbides growing and aggregating. The refinement of carbides was mainly controlled by the graphite particle size. The hardness displayed the tendency rising up at the beginning and declining in late, and the corrosion resistance increased about as powders decreased from 180-380 μm to 23-38 μm. The layer obtained using the alloy powder with a size of 75-150 μm showed a higher hardness and a better corrosion resistance simultaneously. The galvanic corrosion was the main type of corrosion in the cladding layers, regardless of the size of the carbides.
Keywords: laser cladding; powder size; TiC-VC; carbide morphology; corrosion resistance
1. INTRODUCTION
cladding alloy powders [19-21], or the process of laser cladding [22-24]. Unfortunately, there are limited reports focused on optimizing the particle size of initial alloy powders.
It has been reported in the literature that the particle size of alloy powders may affect the microstructure and properties of the cladding layers[25]. Didier et al.[26] indicated that the smaller the particle size of 316 L stainless steel powder, the finer the microstructure of the cladding layer. Daichi et al. [27] indicated that the heat affected zone area was reduced by 22% upon changing the Ni-Cr-Si-B raw alloy powders particle size from 55 to 30μm. Shi et al. [28] found that a decrease of the particle radius leads to an earlier melting time. Deschuyteneer et al. [29] reported that there were obvious advantages in using smaller particles, and hence increased the NiCrBSi/WC laser cladding layers’ wear resistance in sliding conditions. However, the microhardness of NiCr+Cr3C2 cladding coatings
[image:2.596.56.541.438.513.2] [image:2.596.59.540.534.703.2]tends to decrease with reduction of the powder size[30]. Previous studies indicated in situ Ti-V carbide particle-reinforced Fe-based laser clad composite layers possessed good hardness and wear resistance [17, 18, 31]. However, to the best knowledge of the authors, the particle size of initial alloy powders has not been comparatively studied. Therefore, the purpose of this study is to investigate the effect of ferrotitanium, ferrovanadium, graphite and iron powder particle size on in situ Ti-V carbides morphology, hardness and corrosion resistance of clad layers.
2. EXPERIMENTAL PROCEDURES
Table 1. Chemical composition of ferrotitanium powder and ferrovanadium powder
Ferroalloy powder
Chemical composition (wt.%)
Ti V Al Si C P S Fe
Ferrotitanium powder 26.15 — 7.10 4.50 0.089 0.049 0.030 62.082
Ferrovanadium powder — 47.80 0.50 2.00 0.480 0.078 0.033 59.109
Table 2 Particle size of initial alloy cladding powders
Samples Ferrotitanium powder
size/μm Ferrovanadium powder size/μm Graphite powder size/μm Iron powder size/μm
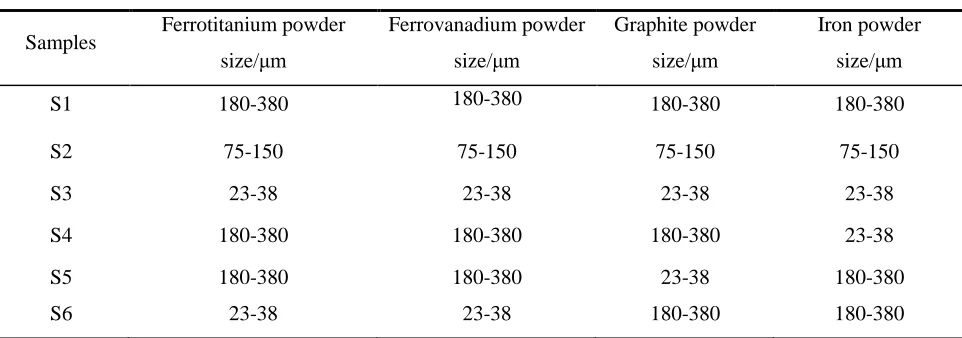
S1 180-380 180-380 180-380 180-380
S2 75-150 75-150 75-150 75-150
S3 23-38 23-38 23-38 23-38
S4 180-380 180-380 180-380 23-38
S5 180-380 180-380 23-38 180-380
S6 23-38 23-38 180-380 180-380
ethanol before laser cladding. Fe-based alloy powders were composed of 26.00 wt.% ferrotitanium, 16.57 wt.% ferrovanadium, 6.23 wt.% graphite (99.50% purity) and 51.20 wt.% pure iron powders (98.50% purity). The chemical compositions of ferrotitanium and ferrovanadium powder are listed in Table 1, and the particle size of cladding powders are listed in Table 2. Mixed powders were preplaced onto the specimen surface, with approximate 1.0 mm thickness, by using a sodium silicate binder. Laser cladding was performed by a LASERLINE LDF-4000 semiconductor laser. The laser beam diameter, the optimized laser power, the scanning speed and the overlapping ratio in this investigation were 4.0 mm, 2050 W, 5.0 mm/s and 25%, respectively.
Phases of the coatings were analyzed using a Rigaku RINT-2000 X-ray diffractometer (Cu Kα). The cladding layers were etched with a 4% nitric acid alcohol solution, and the morphologies were observed using a Zeiss SUPRA55 scanning electron microscope and a Leica optical microscope. The average grain size of the cladding layers were measured using the area method. The microzone composition was investigated using an energy dispersive spectrometer (EDS). Microhardness measurements were performed using a microhardness Vickers tester with a load of 200 g applied for 15 s. Polarization curves of laser cladding specimens were measured in a 3.5 wt.% NaCl solution at room temperature and were conducted with a scan rate of 1 mV/s by a Gamary electrochemical workstation. A saturated calomel electrode (SCE) was used as the reference electrode, a platinum electrode was used as the counter electrode, and the treated laser cladding specimens was used as the working electrodes. To stabilize the open-circuit potential, the samples were immersed in the solution for 30 min before each test. The tests were repeated three times to ensure reliability. The polarization curves were calculated from the Tafel extrapolation method. The corrosion current density was determined by calculating Tafel line slips. Corrosion morphologies after running the polarization test were observed by SEM.
3. RESULTS AND DISCUSSION
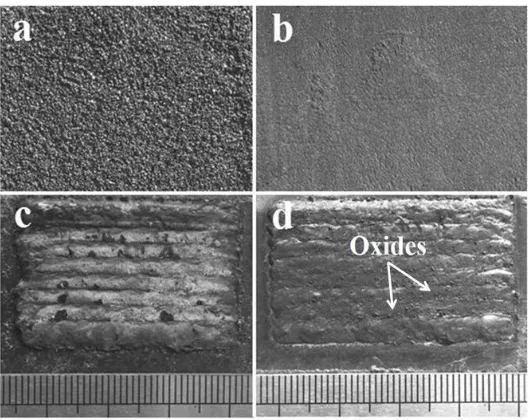
Figure 1. Macro morphologies of the (a) S1 (b) S3 prepared layers and the (c) S1 (d) S3 cladding layers
XRD patterns of cladding layers are shown in Fig. 2. Following analysis of the XRD patterns, there is α-Fe, TiC and TiVC2 in all of the cladding layers and the diffraction peaks of γ-Fe indicates
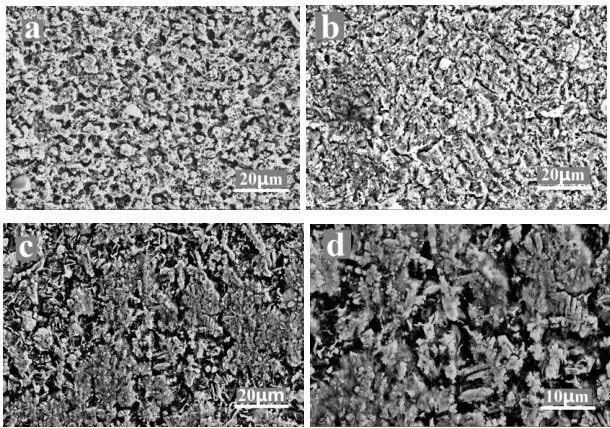
[image:4.596.178.443.77.287.2]that there is also retained austenite in the S3 and S4 cladding layers. Furthermore, the full width at half maximum (FWHM) of α-Fe (110) crystal face diffraction peak in S1, S2, S3, S4, S5 and S6 is 0.528, 0.810, 0.400, 0.484, 0.355 and 0.257, respectively. According to the Scherrer equation of Dβcosθ=Kλ (where D is the crystallite size, β is the FWHM, θ is the Bragg angle, K is the Scherrer constant and λ is the X-ray wavelength)[34, 35], it can be indicated that the cladding layer matrix grains were refined first and then coarsened with the decrease of the initial alloy powder size in S1-S3. Optical microscope images of S1 and S3 cladding layers are shown in Fig. 3. After being analyzed, the average grain size of the S1 and S3 cladding layer matrix is approximately 4.98 μm and 7.28 μm, which shows the same variation tendency of matrix grain size compared with the XRD analysis.
[image:4.596.196.399.555.730.2]
Figure 3. Optical microscope images of S1 and S3 cladding layers
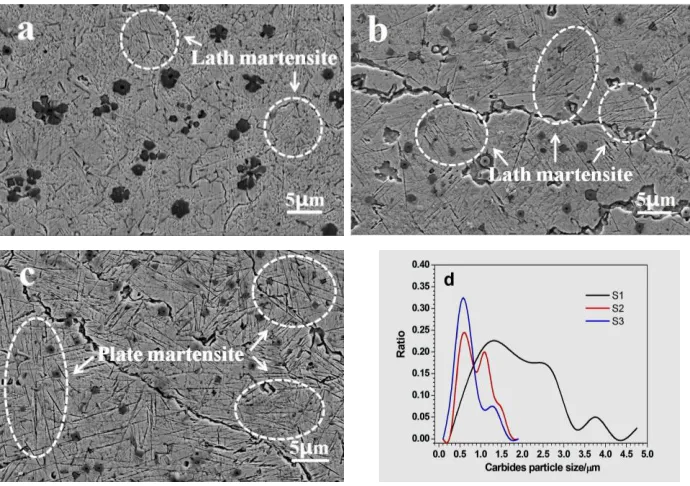
Figure 4. Secondary electron imaging of (a) S1 (b) S2 (c) S3 cladding layers and (d) carbides particle size distribution
[image:5.596.128.473.278.521.2]
Generally, the cladding layer matrix could heterogeneously nucleate on the TiC and TiVC2 carbides,
thus the finer carbides increased their nucleation number, so the S2 cladding layer shows a smaller grain size. The heat input during laser cladding increased as the powder size decreased, which caused the grains to grow in S3 cladding layer.
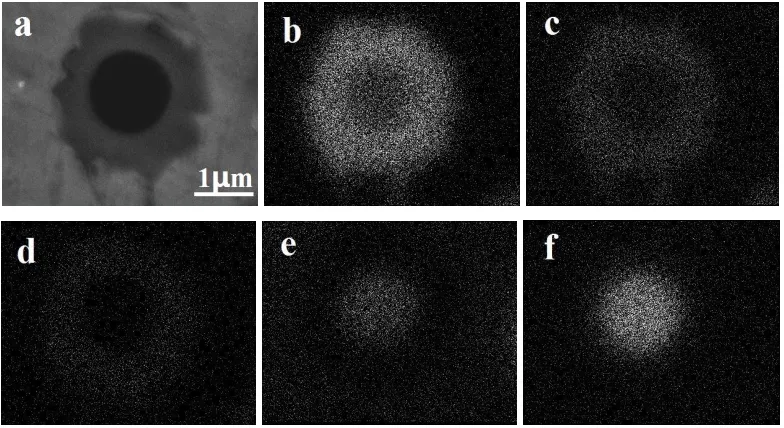
In addition, it is also observed that there is a black core in some of the carbides, and the EDS face scanning analyses are shown in Fig. 5. The result shows that the black core is mainly composed of Al and O elements, so it can be ascertained as aluminum oxide. In addition, the amount of aluminum oxideincreases from S1 to S3 which indicates that the Al element undergoes more and more serious oxidation. The oxidation of aluminum and titanium was propitious to carbon transition [36], so the cladding layer microstructure transformed from lath martensite into plate martensite in S3. The appearance of the retained austenite in S3, might be attributed to the mechanical stabilization caused by the plate martensite [37, 38]. Zou et al. [39] reported that the amount of retained austenite in Fe-based cladding layers increased first and then decreased with the addition of Cr increased in a certain range, which was also caused by the chemical stabilization and the mechanical stabilization.
[image:6.596.103.495.335.549.2]
Figure 5. Secondary electron image and EDS face scanning of elements in carbide (a) SE image (b) Ti (c) V (d) C (e) O (f) Al
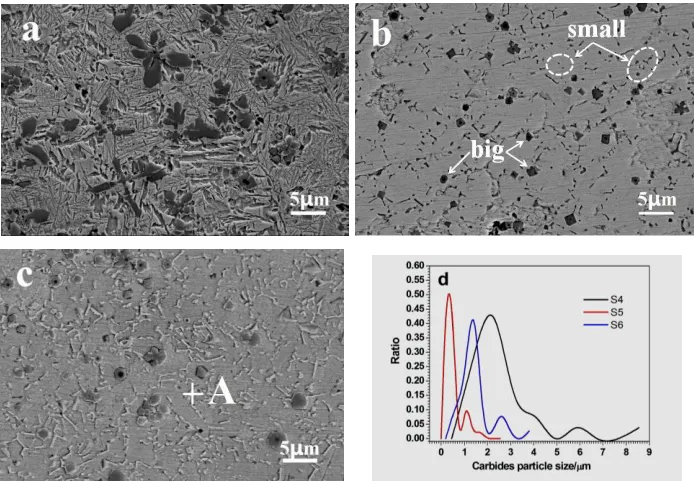
74.35% and 22.51% compared with that in the S1 cladding layer. Therefore, it can be inferred that decreasing iron powder size individually leads to carbides growing and aggregating. In contrast, the decreasing graphite or ferrotitanium and ferrovanadium powder size individually can refine carbides. In addition, the refinement of the carbides caused by graphite is much more obvious than ferrotitanium and ferrovanadium.
[image:7.596.124.471.177.418.2][image:7.596.176.421.458.588.2]
Figure 6. Secondary electron imaging of (a) S4 (b) S5 (c) S6 cladding layers and (d) carbide particle size distribution
Figure 7. EDS spot composition analysis of the A spot in Fig. 6(c)
[image:8.596.142.459.193.314.2]
diffusing toward graphite, which is beneficial to carbides growth in S4. For S5, finer graphite powders are distributed evenly between iron, ferrotitanium and ferrovanadium powders, resulting in increasing the nucleation number of the carbides which is conducive to the refinement of the carbides. In S6, the quick-melting of finer ferrotitanium or ferrovanadium powders flows around graphite, and they were also diffused into the initial position of the iron powder under the concentration gradient action thus causing Fe-Ti-V eutectics.
Figure 8. Schematic diagram of prepared initial alloy powders (a) S4 layer (b) S5 layer (c) S6 layer
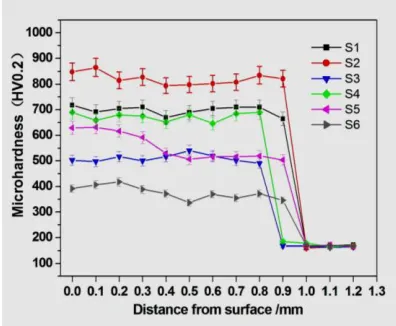
The average hardness from the S1 to the S6 cladding layer is 700 HV0.2, 820 HV0.2, 510 HV0.2, 670 HV0.2, 560 HV0.2 and 380 HV0.2, respectively, as shown in Fig. 9. It can be observed that the hardness increases first and then descends later as initial alloy particle sizes of the powders are reduced. It can be known that the strength and the toughness increased as reducing the average grain size according to the Hall-Petch relationship[41], which in turn enhanced the fine-grain strengthening effect. Therefore, the finer matrix grains and more uniformly distribution of the carbides in S2 cladding layer increased its hardness. Zou et al.[18] also found that the microhardness increased with the average grain size of Fe-based cladding layer and the carbide particle size decreased. Although the size of the carbides decreased, the growth of the cladding layer matrix grains and the appearance of the retained austenite in S3 cladding layer caused its hardness to decrease 190 HV0.2 compared with S1 cladding layer. Moreover, the reason for the S6 cladding layer shows the lowest hardness can be attributed to the maximum layer matrix grain size.
[image:8.596.198.396.576.739.2]
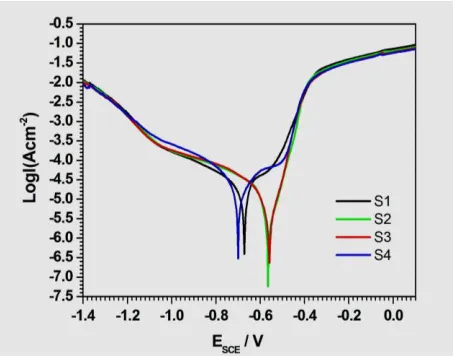
Fig. 10 shows the potentiodynamic polarization curves of the S1-S6 cladding layers in 3.5 wt.% NaCl solution. As shown in Table 3, the corrosion potential shifted to positive, both the Icorr and the βa
decreases from S1 to S3 cladding layer, which means that the corrosion resistance increases as the initial powder size decreasing. Morevoer, the absolute value of the βa in S1, S2 and S3 was smaller
than that of βc , however, the absolute value of the βa in S4 was much bigger than that of βc, which
means that the corrosion process was controlled by the anodic reaction of the Fe+2e-→Fe2+. The Icorr
and the βa indicates the S3 displays a best corrosion resistance, which is approximately 2.8 times
[image:9.596.186.413.297.475.2]compared with that of the S1 cladding layer. On one hand, the enhanced corrosion potential was good for reducing the corrosion tendency. On the other hand, the reduction of the particle size of the carbides decreased the galvanic corrosion that was generated between the carbides and layer matrix, and the decreasing of the amounts of grain boundaries caused by grains growth decreased the galvanic corrosion that generated between cladding layer matrix grains and grain boundaries. Therefore, the corrosion resistance of the S3 cladding layer increased.
[image:9.596.86.512.556.653.2]Figure 10. Polarization curves of cladding layers in 3.5 wt. % NaCl solution
Table 3. Fitting results of polarization curves
Samples Ecorr (V) Icorr (μA/cm
2
) βa(mV/dec) -βc(Mv/dec)
S1 -0.6720 23.53 306.67 363.79
S2 -0.5544 11.86 58.03 253.21
S3 -0.5497 8.26 51.41 190.44
S4 -0.6889 39.90 602.13 363.89
improved its corrosion resistance. Remarkably, there are many heavy corrosion marks around large carbides in the S4 cladding layer, as clearly shown in Fig. 11(c) (d). The reason why the S4 cladding layer displays the worst corrosion resistance can be attributed to the severe galvanic corrosion that occurred between the cladding layer matrix and large carbides.
[image:10.596.145.450.227.441.2]Therefore, it can be inferred that the galvanic corrosion, was the main corrosion type in the cladding layers, regardless of whether the carbides were large or small. Corrosion occurred between the cladding layer matrix and the carbides when they were large; on the contrary, corrosion occurred between the grains and their boundaries in the cladding layer matrix.
Figure 11. Corrosion morphologies after running potentiodynamic polarization of (a) S1 (b) S3 and (c) (d) S4 cladding layers
4. CONCLUSION
(1) There are obvious effects of initial alloy powder particle size on the carbides size, hardness and corrosion resistance of in situ Ti-V carbides reinforced Fe-based clad layers. With decreased initial alloy powder size, the size of the carbides also decreased, which was mainly controlled by the graphite particle size; the microstructure of the cladding layer changed from lath martensite into plate martensite and retained austenite. The decreasing iron powder size individually leads to the carbides growth and aggregation
ACKNOWLEDGMENT
The work was supported by the National Nature Science Foundation of China (No. 51605237) and the Natural Science Foundation of Shandong province of China (ZR2017LEE011).
References
1. B. Du, S.R. Paital, N.B. Dahotre, Opt. Laser. Technol., 45 (2013) 647-653.
2. Y.-b. Cao, S.-x. Zhi, Q. Gao, X.-t. Tian, T. Geng, X. Guan, C. Qin, Mater. Charact., 119 (2016) 159-165.
3. Z. Weng, A. Wang, Y. Wang, D. Xiong, H. Tang, Sur. Coat. Technol., 286 (2016) 64-71. 4. X. Duan, S. Gao, Q. Dong, Y. Zhou, M. Xi, X. Xian, B. Wang, Sur. Coat. Technol., 291 (2016)
230-238.
5. M. Masanta, S.M. Shariff, A. Roy Choudhury, Mater. Des., 90 (2016) 307-317.
6. X.-L. Lu, X.-B. Liu, P.-C. Yu, Y.-J. Zhai, S.-J. Qiao, M.-D. Wang, Y.-G. Wang, Y. Chen, Appl. Surf. Sci., 355 (2015) 350-358.
7. J. Li, C. Xia, P. Liu, G. Pan, C. Wang, J. Alloys. Compd., 645 (2015) 504-508. 8. L. Ding, S. Hu, X. Quan, J. Shen, Sur. Coat. Technol., 313 (2017) 355-360. 9. M. Qunshuang, L. Yajiang, W. Juan, L. Kun, Mater. Des., 92 (2016) 897-905.
10.X.-B. Liu, X.-J. Meng, H.-Q. Liu, G.-L. Shi, S.-H. Wu, C.-F. Sun, M.-D. Wang, L.-H. Qi, Mater. Des., 55 (2014) 404-409.
11.G. Muvvala, D. Patra Karmakar, A.K. Nath, Mater. Des., 121 (2017) 310-320. 12.G. Muvvala, D. Patra Karmakar, A.K. Nath, Opt. Lasers. Eng., 88 (2017) 139-152. 13.F. Weng, H. Yu, C. Chen, J. Dai, Mater. Des., 80 (2015) 174-181.
14.Z. Zhang, P. Farahmand, R. Kovacevic, Mater. Des., 109 (2016) 686-699.
15.M. Masanta, P. Ganesh, R. Kaul, A.K. Nath, A. Roy Choudhury, Mater. Sci. Eng. A., 508 (2009) 134-140.
16.D. Jiang, C. Hong, M. Zhong, M. Alkhayat, A. Weisheit, A. Gasser, H. Zhang, I. Kelbassa, R. Poprawe, Sur. Coat. Technol., 249 (2014) 125-131.
17.H. Zhang, K. Chong, W. Zhao, Z. Sun, Sur. Coat. Technol., (2018). 18.H. Zhang, Y. Zou, Z. Zou, W. Zhao, Mater. Lett., 139 (2015) 255-257. 19.Y.H. Lv, J. Li, Y.F. Tao, L.F. Hu, Appl. Surf. Sci., 402 (2017) 478-494. 20.Z. Zhang, T. Yu, R. Kovacevic, Appl. Surf. Sci., 410 (2017) 225-240. 21.D. Janicki, Opt. Laser. Technol., 94 (2017) 6-14.
22.F. Weng, H. Yu, C. Chen, J. Liu, L. Zhao, J. Dai, Z. Zhao, J. Alloys. Compd., 692 (2017) 989-996. 23.B. Zhang, C. Coddet, J. Manuf. Process., 23 (2016) 54-60.
24.A. Harooni, A.M. Nasiri, A.P. Gerlich, A. Khajepour, A. Khalifa, J.M. King, J. Mater. Process. Technol., 230 (2016) 263-271.
25.M. Xu, J. Li, J. Jiang, B. Li, Procedia. CIRP., 29 (2015) 804-809. 26.D. Boisselier, S. Sankaré, Phys. Procedia, 39 (2012) 455-463.
27.D. Tanigawa, N. Abe, M. Tsukamoto, Y. Hayashi, H. Yamazaki, Y. Tatsumi, M. Yoneyama, Opt. Lasers. Eng., 101 (2018) 23-27.
28.Y. Shi, Y. Zhang, C. Konrad, Nanosc. Microsc. Therm. Eng., 11 (2007) 301-318.
29.D. Deschuyteneer, F. Petit, M. Gonon, F. Cambier, Sur. Coat. Technol., 311 (2017) 365-373. 30.L. Wang, J. Zhou, Y. Yu, C. Guo, J. Chen, Appl. Surf. Sci., 258 (2012) 6697-6704.
31.H. Zhang, Y. Zou, Z. Zou, D. Wu, Opt. Laser. Technol., 65 (2015) 119-125.
32.J.C. Heigel, M.F. Gouge, P. Michaleris, T.A. Palmer, J. Mater. Process. Technol., 231 (2016) 357-365.
35.A.W. Burton, K. Ong, T. Rea, I.Y. Chan, Microporous. Mesoporous. Mater., 117 (2009) 75-90. 36.S.S. Babu, S.A. David, J.M. Vitek, K. Mundra, T. DebRoy, Mater. Sci. Technol., 11 (1995)
186-199.
37.B.P.J. Sandvik, C.M. Wayman, Metall. Trans. A., 14 (1983) 823-834. 38.B.P.J. Sandvik, C.M. Wayman, Metall. Trans. A., 14 (1983) 809-822. 39.H. Zhang, Y. Zou, Z. Zou, C. Shi, J. Alloys. Compd., 614 (2014) 107-112. 40.A.M. Kanury, Metall. Trans. A., 23 (1992) 2349-2356.
41.W. Yuan, S.K. Panigrahi, J.Q. Su, R.S. Mishra, Scripta. Mater., 65 (2011) 994-997.