Int. J. Electrochem. Sci., 13 (2018) 8817 – 8826, doi: 10.20964/2018.09.10
International Journal of
ELECTROCHEMICAL
SCIENCE
www.electrochemsci.org
Effect of Sintering time on Mn
3+/Mn
4+Ratio and Rate
Capability of Spinel Li
1.02Mn
2O
4Yang Fu1, Yi-Jie Gu1, *, Yun-Bo Chen2, Hong-Quan Liu1, Zi-Zhen Xu1, Wen-Li Kong1, Yan-Jie Wu1
1
College of Materials Science and Engineering, Shandong University of Science and Technology, Qingdao 266510, China
2
Advanced Manufacture Technology Center, China Academy of Machinery Science and Technology, Beijing 100044, China
*
E-mail: [email protected]
Received: 20March 2018 / Accepted: 14 June 2018 / Published: 5August 2018
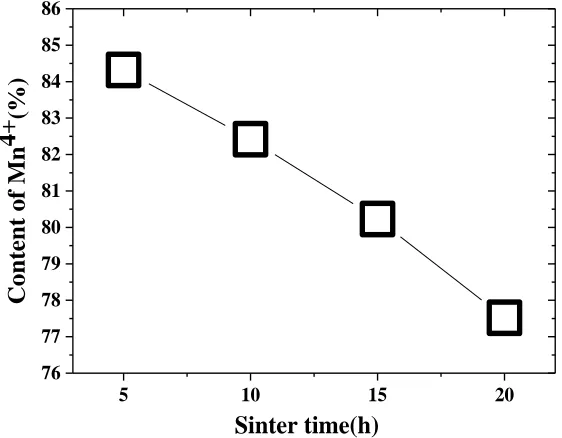
The spinel Li1.02Mn2O4 samples were synthesized at different sintering times (5 h, 10 h, 15 h, and 20 h) via a solid-state method. The Mn4+ content decreases from 84.32% to 77.52% as the synthesis time increases from 5 h to 20 h, as indicated by Mn 2p3/2 X-ray photoelectron spectra. The rate capability of Li1.02Mn2O4 samples increased initially and then decreased as synthesis time increased from 5 h to 20 h. Our results show that Li1.02Mn2O4 sample synthesized for 10 h has the best rate capabilities of 144.1 mAh/g, 138.2 mAh/g, 126 mAh/g, and 106.2 mAh/g at 0.1, 0.2, 0.5, and 1 C, respectively. We suggest that change in rate capability of the Li1.02Mn2O4 samples with increased synthesis time is related to the modification of Mn4+ content in LiMn2O4.
Keywords: Spinel LiMn2O4; Mn3+/Mn4+ ratio; High-rate performance.
1. INTRODUCTION
Because LiMn2O4 cathode material has many advantages over other cathode materials, it has attracted worldwide attention [1-6]. However, spinel LiMn2O4 still has the unavoidable challenges of poor cycling retention and limited rate performance, especially the rapid capacity fade at elevated temperature, which adversely influences its potential as a cathode material for next-generation lithium-ion batteries. Capacity fading has been attributed to manganese dissolutlithium-ion, structural instability, and Jahn-Teller distortion [7-9], and Mn3+ is responsible these processes [10-12].
h, 15 h, and 20 h) using the same precursors prepared by the solid-state reaction method. The structure, morphology, and Mn valence state of LiMn2O4 were obtained by X-ray diffraction (XRD), scanning electron microscopy (SEM), and X-ray photoelectron spectroscopy (XPS), respectively.
2. EXPERIMENTAL
2.1. Materials synthesis
To synthesize LiMn2O4, the mixture of as-prepared Mn3O4 and Li2CO3 (molar ratio of Li:Mn = 1.02:2) was mixed with alcohol in the agate mortar, and calcined at 500 °C for 5 h and then synthesized at 750 °C for different times (5 h, 10 h, 15 h, 20 h). Finally, a black powder (LiMn2O4) was obtained. Pristine Mn3O4 and Li2CO3 were obtained from industrial manufacturers.
2.2. Characterization of materials
The structure of the LiMn2O4 was characterized by powder X-ray diffraction (XRD, D/Max2500PC, Japan) with a tube voltage of 30 kV, a tube current of 100 mA, and a 2θ scan range of 10–120° with a step size of 0.02°. The morphology and microstructure of the samples were studied using field-emission scanning electron microscopy (FESEM, Nova Nano SEM450, USA). X-ray photoelectron spectroscopy (XPS) was performed using Thermo Scientific ESCALAB 250 XI with a monochromatic Al Kα (1350.08 eV) anode (250 W, 10 kV, 30 mA).
2.3. Electrochemical measurements
The as-synthesized LiMn2O4, carbon black, and polyvinylidene fluoride were mixed at a weight ratio of 85:10:5 in N-methyl-2-pyrrolidone to form a slurry. Charge/discharge tests were performed over a voltage range of 3.0–4.3 V with a battery test system (LAND-CT2001A, China). EIS was performed using an impedance analyzer (Zahner Elektrik IM6, Germany) over a frequency range of 100 mHz to 100 kHz with amplitude of 10 mV.
3.RESULTS AND DISCUSSION
5h
10h
15h
20 40 60 80 100 120
[image:3.596.157.443.90.310.2](53 1 ) (44 0 ) (51 1 ) (33 1 ) (22 2 ) (40 0 ) (31 1 ) Intensity( a.u.) 20h 2(Degree) (11 1 )
Figure 1. XRD patterns of Li1.02Mn2O4 samples synthesized at different sintering times (5 h, 10 h, 15 h, and 20 h).
20 40 60 2 80 100 120
Ycal Yobs Y
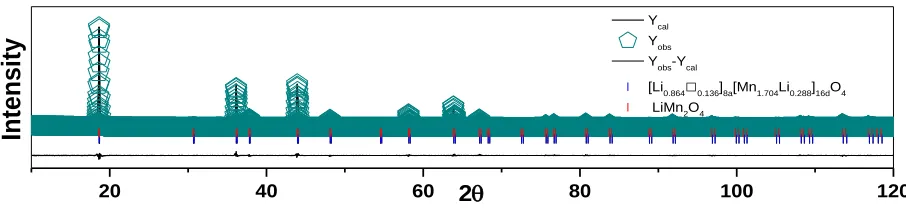
obs-Ycal [Li
0.864□0.136]8a[Mn1.704Li0.288]16dO4 LiMn2O4
Intensity
Figure 2. Rietveld refinement of XRD patterns of Li1.02Mn2O4 sample synthesized for 5 h.
Table 1. The structural parameters determined for the Li1.02Mn2O4 materials synthesized at different sintering times (5 h, 10 h, 15 h, and 20 h) from the refinement of the XRD data. (Li2Mn3O7 is an abbreviated form of [Li0.864□0.136]8a[Mn1.704Li0.288]16dO4)(The data of 10h sample has been published in previous paper [8])
5h 10h 15h 20h
LiMn2O4 Li2Mn3O7 LiMn2O4 Li2Mn3O7 LiMn2O4 Li2Mn3O7 LiMn2O4 Li2Mn3O7
Lattice constants
a(Å) 8.23952(7) 8.2333(5) 8.24489(7) 8.2384(5) 8.23773(7) 8.2310(5) 8.23963(8) 8.2346(6) Cell volume
(Å3)
559.378(0.0 08) 558.104(0.05 9) 560.472(0.0 08) 559.158(0.06 5) 559.015(0.00 8) 557.644( 0.061) 559.401( 0.009) 558.375(0.06 5) Structure parameters
Rp 7.85 7.10 8.04 8.65
Rwp 11.9 10.2 12.2 12.5
Li8a
[image:3.596.75.528.380.485.2]
Z 0.12500(0) 0.12500(0) 0.12500(0) 0.12500(0) 0.12500(0) 0.12500(0) 0.12500(0) 0.12500(0) B 0.019(204) 0.500(0) 0.361(194) 0.500(0) 0.234(223) 0.500(0) 0.198(249) 0.500(0) SOF 1.00000(0) 0.86414(0) 1.00000(0) 0.86414(0) 1.00000(0) 0.86414(0) 1.00000(0) 0.86414(0)
Mn16d
X 0.50000(0) 0.50000(0) 0.50000(0) 0.50000(0) 0.50000(0) 0.50000(0) 0.50000(0) 0.50000(0) Y 0.50000(0) 0.50000(0) 0.50000(0) 0.50000(0) 0.50000(0) 0.50000(0) 0.50000(0) 0.50000(0) Z 0.50000(0) 0.50000(0) 0.50000(0) 0.50000(0) 0.50000(0) 0.50000(0) 0.50000(0) 0.50000( 0) B 0.372( 17) 0.500(0) 0.387(15) 0.500(0) 0.399(18) 0.500(0) 0.388(21) 0.500(0) SOF 1.0000(0) 0.85214(0) 1.0000(0) 0.85214(0) 1.0000(0) 0.85214(0) 1.0000(0) 0.85214(0)
Li16d
X 0.50000(0) 0.50000(0) 0.50000(0) 0.50000(0) Y 0.50000(0) 0.50000(0) 0.50000(0) 0.50000(0) Z 0.50000(0) 0.50000(0) 0.50000(0) 0.50000(0)
B 0.500(0) 0.500(0) 0.500(0) 0.500(0)
SOF 0.14402(0) 0.14402(0) 0.14402(0) 0.14402(0)
O32e
X 0.26155(16) 0.26672(201) 0.26159(15) 0.27836(270) 0.26174(17) 0.27685(264) 0.26158(18) 0.27072(245)
Y 0.26155(16) 0.26672(201) 0.26159(15) 0.27836(270) 0.26174(17) 0.27685(264) 0.26158(18) 0.27072(245)
Z 0.26155(16) 0.26672(201) 0.26159(15) 0.27836(270) 0.26174(17) 0.27685(264) 0.26158(18) 0.27072(245) B 0.963(50) 0.500(0) 1.131(45) 0.500(0) 0.959(52) 0.500(0) 0.973(57) 0.500(0) SOF 1.00000(0) 1.00000(0) 1.00000(0) 1.00000(0) 1.00000(0) 1.00000(0) 1.00000(0) 1.00000(0)
[image:4.596.196.401.432.729.2]
The structural parameters of the Li1.02Mn2O4 materials synthesized at different sintering times determined from the refinement of the XRD data are given in Table 1, which indicates that [Li0.864□0.136]8a[Mn1.704Li0.288]16dO4 exists in all four Li1.02Mn2O4 samples. Rietveld refinement of XRD patterns of Li1.02Mn2O4 sample synthesized for 5 h is given in Fig. 2, and different colors indicate the two phases in the Li1.02Mn2O4 sample.
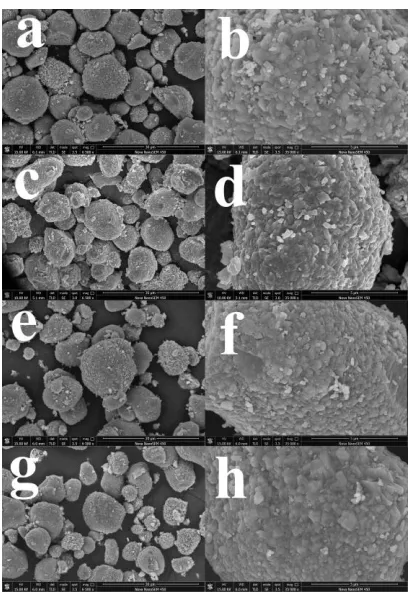
The morphologies and microstructures of the four Li1.02Mn2O4 samples were investigated using SEM (Fig. 3). Under high magnification, it was observed that particles were composed of nano-polyhedrons with well-defined edges and planes, and that these nano-polyhedrons have grown together on the plane. Similar morphologies and particle sizes were shown by SEM images for all samples, reflecting that synthesis time did not affect the morphology of LiMn2O4 materials.
648 646 644 642 640 638 636 634 632
Binding Energy(eV)
5h
648 646 644 642 640 638 636 634 632
10h
Binding Energy(eV)
648 646 644 642 640 638 636 634 632
15h
In
tensity(a.
u.
)
In
tensity(a.
u.
)
In
tensity(a.
u.
)
In
tensity(a.
u.
)
Binding Energy(eV)
648 646 644 642 640 638 636 634 632
20h
Binding Energy(eV)
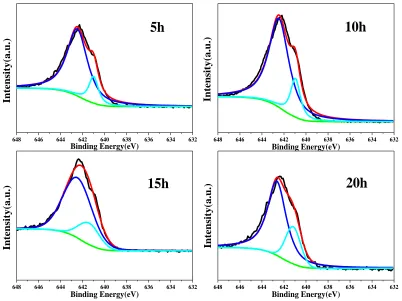
Figure 4. Deconvoluted profile of specific Mn 2p3/2 XPS spectra of Li1.02Mn2O4 samples synthesized at different sintering times (5 h, 10 h, 15 h, and 20 h).
[image:5.596.109.511.274.575.2][image:6.596.38.562.180.270.2]
the average valence of Mn changed from 3.8432 to 3.7752 (Table 2). [Li0.864□0.136]8a[Mn1.704Li0.288]16dO4 suppressed the formation of a surface passivation film between the cathode material and the electrolyte, thereby improving the electrochemical performance.
Table 2. Binding energy, cation distribution, and average valence of Mn from XPS (Mn-2p3/2 spectra) of Li1.02Mn2O4 samples.
Sample Binding energy(eV) Cation distribution Average valence
Mn4+ Mn3+ Mn4+ (%) Mn3+ (%) Mn
5h 642.482 641.002 84.32 15.68 3.8432
10h 642.460 640.956 82.42 17.58 3.8242
15h 642.462 641.425 80.23 19.77 3.8023
20h 642.640 641.170 77.52 22.48 3.7752
5 10 15 20
76 77 78 79 80 81 82 83 84 85 86
Content of
Mn
4+
(%)
Sinter time(h)
Figure 5. The Mn4+ content of Li1.02Mn2O4 samples synthesized at different sintering times (5 h, 10 h, 15 h, and 20 h).
[image:6.596.148.429.312.531.2]
0 20 40 60 80 100 120 140 160
3.0 3.2 3.4 3.6 3.8 4.0 4.2 4.4
Voltage(V)
Specific Capacity(mAh/g) 5h
10h
15h
20h
Figure 6. The charge-discharge curves of Li1.02Mn2O4 samples synthesized at different sintering times (5 h, 10 h, 15 h, and 20 h) between 3.0 V to 4.3 V at a rate of 0.1 C.
0 5 10 15 20
60 70 80 90 100 110 120 130 140 150
1C
0.5C 0.2C
Disc
harge Capacity(m
Ah/g)
Cycle Number
5h
10h
15h 20h 0.1C
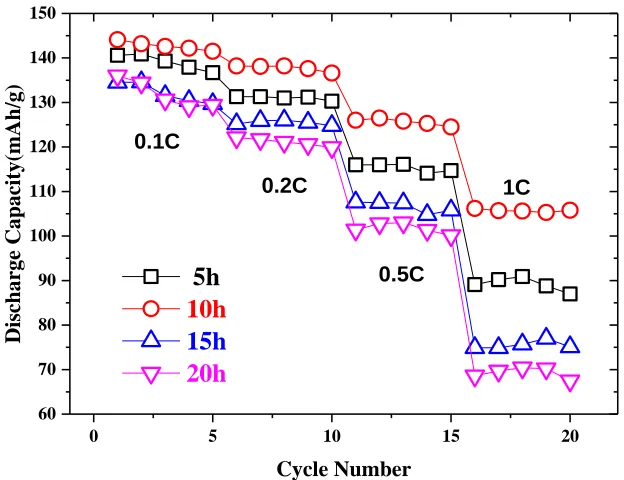
Figure 7. Rate capability of Li1.02Mn2O4 samples synthesized at different sintering times (5 h, 10 h, 15 h, and 20 h) at 25 oC.
[image:7.596.146.434.96.312.2] [image:7.596.134.446.396.636.2]
increase in current rate due to the enhancement of cell polarization [17]. The results indicated that Li1.02Mn2O4 sample synthesized for 10 hours has the best rate capability of 144.1 mAh/g, 138.2 mAh/g, 126 mAh/g, and 106.2 mAh/g at rates of 0.1, 0.2, 0.5 and 1 C, respectively. The results indicated that the discharge capacity of Li1.02Mn2O4 samples increased from 89.1 mAh/g to 106.2 mAh/g and then decreased from 106.2 mAh/g to 68.6 mAh/g at a rate of 1 C as the synthesis time increased from 5 h to 20 h. The results show that the rate capability of the LiMn2O4 samples decreases as the synthesis time increases from 5 h to 20 h (Fig. 7) due to the decrease in [Li0.864□0.136]8a[Mn1.704Li0.288]16dO4 content. The Mn4+ content is the highest when the synthesis time is 5 h, which indicates that the [Li0.864□0.136]8a[Mn1.704Li0.288]16dO4 content in the 5 h sample is the highest, but the rate capability of 5 h sample is poor. Because the [Li0.864□0.136]8a[Mn1.704Li0.288]16dO4 has a high lithium content, the main phase is lithium deficient, and this results in poor rate performance.
0 100 200 300 400 500 600
0 100 200 300 400 500
W CPE2 CPE1 R
e
Rct Rsf
-Z''(
ohm
)
Z'(ohm)
5h
10h 15h 20h
Figure 8. Electrochemical impedance spectroscopy of Li1.02Mn2O4 samples synthesized at different sintering times (5 h, 10 h, 15 h, and 20 h) with an amplitude of 10 mV.
0.4 0.6 0.8 1.0 1.2 1.4 200
250 300 350 400 450 500 550 600 650 700
Z'(Oh
m)
(
s0.5)
5h
10h
15h
20h
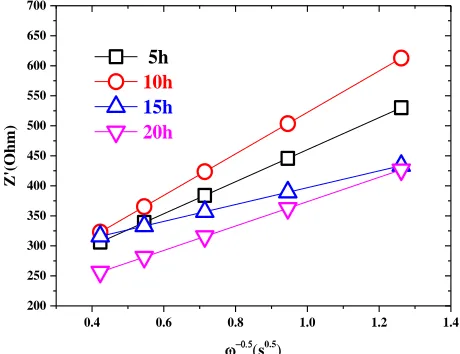
Figure 9. Z' vs. ω-0.5
[image:8.596.174.407.297.491.2] [image:8.596.177.407.554.731.2]
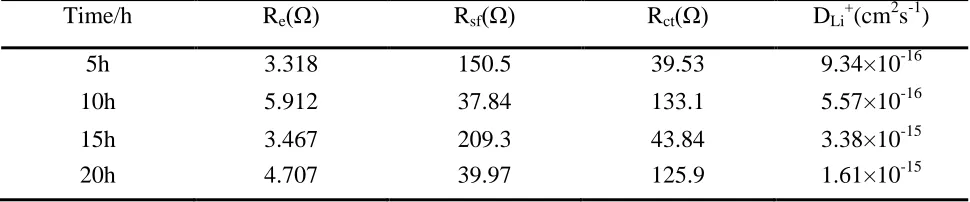
Table 3. Re, Rsf, Rct, and DLi+ for Li1.02Mn2O4 samples synthesized at different sintering times (5 h, 10 h, 15 h, and 20 h).
Time/h Re(Ω) Rsf(Ω) Rct(Ω) DLi+(cm2s-1)
5h 3.318 150.5 39.53 9.34×10⁻¹⁶
10h 5.912 37.84 133.1 5.57×10⁻¹⁶
15h 3.467 209.3 43.84 3.38×10⁻¹⁵
20h 4.707 39.97 125.9 1.61×10⁻¹⁵
Figure 8 displays the Nyquist plots of Li1.02Mn2O4 samples synthesized at different sintering times after 5 cycles at a rate of 0.1 C in a fully discharged state. The equivalent circuit is also shown in the inset of Fig. 8. The diffusion coefficient DLi+ is calculated according to the following equation [18-20]:
DLi+= 2 4 4 2 2 2 2
σ c F n A 2
T R
where R is the gas constant (8.314 J mol-1K-1), T is the temperature (298.15 K), A is the surface area of the electrode, n is the number of shifted electrons, F is the Faraday constant (96,500 C mol-1), c is the molar concentration of lithium ions, and the plot slope of Z' vs. ω−0.5 gives σ, the Warburg coefficient [21-23]. The plot of the real part of the impedance Z' vs. ω−0.5 in the low-frequency region for the Li1.02Mn2O4 samples synthesized for different time periods is displayed in Fig. 9. The Re, Rsf, and Rct values simulated by Zsimpwin software for LiMn2O4 samples are listed in Table 3. The results showed that the sample synthesized for 15 h had the largest Rsf value of 209.3 Ω, while the sample synthesized over 10 h had the largest Rct value of 133.1 Ω. In addition, the sample synthesized over 15 h had the largest DLi+ value of 3.38×10⁻¹⁵.
4. CONCLUSIONS
As the synthesis time increases from 5 h to 20 h, the Mn4+ content decreases from 84.32% to 77.52%. The rate capability of the Li1.02Mn2O4 samples increase initially and then decrease as the synthesis time increases from 5 h to 20 h. The refinement result shows that there is the [Li0.864□0.136]8a[Mn1.704Li0.288]16dO4 in the Li1.02Mn2O4 samples synthesized at different sintering times (5 h, 10 h, 15 h, and 20 h). Our results demonstrate the relationship between Mn4+ content and the rate capability of the Li1.02Mn2O4 cathode materials.
ACKNOWLEDGEMENTS
References
1. L. He, S.C. Zhang, X. Wei, Z.J. Du, G.R. Liu and Y.L. Xing, J. Power Sources, 220 (2012) 228. 2. D. Zhan, F. Yang, Q.G. Zhang, X.H. Hua and T.Y. Peng, Electrochim. Acta, 129 (2014) 364. 3. O.K. Park, Y. Cho, S. Lee, H.C. Yoo, H.K. Song and J. Cho, Energ. Environ. Sci, 4 (2011) 1621. 4. X.Y. Qiu, Q.C. Zhuang, Q.Q. Zhang, R. Cao, P.Z. Ying, Y.H. Qiang and S.G. Sun, Phys. Chem.
Chem. Phys., 14 (2012) 2617.
5. H.J. Noh, S. Youn, C.S. Yoon and Y.K. Sun, J. Power Sources, 233 (2013) 121.
6. H.B. Liu, C. Miao, Y. Meng, Q. Xu, X.H. Zhang and Z.Y. Tang, Electrochim. Acta, 135 (2014) 311.
7. G.G. Amatucci, C.N. Schmutz, A. Blyr, C. Sigala, A.S. Gozdz, D. Larcher and J.M. Tarascon, J. Power Sources, 69 (1997) 11.
8. Y. Fu, Y.J. Gu, Y.B. Chen, H.Q. Liu and H.H. Zhou, Solid State Ionics, 320 (2018) 16. 9. T. Ohzuku, J. Kato, K. Sawai and T. Hirai, J. Electrochem. Soc., 138 (1991) 2556. 10. D.H. Jang, Y.J. Shin and S.M. Oh, J. Electrochem. Soc., 143 (1996) 2204.
11. A.D. Kock, E. Ferg and R.J. Gummow, J. Power Sources, 70 (1998) 247.
12. J. Morales, L. Sanchez and J.L. Tirado, J. Solid State Electrochem., 2 (1998) 420.
13. Z.L. Xu, J.B. Wang, X.J. Quan, S.J. Hu and Q.G. Wu, J. Power Sources, 248 (2014) 1201. 14. K. Oikawa, T. Kamiyama, F. Izumi, B.C. Chakoumakos and H. Ikuta, Solid State Ionics, 109
(1998) 35.
15. M.M. Thackeray, A.D. Kock and W. David, J. Materials Research Bulletin, 28 (1993) 1041. 16. H.Y. Zhao, F. Li, X.Q. Liu, C. Cheng and Z. Zhang, Electrochim. Acta, 151 (2015) 263. 17. C.H. Zheng, X. Liu, Z.F. Wu, Z.D. Chen and D.L. Fang, Electrochim. Acta, 111 (2013) 192. 18. J.S. Gnanaraj, V.G. Pol, A. Gedanken and D. Aurbach, J. Electrochem. Commun., 5 (2003) 940. 19. J. Fan and P.S. Fedkiw, J. Power Sources, 72 (1998) 165.
20. Y.L. Ma, Y.Z. Gao, P. J. Zuo, X.Q. Cheng and G.P. Yin, Int. J. Electrochem. Sci., 7 (2012) 11001. 21. Y. Huang, F.M. Jin, F.J. Chen and L. Chen, J. Power Sources, 256 (2014) 1.
22. Z.Q. Huo, Y.T. Cui, D. Wang, Y. Dong and L. Chen, J. Power Sources, 245 (2014) 331. 23. Y. Cui, X.L. Zhao and R.S. Guo, Electrochim. Acta, 55 (2010) 922.