Int. J. Electrochem. Sci., 13 (2018) 8970 – 8982, doi: 10.20964/2018.09.65
International Journal of
ELECTROCHEMICAL
SCIENCE
www.electrochemsci.orgEffect of Extrusion Texture on Corrosion Behaviour of D16T
Drill Pipe in 3.5% NaCl Solution
Xiaohong Wang*, Zhengwei Peng, Shiyu Zhong, Guorong Wang, Qiaogang Hu andYuanhua Lin** School of Materials Science and Engineering, Southwest Petroleum University, Chengdu 610500, China
*
E-mail: [email protected]
**
E-mail: [email protected]
Received: 23 May 2018 / Accepted: 7 July 2018 / Published: 5 August 2018
The role of texture in the initiation and expansion of corrosion pits for a D16T aluminium drilling pipe in 3.5% NaCl solution was investigated by immersion and electrochemical tests. The results revealed that the surface parallel to the extrusion direction has typical brass {110} <112> and copper {112} <111> grain orientations, and the surface perpendicular to the extrusion direction has typical {112} <110>, {111} <112> and {001} <100> grain orientations. The <211> orientation grain and sub-grain/deformed grain were found to be responsible for the initiation of circular corrosion pits. Furthermore, the surface parallel to the extrusion direction presents a better corrosion resistance and pitting resistance than the surface perpendicular to the extrusion direction in 3.5% NaCl solution.
Keywords: aluminium alloy drill pipe, extrusion texture, corrosion behaviour, Pitting density
1. INTRODUCTION
dispersion to {011} <511> for the body of the drilling pipe [3]. It has been reported that the strong crystallographic texture not only results in significant in-plane anisotropy of the drilling pipe mechanical properties but also affects its phase precipitation [4] and electrochemical properties [5].
The evolution of texture during processing [6], the effects of crystallographic texture on the mechanical properties of the aluminium alloys [7,8] and of intermetallic inclusions on corrosion resistance [9] were discussed in a number of reports. However, the effect of crystallographic texture on the corrosion behaviour of aluminium drilling pipe is not yet fully understood.
Thus, based on the fact that aluminium alloy for drilling pipes have poor corrosion resistance in medium containing Cl- [10-12] and studies on the relationship between extrusion texture and local corrosion of D16T aluminium drilling pipe in NaCl solution are still very rare, there is a need for further research in order to provide theoretical guidance for improving the local corrosion resistance of aluminium drilling pipes by adjusting its crystallographic texture. Therefore, the aim of this study is to investigate the relationship between crystallographic texture and the corrosion behaviour of D16T aluminium drilling pipe in NaCl solution by means of monitoring the initiation and propagation process of pits on D16T with different crystallographic textures during immersion tests and microscopic observation after immersing for 4 hours in a 3.5% NaCl solution.
2. EXPERIMENTAL 2.1 Materials
The material used in this experiment was D16T aluminium alloy, which was taken from the body section of drilling pipes manufactured by the extrusion process. The chemical compositions are shown in Table 1.
Table 1. The composition of D16T aluminium alloy (wt.%).
Material Mg Zn Cu Mn Fe Si Al
D16T 1.6081 0.0787 4.6132 0.6432 0.1890 0.1725 Balance
2.2 Methods
2.2.1 Sampling Method
Int. J. Electrochem. Sci., Vol. 13, 2018
8972
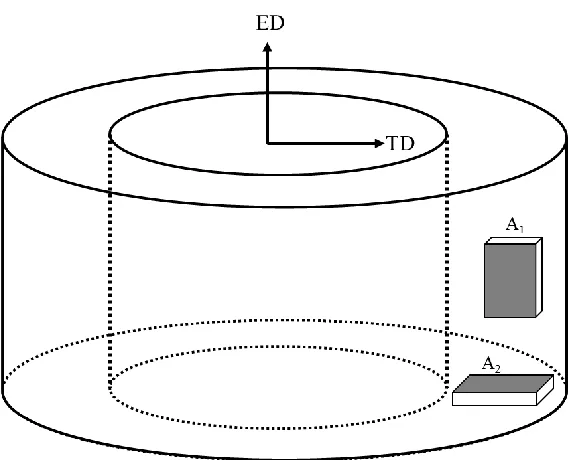
Figure 1. Sample reference system in the drilling pipes.
2.2.2 Texture Characterization
The macrotexture was studied by X-ray diffraction (XRD). XRD patterns of A1 specimen (20 mm×10 mm×3 mm) and A2 specimen (20 mm×10 mm×3 mm) were obtained on a Rigaku D/Max 2500PC (Japan) diffractometer with copper radiation. The scans covered 2θ angles from 10° to 146° with a rated power of 18 kW and a scanning step size of 0.001°. Texture was studied using pole figures and inverse pole figures methods.
The micro-zone textures of A1 and A2 were studied by electron back-scattered diffraction (EBSD). The EBSD scans were conducted on the surface of the samples in a JSM-7800F field emission gun SEM equipped with an HKL Technology Channel 5 EBSD detector. Two areas (600 μm × 600 μm) on the surface of the samples were marked by a Vickers hardness tester. The marked samples were prepared for EBSD measurement by mechanical polishing on 2000-grit SiC paper, followed by electro-polishing with a mixture of 10 mL perchloric acid and 90 mL ethyl alcohol at 20 V for 25 seconds. The samples were tested with a step size of 1.5 μm for the A1 specimen and a step size of 0.6 μm for the A2 specimen, operating at an accelerating voltage of 20 kV. The scan area of the A2 specimen was 170 μm ×160 μm, while a larger scan area of approximately 460 μm × 420 μm was selected for the A1 specimen in order to achieve good statistical data due to the presence of long coarser grains.
2.2.3 Electrochemical Measurements
[image:3.596.156.440.70.300.2]
largest surfaces of the A1 and A2 specimens were exposed to an area of 10 mm2 on the working electrode. A platinum electrode and a calomel electrode were used as the auxiliary electrode and reference electrode, respectively. All the experiments were carried out in a neutral 3.5% NaCl solution with a constant temperature of 30℃. The experiments for potentiodynamic polarization were carried out at a scan rate of 1 mV/s from -1200 mV to -300 mV. The experiments for EIS were performed at corrosion potential with an AC voltage amplitude of +10 mV in the frequency range from 1000000 Hz to 0.01 Hz.
2.2.4 Pitting Corrosion Experiments
The pitting corrosion behaviours of the A1 and A2 specimens were evaluated by immersing the samples that had been textured by EBSD in 3.5 wt.% NaCl solution at 30℃ for 240 minutes. The morphologies and pitting densities of the pitting corrosion sample surfaces that had been textured were examined using an XJG-05 optical microscope (OM) after immersing for 5 minutes, 30 minutes, 60 minutes, 120 minutes and 240 minutes. The microstructures and corroded surfaces of the pitting corrosion samples after immersing for 240 minutes were also analysed using a TESCAN VEGA II scanning electron microscope (SEM) with an Oxford INCA Energy 350 energy dispersive X-ray spectrometer (EDS). The pit depth was tested by a VHX-6000 3D microscope.
3. RESULTS AND DISCUSSION 3.1 Microstructure
3.1.1 Macrotexture
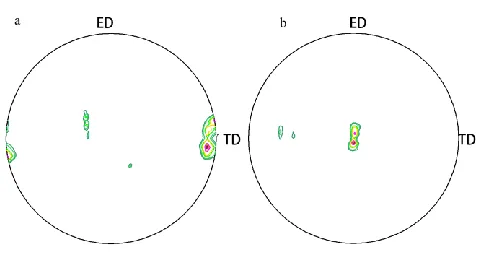
The {111} XRD pole figures of the A1 and A2 specimens are presented in Fig. 2. The inverse pole figures from the A1 and A2 specimens are shown in Fig. 3. The texture components of A1 consist of brass {110} <112> and copper {112} <111>, while the texture components of A2 consist mainly of {112} <110>, {111} <112> and {001} <100>. Such texture has also been reported previously for other types of rolled aluminium alloys [13-14].
[image:4.596.178.421.603.730.2]Int. J. Electrochem. Sci., Vol. 13, 2018
8974
Figure 3. Inverse pole figures from the A1 specimen (a) and the A2 specimen (b).
3.1.2 Grain size and Crystal Orientation
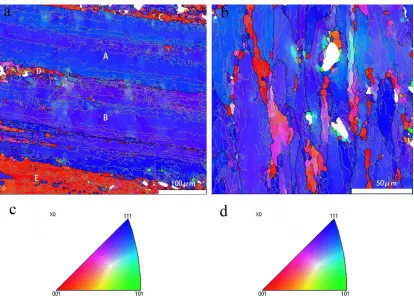
Figure 4. Typical grain boundaries and crystal orientation of the A1 and A2 specimens. (a) EBSD map of the A1 specimen, (b) EBSD map of the A2 specimen, (c) legend of the A1 specimen EBSD map, and (d) legend of the A2 specimen EBSD map.
[image:5.596.96.500.68.253.2] [image:5.596.96.510.334.633.2]
a small amount of fine recrystallized grains (C, D and E), as shown in Fig. 4a. The surface micrographs perpendicular to the extrusion direction show more uniform grain size than the surface micrographs parallel to the extrusion direction, as shown in Fig. 4b. The large elongated grains and fine recrystallized grains are difficult to find in Fig. 4b. The maximum grain size of the surface parallel to the extrusion direction is over 200 μm, and the average grain size is approximately 8 μm. The maximum grain size of the surface perpendicular to the extrusion direction is less than 60 μm, and the average grain size is approximately 6 μm. These results agree with those of Mierzynski in that the cold-formed D16T has different microstructures in two mutually perpendicular planes [15].
Fig. 4 also shows the crystal orientations of the surface parallel to the extrusion direction and the surface perpendicular to the extrusion direction. The surface parallel to the extrusion direction includes many <111> bands and few <001> and <211> bands, while the transverse specimen shows evenly distributed <111> and <001> and few <101> and <211> grains.
3.1.3 Grain and Sub-grain
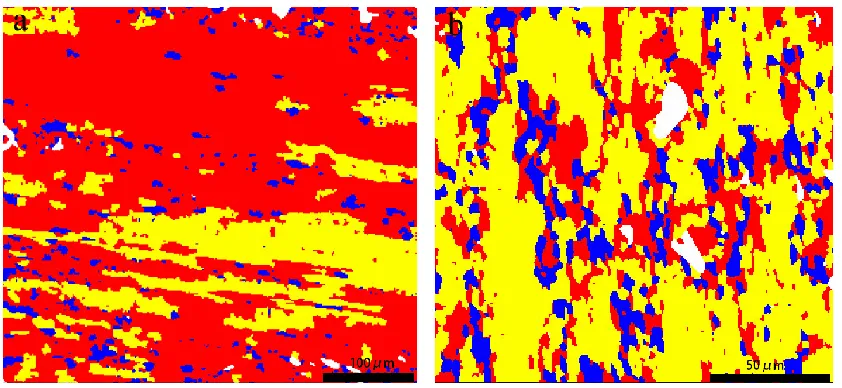
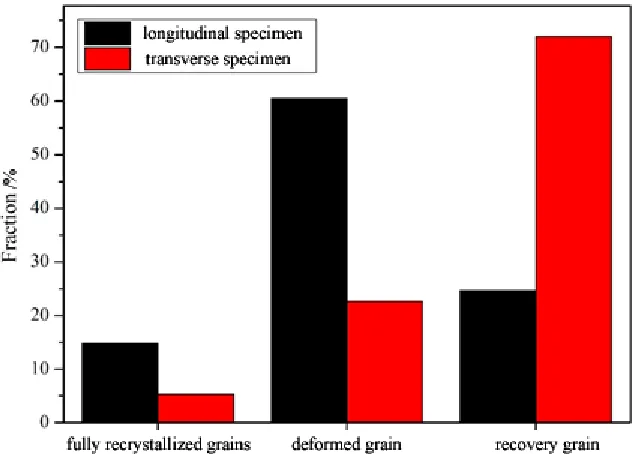
[image:6.596.89.510.524.718.2]Fig. 5 shows the recrystallized distributions of the A1 and A2 specimens. The A1 specimen contains 14.81% fully recrystallized grains (blue colour in Fig. 5a), 60.51% deformed grain (red colour in Fig. 5a) and 24.68% sub-grain (yellow colour in Fig. 5a), while the A2 specimen contains 5.35% fully recrystallized grains (blue colour in Fig. 5b), 22.64% deformed grain (red colour in Fig. 5b) and 72.00% sub-grain grain (yellow colour in Fig. 5b), as shown in Fig. 6. The fully recrystallized grains of the A1 specimen are sporadically distributed in the deformed regions along the extrusion direction, while the fully recrystallized grains of the A2 specimen are evenly distributed in the deformed regions. According to the D16T drill pipe extrusion process, there is more deformation along the extrusion direction than perpendicular to the extrusion direction [16]. Therefore, these results agree with the forming process in that A2 has more sub-grain but A1 has more deformed grain.
Int. J. Electrochem. Sci., Vol. 13, 2018
8976
Figure 6. The fractions of three kinds of grain of the longitudinal specimen (A1) and the transverse specimen (A2).
Grain boundary fractions calculated based on the average length of the boundaries are given in Table 1. Low-, medium-, and high-angle grain boundaries are defined as those having misorientations of 1-5 deg, 5-15 deg, and greater than 15 deg, respectively. The relatively lower fractions of medium-angle and high-medium-angle grain boundaries are observed for the A1 specimen and the A2 specimen, respectively.
Table 1. Number Fraction and the Types of Grain Boundary Misorientations Observed of the D16T Sample.
Misorientation Number Fraction
A1 specimen A2 specimen
1-5 deg 0.69 0.58
5-15 deg 0.17 0.20
15-65 deg 0.14 0.22
3.3 Electrochemical Behaviour 3.3.1 Polarization curve
[image:7.596.136.453.72.299.2] [image:7.596.111.484.526.597.2]
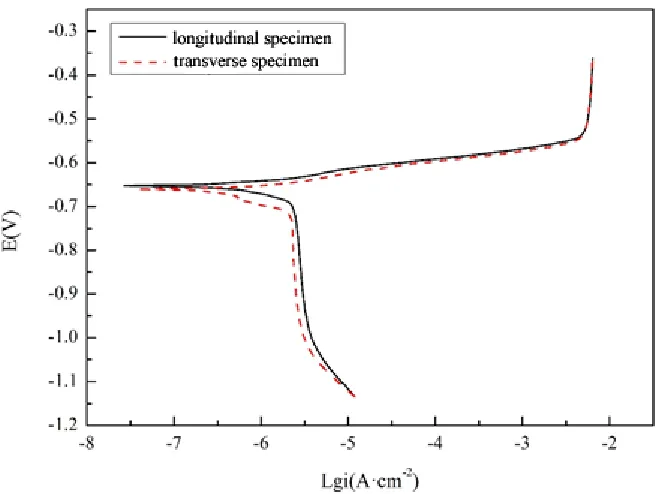
density of the A2 sample, which is 2.83 μA/cm2, revealing different practical corrosion rates. Accordingly, from the electrochemical point of view, the A1 sample has a slightly superior corrosion behaviour than the A2 sample due to their different crystallographic textures.
According to the research of Yasuda, the Epitting of Al single crystals with {001} is 39 mV more than Al single crystals with {111} [17]. The difference in Ecorr and Icorr between the A1 and A2 samples was a result of their different crystal orientations: the surface parallel to the extrusion direction has typical brass {110} <112> and copper {112} <111> grain orientations, and the surface perpendicular to the extrusion direction has typical {112} <110>, {111} <112> and {001} <100> grain orientations. The detailed mechanism of crystal orientation on the Ecorr of Al is not very clear yet.
[image:8.596.132.463.239.486.2]Figure 7. Polarization curves of the longitudinal specimen (A1) and the transverse specimen (A2) in 3.5% NaCl solution.
Table 2. Polarization parameters for the longitudinal specimen (A1) and the transverse specimen (A2) in 3.5% NaCl solution.
Ecorr /(V) Icorr /(μA·cm-2)
longitudinal specimen -0.664 2.46
transverse specimen -0.655 2.83
3.3.2 Electrochemical Impedance Spectroscopy
[image:8.596.108.487.602.647.2]Int. J. Electrochem. Sci., Vol. 13, 2018
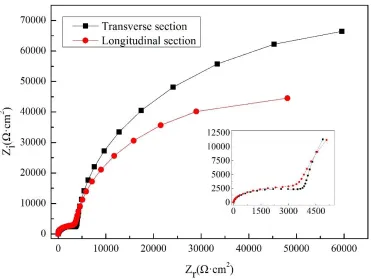
8978 consist of two connected imperfect semicircles. Furthermore, the semicircle with the smaller radius, which represent data at high frequency, corresponds to the original surface of D16T, and the semicircle with the larger radius, which represents data at low frequency, is associated with the newly generated surface of D16T [18]. It is known that the radius of the impedance arc reflects the rate of interfacial charge transfer. The charge transfer rate decreased with the increase of the impedance arc radius. As shown in Fig. 8, the radii of both samples at high frequency are the same, while the radius of the transverse specimen at low frequency is larger than that of the longitudinal specimen, which reveals that the newly generated surface of the transverse specimen has a better passivation behaviour than that of the longitudinal specimen. The conclusion is consistent with the results of the polarization curve.
Figure 8. Nyquist plots for the longitudinal specimen (A1) and the transverse specimen (A2) in 3.5% NaCl solution. The insert shows the magnification of the data in the high frequency region of the Nyquist plots.
3.4 Pitting Corrosion
3.4.1 Pitting initiation location
[image:9.596.98.469.273.552.2]
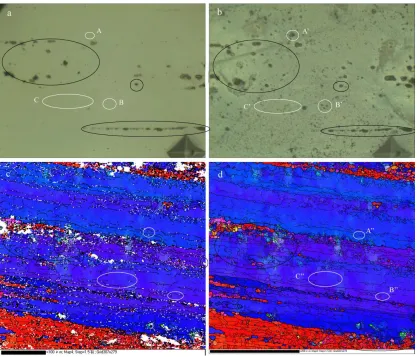
area were chosen for analysis: pit A’ was located at <111>, and pit B’ and etch area were both located at <211>.
Fig. 10 shows the locations of several corrosion pits of the A2 specimen. The black oval areas were used for positioning reference. The surface of the immersed sample has many tiny corrosion pits in the areas that did not have corrosion pits before being immersed. Three typical etch pits were chosen for analysis, etch pit A’, B’ and C’, which were all located at <211>.
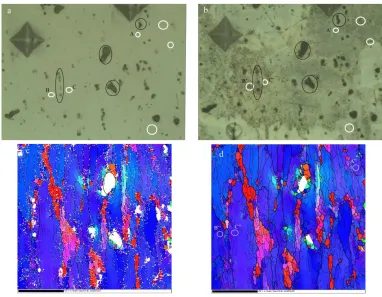
Figure 9. The locations of corrosion pit initiation of the A1 specimen (a) before being immersed and (b) after 4 hours of immersion; (c) EBSD map before noise reduction (d) EBSD map after noise reduction.
3.4.2 Pitting density
[image:10.596.91.508.204.561.2]Int. J. Electrochem. Sci., Vol. 13, 2018
8980 B.G. Prakashaiah [19] and J.V. S. Araujo [20]), those pits are also mainly located at the sub-grain or sub-grain/deformed grain area based on Fig. 5b. The density of the longitudinal specimen is lower than that of the A2 specimen, but the local pitting density of the longitudinal specimen is higher than that of the transverse specimen. According to the report of Y. Ma, the sub-grain has higher dislocation density and stored energy, and thus the T1 phase is easy to precipitate at the sub-grain/grain [21]. The corrosion potential of the T1 phase in 3.5 wt.% NaCl solution is -1096 mV [22], which is 346 mV more negative than that of the aluminium matrix (-750 mV) [23], and so the corrosion pits of A1 and A2 are on the sub-grain or sub-grain/deformed grain area.
Figure 10. The locations of corrosion pit initiation of the A2 specimen (a) before being immersed and (b) after 4 hours of immersion; (c) EBSD map before noise reduction (d) EBSD map after noise reduction.
[image:11.596.111.493.217.514.2] [image:11.596.101.499.599.730.2]
3.4.3 Pitting depth
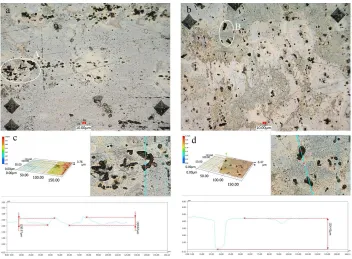
Fig. 12 shows representative surface images and the areas with the largest corrosion depth of the A1 specimen (Fig. 12a) and the A2 specimen (Fig. 12b) after 4 hours of immersion in 3.5% NaCl solution at room temperature. The corresponding maximum pitting depths are shown in Fig. 12c and Fig. 12d, respectively. As seen in the figure, the corresponding maximum pitting depth of the A1 specimen is 0.67 μm, which accounts for 15.19% of the corresponding maximum pitting depth of the A2 specimen.
Figure 12. The surface images and maximum pitting depths of the A1 and A2 specimens immersed for 4 hours in 3.5% NaCl solution: (a) the representative surface images of the A1 specimen, (b) the representative surface images of the A2 specimen, (c) the maximum pitting depth of the A1 specimen, and (d) the maximum pitting depth of the A2 specimen.
4. CONCLUSIONS
(1) For extruded D16T drill pipes, the surface parallel to the extrusion direction has typical brass {110} <112> and copper {112} <111> grain orientations, and the surface perpendicular to the extrusion direction has typical {112} <110>, {111} <112> and {001} <100> grain orientations.
(2) The surface parallel to the extrusion direction has lower corrosion current densities, higher impedance arc radius and lower pitting depth and density than those of the surface perpendicular to the extrusion direction.
[image:12.596.123.475.225.484.2]Int. J. Electrochem. Sci., Vol. 13, 2018
8982
ACKNOWLEDGEMENTS
This work was financially supported by the National Natural Science Foundation of China (Grant Nos.51775463) and the Open Fund Key Laboratory of Oil & Gas Field Material (X151517KCL51).
References
1. X.H. Wang, Z.W. Peng, L. Ma, Y.H. Lin, G.X. Li and H.L. Wang, Int. J. Electrochem. Sci., 12 (2017) 11006-11016
2. Anon, BS EN ISO 15546: 2011. Petroleum and natural gas industries-aluminum alloy drill pipe [S], Geneva: International Standards Organization, 2011
3. L.S. Kagan, V.I. Ivanova, G.M. Fain, I.A. Belyashova and S.Y. Klepachevskaya, Metal Sci. & Heat Treatment, 29 (1987) 142-145
4. E. Mostaed, M. Hashempour, A. Fabrizi, D. Dellasega, M. Bestetti, F. Bonollo and M. Vedani, ScienceDirect, 37 (2014) 307-322
5. M. Yasuda, F. Weinberg and D, Tromans, J. Electrochem. Soc., 137 (1990) 3708-3715
6. Z.Y. Yang, J. Zhang, X.B. Guo and P.F.Ji, Journal of Netshape Forming Engineering, 5 (2013) 1-6
7. Z.J. Wang, M. Ma, Z.X. Qiu, J.X. Zhang and W.C. Liu, Mater. Charact., 139 (2018) 269-278 8. X.H. Wang, Z.W. Peng, G.X. Li, Y.H. Lin and H.L. Wang, Mater. Sci. Forum, 913 (2018)
157-167
9. C. Blanc, B. Lavalle and G. Mankowski, Corros. Sci., 39 (1997) 495–510 10. V.S. Tikhonov, M.Y. Gelfgat, C.A. Cheatham and A.J. Adelman, APAJ.2010
11. S.W. Claraldl, D.R. Grlmes, H.F. Nichols and S.O. Moore, SPE Drilling Engineering, 5 (1990) 135-140
12. B.A. Tarr and I.A. Graham., OTC 5901, The 21st Annual OTC, Houston, Texas, 5 (1989) 1-4 13. M.B. Khashayer, N. Pooria, P. Mahmoud and S.Mohammadali, Corros. Sci., 138(2018)28-41 14. P.A. Hollinshead and T. Sheppard, Metall. Trans. A, 20A(1989) 1495-1507
15. J. Mierzynski and V. Hutsaylyuk, Int. J. Fatigue, 39 (2012) 54-60
16. X.H. Wang, S. Wang, Y.H. Lin, Y. Ye, H.L. Wang and Q. Chen. Journal of Plasticity Engineering, 24 (2017) 177-184
17. M.Yasuda, F.Weinberg, D.Tromans, J.Electrochem.Soc., 137(1990) 3708-3715
18. Y.C. Dun, X.H. Zhao, Y.M. Tang, S. Dino and Y. Zuo. Appl. Surf. Sci., 437 (2018) 152-160 19. B.G. Prakashaiah, D.V. Kumara, A.A. Pandith, A.N. Shetty and B.E.A. Rani, Corros. Sci., 136
(2018) 326-338
20. J.V.S. Araujo, U. Donatus, F.M. Queiroz., M. Terada, M. X. Milagre, M. C.. Alencar and I. Costa, Corros. Sci., 133 (2018) 132-140
21. Y. Ma, X. Zhou, Y. Liao, Y. Yi, H. Wu, Z. Wang and W. Huang, Corros. Sci., 107 (2016) 41-48 22. R.G. Buchheit, J. Electrochem. Soc, 142 (1995) 3994-3996