Int. J. Electrochem. Sci., 13 (2018) 675 – 689, doi: 10.20964/2018.01.54
International Journal of
ELECTROCHEMICAL
SCIENCE
www.electrochemsci.orgMicrobial Corrosion of 2205 Duplex Stainless Steel in
Oilfield-Produced Water
Wuqi Song, Xu Chen*, Chuan He, Xin Li, Chang Liu
School of Petroleum Engineering, Liaoning Shihua University, Fushun 113001, PR China
*
E-mail: cx0402@sina.com
Received: 7 September 2017 / Accepted: 27 October 2017 / Published: 16 December 2017
The microbial corrosion of 2205 duplex stainless steel in oilfield-produced water containing sulfate-reducing bacteria (SRB) was studied using scanning electron microscopy, energy-dispersive X-ray spectroscopy microanalysis, and electrochemical techniques. The results showed that SRB growth in the oilfield water injection system could be divided into four periods—viscous growth, logarithmic growth, stable growth, and decay phases—with SRB metabolism affecting the environmental parameters such as pH, conductivity, S2− concentration. During viscous and logarithmic SRB growth, SO42− was reduced to S2−, which combined with Fe2+ to accelerate the corrosion of the steel surface. In the stable growth phase, a protective biofilm was formed on the steel surface, hindering interfacial mass transfer and thereby delaying corrosion. In the decay period, the partial falling off of the microbial film and the degradation of deposited corrosion product and metabolite layers resulted in the formation of a corrosion galvanic cell, accelerating the corrosion process.
Keywords: 2205 DSS, oilfield-produced water, SRB corrosion, growth period, biofilm
1. INTRODUCTION
Sulfate-reducing bacteria (SRB) is one of the most destructive strains for MIC in anaerobic environments [7, 8]. Notably, Beech [9] found that FeS2 and FeS coexisted with SRB on the surface of steel immersed in seawater, which resulted in severe damage of the metal surface. Sosa et al. [10] have shown that two layers of corrosion products formed on the surface of carbon steel in natural seawater, with the outer layer, formed by the electrochemical deposition of biofilm or corrosion products, having a protective function, whereas the Fe2O3 film in the inner layer was porous and the erosive medium easy to pass through. Castaneda et al. [11] investigated the effect of SRB biofilms on carbon steel corrosion in simulated seawater, showing that the biofilms promoted corrosion due to being non-uniform and thus increasing the number of active sites for electrochemical corrosion.
Currently, research on SRB-induced corrosion is mainly focused on carbon steel and ordinary stainless steel, with the behavior of duplex stainless steel (DSS) being paid little attention. Due to exhibiting the excellent weldability and toughness of austenitic stainless steel and showing increased strength due to the presence of austenite (γ) and ferrite (α) phases in a suitable proportion [12, 13], DSS is increasingly used in petroleum, chemical, and other industries [14, 15]. Sun et al. [16] found that the main causes of pitting corrosion of 2507 DSS in circulating cooling water systems were the metabolic activities of SRB and iron oxidase (IOB) and the synergistic effect of Cl–. Zai et al. [17] investigated the corrosion behavior of 2507 DSS in SRB-containing cooling water, showing that the effect of SRB on corrosion could be ignored at concentrations below 1%. However, at an SRB concentration of 2%, the steel corrosion rate increased four-fold compared to that observed under SRB-free conditions. Antony [18-20] studied the effect of SRB on the corrosion of 2205 DSS in 3.5% NaCl, revealing that these microbes enhanced corrosion under all tested conditions. Liang et al. [21] studied the corrosion of 2205 DSS in SRB-containing marine environments, demonstrating that the corrosion potential of steel became more negative, and the corrosion resistance rapidly decreased with increasing anode current density.
At present, most of the research on SRB-induced corrosion is focused on cooling water and marine environments. However, the losses caused by SRB-induced corrosion in oilfield water injection systems are just as important due to their magnitude. Although Lverson [22] estimated that 77% of corrosion occurring in US production wells is caused by SRB, with the corresponding losses amounting to billions of dollars, the research on the effect of SRB metabolism on the corrosion behavior of DSS in oilfield water injection systems has rarely been reported. A number of studies have shown that the roughness and heterogeneity of SRB biofilm on steel surfaces increase with progressing SRB growth [23]. To contribute to a deeper understanding of DSS corrosion in microbe-containing environments, we have herein investigated the effect of SRB metabolism on the corrosion behavior of 2205 DSS in an oilfield water injection system by electrochemical techniques and microscopic observation.
2. EXPERIMENTAL METHODS
2.1. Materials
etched with aqua regia (37 wt% hydrochloric acid and 67 wt% nitric acid in a volume ratio of 3:1) showed the presence of ferrite (α) and austenite phases (
γ
) in a ratio of approximately 1:1 (Fig. 1, dark area = α , light-colored area =γ
).Figure 1. Metallographic microstructure of 2205 DSS.
[image:3.596.177.419.145.328.2]Specimens for immersion and electrochemical tests were machined to dimensions of 10 mm × 40 mm × 1 mm and 10 mm × 10 mm × 1 mm, respectively. The latter samples were welded with copper wire and sealed with epoxy resin to obtain a working area of 10 mm × 10 mm. The working surface was polished using 80-2000# emery paper and degreased with acetone and ethanol.
Table 1. Chemical composition of 2205 DSS (wt%).
C N Si Mn Cr Ni Mo S P Fe
0.02 0.16 0.68 1.2 22 5.42 3.03 0.002 0.018 balance
2.2. Solutions
The experimental solution, i.e., oilfield extract, contained 0.02 M KCl, 0.03 M NaHCO3, 27.6 × 10⁻⁴ M NaCl, 6.13 × 10⁻⁴ M CaCl2, 6.13 × 10⁻⁴ M MgCl2·6H2O, 22.2 × 10⁻⁴ M Na2CO3, and 0.33 × 10– 4
M Na2SO4 (pH 8.7). SRB were obtained by separation and purification of the oilfield effluent, being subsequently cultured in medium I (0.5 g/L K2HPO4, 0.5 g/L Na2SO4, 1 g/L NH4Cl, 0.1 g/L CaCl2, 2 g/L MgSO4·7H2O, 1 g/L yeast, and 3 mL sodium lactate(55%)) and medium II (0.1 g/L ascorbic acid, 0.1 g/L sodium hydrosulfite, and 0.1 g/L (NH4)2Fe(SO4)2·6H2O). The pH of medium I was adjusted to 7.2 with 4% NaOH, which was followed by 15-min sterilization in a pressure steam sterilizer at 121 °C, whereas medium II was sterilized using a cylindrical filter. Prior to the experiment, the experimental solution and equipment were subjected to 15-min high-pressure sterilization at 121 °C.
α
γ
Since SRB are anaerobic, sterilization was preceded by 60-min purging of the solution with nitrogen for deoxygenation. The above bacteria were inoculated in a 1:50 (v/v) mixture of the experimental solution and the culturing medium and incubated for different periods in a biochemical incubator at (30 ± 2) °C.
2.3. SRB growth cycle curve
The growth curve of SRB in oilfield-produced water was obtained using the optical density (OD) method. The SRB-containing oilfield solution was extracted, and the extract absorbance (Abs) was continuously measured for 14 days using UV-2550 spectrophotometer. Since the absorbance was approximately equal to the OD in the range of 0.15–1.0, the above values were used to construct a growth curve. If the measured OD values were outside of this range, the test sample was diluted 5–10-fold with the liquid medium to decrease the OD to suitable values, and the obtained result was multiplied by the dilution factor [24].
2.4. Effects of SRB growth on environmental parameters
An S220 multi-parameter tester was used to measure the pH and S2– concentration of the solution, whereas solution conductivity was monitored using a DDS-307 conductivity meter. The results of all experiments were averaged three times daily for 14 days.
2.5. Micro-corrosion morphology
Samples were immersed into an SRB-containing medium and incubated for 4, 7, 10, and 14 days. After incubation, the samples were fixed with 5% glutaraldehyde solution for 2 h and dehydrated in ethanol (30, 50, 80, and 100%) for 15 min to maintain biofilm integrity [25]. The surface biofilms and corrosion features of the thus obtained samples were examined using scanning electron microscopy (SEM, SU-8010) and energy-dispersive X-ray spectroscopy (EDS, Q500MW).
2.6. Electrochemical experiments
3. RESULTS
3.1. SRB growth curve
Figure 2 shows the growth curve of SRB in the oilfield extract, revealing that the growth process could be divided into four phases. The first phase, lasting from day 1 to day 4, corresponded to slow growth and was denoted as the viscous phase. During the second, or logarithmic, phase (days 4– 7), the number of active SRB rapidly increased. The third (stationary growth) phase was reached after day 7, with the number of SRB reaching its maximum on day 10. Finally, the last (decay) phase, corresponding to a rapid decrease of SRB, was reached after day 10.
0 2 4 6 8 10 12 14 16
0.1 0.2 0.3 0.4 0.5 0.6
OD
/
600nm
[image:5.596.183.412.243.422.2]Time/d
Figure 2. Growth curve of SRB in oilfield-produced water.
3.2. Effects of SRB growth on environmental parameters
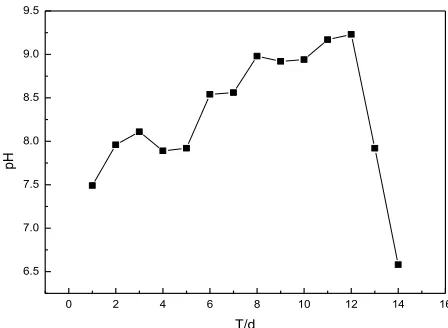
Figure 3 shows the variation of solution pH during SRB growth, revealing a slow pH increase from 7.49 to 8.11 during viscous growth followed by a sharp increase from 7.89 to 8.98 during logarithmic and stationary growth and a fast decrease to 6.58 with the onset of the decay phase.
0 2 4 6 8 10 12 14 16 6.5
7.0 7.5 8.0 8.5 9.0 9.5
pH
[image:5.596.185.409.574.738.2]T/d
The solution conductivity also varied with SRB growth (Fig. 4), increasing from 3630 to 4050 μS/cm during viscous growth and reaching its maximum of 4320μS/cm during logarithmic growth, finally declining in stable growth and decay phases.
0 2 4 6 8 10 12 14 16 3600
3800 4000 4200 4400 4600
μs/
cm
[image:6.596.183.415.139.312.2]T/d
Figure 4. Effect of SRB growth on solution conductivity of oilfield-produced water.
Figure 5 shows the effect of SRB growth on the concentration of S2–, revealing that this parameter increased from 12.8 to 52.5 g/L during viscous and logarithmic growth periods. During stationary SRB growth, the S2– concentration decreased to 0.58 g/L, remaining stable during the decline phase.
0 2 4 6 8 10 12 14 16 0
10 20 30 40 50 60
S
2- g
/L
[image:6.596.184.412.454.630.2]T/d
Figure 5. Effect of SRB growth on the concentration of S2– of oilfield-produced water.
3.3. SEM and EDS analyses
[image:7.596.131.466.181.436.2]
corrosion. However, no obvious corrosion pits were observed at day 10, with the corresponding SEM images clearly showing a microbial film attached to the steel surface. After 14 days, the corrosion pits re-emerged, and the biofilm disappeared. EDS analysis results indicated that corrosion products were mainly represented by oxides and sulfides. The maximum S content was reached on day 10 and subsequently declined.
[image:7.596.46.550.533.625.2]Figure 6. SEM images of 2205 DSS in oilfield-produced water for 4 (a), 7 (b), 10 (c), and 14 (d) days.
Table 2. EDS analysis results for 2205 DSS in oilfield-produced water for different immersion times (at%).
Time/days Fe Cr C O Mn S Ni
4 34.74 15.11 20.81 22.97 1.96 1.08 2.92
7 57.01 18.24 12.07 4.22 20.8 1.30 4.61
10 53.20 16.14 11.32 8.29 1.94 1.45 4.48
14 54.15 18.49 14.76 4.49 1.86 1.31 4.40
3.4. Electrochemical characterization 3.4.1. Eocp
The effects of SRB growth on the Eocpof 2205 DSS in oilfield-produced water are shown in Fig. 7, revealing that the above parameter exhibited a rapid initial decrease and reached a minimum of
25µm 5µm
–411 mV on day 9, subsequently becoming more positive and reaching –397 mV on day 12, after which it remained stable.
0 2 4 6 8 10 12 14 16 -420
-400 -380 -360 -340 -320
E/
mv
T/d
Figure 7. Effect of SRB growth on the Eocp of 2205 DSS in oilfield-produced water for different
immersion times.
3.4.2. EIS analysis
Figure 8 shows the effects of SRB growth on the results of EIS. A single capacitive impedance loop characteristics were seen in the Nyquist diagram, indicating that the corrosion process was controlled by electrochemical reactions. The size of the arc resistance is generally related to the corrosion resistance of the metal, with greater capacitive impedance loop radii reflecting better corrosion resistance. The largest radius of the above loop was observed on day 10, being minimal on day 7. Notably, the corresponding Bode diagram features three parts in the |Z|-logf curve. In Bode diagram, the low-frequency region corresponds to the sum of charge transfer and solution resistances, the middle-frequency region represents the sum of film and solution resistances, and the high-frequency region corresponds to the solution resistance of the reaction system [26]. As the solution resistance of the investigated system is negligible compared to its charge transfer resistance, the low-frequency region corresponds to the latter. The impedance modulus shows that at the low-low-frequency region decreased in the order according to stable growth period, decay period, viscous growth period, and logarithmic growth period of SRB, which implies a gradual decrease of polarization resistance. In the phase angle diagram, only one time constant was observed at all times except for day 10, indicating the existence of a dual structure on the metal surface at this point in time.
[image:8.596.185.415.123.302.2]
[27-29]. CPE1and CPE2 denote film and electric double layer capacitances, respectively. ZsimpWin software was used for data fitting, with the obtained results shown in Table 3.
0 4000 8000 12000 16000 20000
0 2000 4000 6000 8000 10000 12000 14000 16000 18000 20000 -Z' /( cm 2 )
Z''/(cm2)
4d 7d 10d 14d
(a)
0 500 1000 1500 2000 2500 3000 3500 4000 0 1000 2000 3000 4000 Z im g/ oh m Zre/ohm 0 1x10³ 2x10³ 3x10³ 4x10³ 5x10³ 6x10³ 7x10³
10-2 10-1 100 101 102 103 104 105
[image:9.596.173.425.117.488.2]0 10 20 30 40 50 60 70 80 z/o h m 4d 7d 10d 14d (b) 4d 7d 10d 14d Ph ase/d eg Frenquency/Hz
Figure 8. EIS results for 2205 DSS in oilfield-produced water for different immersion times: (a) Nyquist plots and (b) Bode plots.
[image:9.596.146.446.560.697.2]
Table 3. EIS fitting results of 2205 DSS in oilfield-produced water for different immersion times.
Time/days Rs/(Ω·cm2) CPE1/(F·cm–2) n1 Rf/(Ω·cm2) CPE2/(F·cm–2) n2 Rct/(Ω·cm2)
4 53.3 --- 0.9 --- 3.0 × 10⁻³ --- 2.8 × 10⁴
7 33.4 --- 0.9 --- 4.5 × 10⁻³ --- 2.0 × 10⁴
10 53.3 8.8 × 10⁻⁶ --- 1.7 × 10⁴ 4.0 × 10⁻⁴ 0.8 1.9 × 10⁵
14 65.8 --- 0.9 --- 2.0 × 10⁻³ --- 4.8 × 10⁴
Table 3 shows that the largest Rf and Rct were observed on day 10, suggesting the best corrosion resistance at this time point, whereas the smallest Rct was observed on day 7, indicating the occurrence of severe corrosion.
3.4.3 Polarization curves
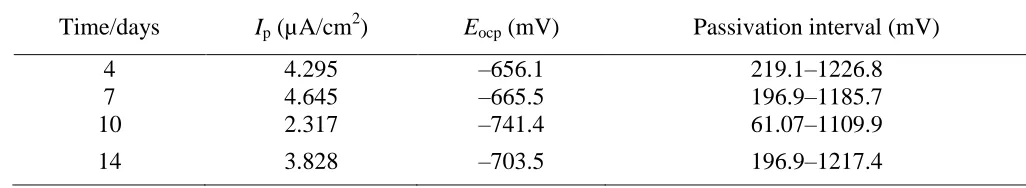
The polarization curves of 2205 DSS in oilfield-produced water and the corresponding fitting results are shown in Fig. 10 and Table 4, respectively, revealing that the passivation behavior was significantly time-dependent. Thus, the maximum current density of 4.645 μA/cm2 was observed on day 7, corresponding to the narrowest passivation interval (196.9–1185.7mV) and the worst corrosion resistance. The passivation current density was minimal on day 10 (2.317 μA/cm2
), corresponding to the widest passivation interval (61.07–1109.9 mV) and indicating only slight corrosion. The metabolism of SRB had almost no effect on the transpassive potential, with the current density rapidly increasing above the transpassive potential.
-7 -6 -5 -4 -3 -2 -1
-1.0 -0.5 0.0 0.5 1.0 1.5 2.0 2.5
E/
V
logi(A/cm2)
[image:10.596.143.451.467.711.2]4 d 7 d 10 d 14 d
Table 4. Polarization curve fitting results of 2205 DSS in oilfield-produced water for different immersion times.
Time/days Ip (µA/cm2) Eocp (mV) Passivation interval (mV)
4 4.295 –656.1 219.1–1226.8
7 4.645 –665.5 196.9–1185.7
10 2.317 –741.4 61.07–1109.9
14 3.828 –703.5 196.9–1217.4
4. DISCUSSION
4.1. Effect of SRB growth on environmental parameters
The above results showed that SRB metabolism can change the chemical properties of the medium. For instance, solution pH variation was consistent with the SRB growth curve, i.e., a small amount of SO42– was reduced to S2– during viscous growth, inducing a pH increase due to the hydrolysis of the latter metabolite [30]:
SO42– + 8H → S2– + 4H2O (1)
S2– + H2O → HS– + OH– (2)
The number of SRB sharply increased during logarithmic and stable growth periods, which was reflected in increased solution pH due to the additional consumption of H+ caused by the activity of hydrogenase involved in growth and reproduction, as shown below [30]:
H+ + e–Hydrogenase
H (3)
8H + SO42– SRB S2– + 4H2O (4)
2H+ + S2– → H2S (5)
During the decay phase, the pH gradually decreased due to nutrient depletion, metabolite deposition, and the increased content of low molecular weight organic acids [31].
The increase of solution conductivity during viscous and logarithmic growth phases was ascribed to the increasing number of SRB, which, however, did not significantly change during stable growth and thus did not induce changes in the ion concentration of the medium. Finally, the accumulation of metabolites was thought to cause the conductivity decrease in the decay stage [32].
The most important feature of SRB metabolism is the conversion of dissolved SO42– to S2–, which increases the amount of the latter ions in solution (Equation (1)). Figure 5 shows that the rapid multiplication of SRB during viscous and logarithmic growth led to an increased S2– concentration. Although the concentration of S2– continued to increase during stable growth, the sulfide ions were removed from the solution by the following reaction:
Fe2++ S2– → FeS↓ (6)
[image:11.596.38.551.113.207.2]
4.2. Effects of SRB growth on corrosion morphology
SEM imaging results showed that corrosion pits appeared on the sample surface on day 4, deepening on day 7. Moreover, microorganisms were observed on the DSS surface but no corrosion pit on day 10. On day 14, SEM imaging revealed the re-appearance of corrosion pits and the disappearance of the above microorganisms. This behavior was explained by the fact that during the viscous growth period, Cl–, SO42–, and other aggressive anions first reacted with the oxide film on the substrate surface. After the dissolution of this film, a large amount of SO42– was converted into S2– during logarithmic growth, with these sulfide ions subsequently reacting with the steel sample and promoting its dissolution. However, due to the large number of SRB present during stable growth phase, the steel surface was covered by a protective biofilm mainly composed of extracellular polymer (EPS) [33] that prevented mass transfer. During the decay stage, the initially compact biofilm became loose and was eventually delaminated [34], exposing the substrate to a solution containing a large amount of aggressive species and thus promoting corrosion.
4.3. Effects of SRB growth on the electrochemical behavior of 2205 DSS
The obtained polarization curves and EIS results show that the corrosion resistance of 2205 DSS during the viscous growth phase exceeded that during the logarithmic growth phase due to the small number and weak activity of SRB in the former period, wherein the steel surface did not directly contact the aggressive medium due to being covered by a passivation film.
During the logarithmic growth phase, Eocp rapidly decreased with time, which was ascribed to the reaction of SRB-produced sulfide ions with the oxide film on the surface of 2205 DSS [35]:
3H2S + 2FeO(OH) → 2FeS + S + 4H2O (7) Fe2O3 + H2S + 4H+ → 2Fe2+ + S + 3H2O (8)
In addition, iron oxides could also be dissolved as a result of bacterial hydrogenase activity [35]:
Fe2O3 + 6H+ + 2e–Hydrogenase
2Fe2+ + 3H2O (9)
When the oxide was dissolved, the remaining H2S continued to react with 2205 DSS, shifting Eocp to more negative values. The rapid increase in the number of SRB during logarithmic growth resulted in the generation of a large amount of S2– that continuously reacted with the oxide film on the steel surface to produce FeS and thus promote cathodic depolarization. The obtained polarization curves show that compared to the viscous growth phase, the logarithmic growth phase featured an increased corrosion current density and a narrowed passivation interval, which indicates that the metabolic activity of SRB promoted corrosion.
38]. The corresponding Bode plot shows the presence of only one peak in the low-frequency region except for the stable growth period. Miranda et al. found that the peak in the low-frequency region was generally related to the SRB biofilm formation [39]. Two time constants were observed during stable growth, represented biofilm and corrosion product films, respectively. Both of them exhibited a protective effect, with the biofilm acting as a barrier and impeding the transfer of chemical substances.
4.4. Effect of SRB metabolism on the corrosion mechanism of 2205 DSS
During SRB-induced MIC, SRB initially adhered to the steel surface, forming a continuous biofilm upon progressive growth. EPS, the main component of this film, favored its adhesion to various substances [40] while helping bacteria to obtain nutrients to maintain their growth and metabolism [41]. In the SRB-containing medium, the metabolic activity of these bacteria accelerated the corrosion process of 2205 DSS as follows:
Anodic reaction: 4Fe → 4Fe2+
+ 8e– (10)
Ionization reaction: 8H2O → 8H+ + 8OH– (11) Cathodic reaction: 8H+ + 8e–→ 8H (12) Cathodic depolarization reaction: SO42– + 8H → S2– + 4H2O (13) Corrosion products:Fe2++S2-→FeS↓ (14) Precipitation reaction: 3Fe2+ + 6OH– → 3Fe(OH)2 (15) Total reaction: 4Fe + SO42– + 4H2O → 3Fe(OH)2 + FeS + 2OH– (16)
In the viscous growth phase, the oxide film on the 2205DSS surface first reacted with the corrosive ions in the oilfield-produced water. At this time, SRB did not directly react with the substrate surface, with the corrosion hazard therefore being small. The most severe corrosion was observed during the logarithmic growth of SRB. In this phase, SO42–was converted into S2–, and the passivation layer thus transformed into a sulfide layer, which resulted in the liberation of oxygen previously bound as oxide. Since protons were consumed by SRB metabolism, their combination with the liberated oxygen was hindered, and thus, the generation of free oxygen in a highly active state and the sulfuration of the oxide layer produced locally soluble oxygen and accelerated the breakdown of the passivation layer [35]. Chen [20] demonstrated that the sulfide-containing passivation film was more easily penetrated by Cl– and SO42– than the sulfide-free passivation film. In the stable growth phase, corrosion was weakened due to the compact microbial film and the sulfide layer covering the steel surface. During the decay phase, the products of SRB metabolic activity resulted in the loosening or even delamination of the biofilm and corrosion product layer, exposing the sample surface to the medium and inducing the formation of a local corrosion galvanic cell and a potential difference, corrosion is therefore promoted.
5. CONCLUSIONS
(1)SRB growth in the oilfield water injection system comprised four phases, namely viscous growth, logarithmic growth, stable growth, and decay.
(2)SRB metabolism induced environmental parameter changes. pH increased during viscous, logarithmic, and stable SRB growth, decreasing in the decay phase. Conversely, solution conductivity increased during viscous and logarithmic growth phases, decreasing during stable growth and decay stages. The sulfide concentration decreased during stable SRB growth, increased in viscous and logarithmic growth phases, and remained stable in the decay stage.
(3)During viscous and logarithmic growth phases, SRB metabolism promoted the corrosion of 2205 DSS. However, during stable growth, the compact microbial film adhered to the metal surface and inhibited corrosion. The decay period featured the degradation of the microbial film, with the uneven delamination of corrosion product and metabolite layers resulting in the formation of a local corrosion galvanic cell.
ACKNOWLEDGMENTS
We are grateful for financial support of the National Natural Science Foundation of China (Grants 51201009) and the Natural Science Foundation of Liaoning Province (Grants 2013020078).
References
1. D. A. Moreno, J. R. Ibars and J. L. Polo, J. Solid State Electrochem., 18 (2014) 377.
2. H. W. Liu, D. K. Xu, Y. N. Wu, K. Yang and H. F. Liu, Corros. Sci. Prot. Technol., 27 (2015) 409. 3. L. Zhao, H. H. Ge, J. Shen and F. Song, Corros. and. Prot., 32 (2011) 200.
4. Y. Ling and G. G. Chen, J. Mech. Eng., 38 (2002) 105. 5. G. Z .Liu and J. H. Wu, Corros. Prot., 22 (2001) 430.
6. Y. J. Fan, Z. B. Pi, P. Hua and Q. Y. Wu, Mater. Prot., 34 (2001) 18.
7. S. S. Abedi, A. Abdolmaleki and N. Adibi, Eng. Failure Anal., 1 (2007) 250. 8. W. Wang, W. J and L. X, Mater. Corros., 55 (2004) 30.
9. I. B. Beech, Microbiol. Today., 30 (2003) 115.
10.E. Sosa, V. Garcia-Arriaga and H. Castaneda, Electrochim. Acta, 51 (2006) 1855. 11.H. Castaneda and X. D. Benetton, Corros. Sci., 50 (2008) 1169.
12.Z. H. Xu, Corros. Prot., 22 (2001) 321.
13.W. Gao, J. M. Luo and J. J. Yang, Ordnance. Mater. Sci. Eng., 28 (2005) 61. 14.A. H. I. Mourad, A. Khourshid and T. Sharef, Mater. Sci. Eng. A, 105 (2012) 549. 15.N. Ebrahimi, M. H. Moayed and A. Davoodi, Corros. Sci., 54 (2011) 1278
16.F.Y. Sun, G. X. Zhao, D. P. Yang and R. Sun, Surf. Technol., 44 (2015) 138. 17.F. T. Zhai, H. H. Li and C. M. Xu, Therm. Processing Technol., 45 (2016) 320.
18.P. J. Antony, R. K. Singh Raman, R. Mohanram, P. Kumar and R. Raman, Corros. Sci., 50 (2008) 1858.
19.P. J. Antony, S. Chongdar, P. Kumar and R. Raman, Electrochim. Acta, 52 (2007) 3985. 20.P. J. Antony, R. K. Singh Raman, R. Raman and P. Kumar, Corros. Sci., 52 (2010) 1404. 21.C. H. Liang, H. Wang and N. B. Huang, Steel Res. Int., 21 (2014) 444.
22.W. P. Iverson, Int. Biodeterioration, 47 (2001) 63.
23.Z. H. Dong, W. Shi and H. M. Ruan, Corros. Sci., 53 (2011) 2978. 24.X. Chen, B. Q. Song, G. Y. Ma and R. Liu, Corros. Prot., 36 (2016) 78.
26.C.Y. Chen, S. Xiang, Y. N. Hu, Y. Liang and W. Shi, Mater. Rev., 30 (2016) 768. 27.C. Z. San and G. Gong, Electrochim. Acta, 52 (2007) 7634.
28.S. S. El-Euamy and A. Badawayw, J. Appl. Electrochem., 34 (2004) 1153. 29.N. Du, Y. E. Chao and W. M. Tian, J. Mater. Eng., 6 (2014) 68.
30.X. Chen, G. F. Wang, F. J. Gao, Y. L. Wang and C. He, Corros. Sci., 101 (2015) 1. 31.L. Yan and J. Wang, Marine Sci., 28 (2004) 70.
32.Y. Y. Zhu, C. B. Zheng, Y. T. Li and Y. L. Huang, Marine Sci., 30 (2006) 11. 33.Z. H. Dong, T. Liu and H. F. Liu, Biofouling, 27 (2011) 487.
34.P. Zhou, S. Qin,Q. Ye and H. F. Liu, Mater. Prot., 46 (2013) 20.
35.F. M. Alabbas, C. Williamson, S. M. Bhola, J. R. Spear, D. L. Olson, B. Mishra and A. E. Kakpovbia, J. Phys. Chem., 78 (2013)34. 2009.
36.A. K. Lee, M. G. Buehler and D. K. Newman, Corros. Sci., 48 (2006) 165.
37.A. Jayaraman, E. T. Chang and J. C. Earthman, J. Ind. Microbiol. Biotechnol., 48 (1997) 11. 38.B. C. Syrett, T. K. Wood and F. Mansfeld, Corrosion Control using Regenerative Biofilms (
CCURB) -an Overview, CORROSION 2001, Houston,America, 2001, 272 39.E. Miranda, M. Bethencourt and F. J. Botana, Corros.Sci., 48 (2006) 2417.
40.B. Souad, A. L. Mohamed and H. Samir, J. Solid State Electrochem., 15 (2011) 525. 41.T. Liu, X. Chen, Y. F. Zhang, D. Wang and Y. Chen, J. Corros. Prot., 34 (2014) 112.