Getting Europe to Work
The Role of Flexibility in Tapping
the Unused Potential in European Labour Markets
CEPS Working Document No. 250/September 2006
Anna Turmann
Abstract
The Lisbon strategy of 2000 sets the ambitious goal (among others) of achieving an employment rate of 70% overall, 60% for women and 50% for older workers within the EU-15 by 2010. Five years later, labour market participation has increased somewhat (overall from 62.5% in 1999 to 64.3% in 2003), but remains disappointingly low in the EU-15 (and even lower for the EU-25).
This study considers the problems related to the flexibility (and thus efficiency) of labour markets in Europe, which leave too many outside the job market and fail to match the unemployed with job opportunities. Key questions that arise are how flexibility can be increased and how private-sector actors can contribute to improving the performance of labour markets. Thus, the study researches the development of labour market participation across the EU according to different types of occupations, along with age, gender and skill groups, giving special attention to the characteristics of the jobs held by ‘marginal groups’ at the edge of mainstream employment. It examines the issues surrounding the mismatch between unemployed persons and unfilled jobs, the different approaches of member states in responding to market fluctuations and the contribution of the private sector to re-integrating long-term unemployed persons on the basis of a case study.
ISBN 92-9079-656-1
Outline... i
1. Introduction... 1
2. Recent employment trends ... 2
2.1 Overall development of the labour markets ... 2
2.2 Women’s employment ... 6
2.3 Youth employment... 8
2.4 Older workers... 10
2.5 Skill composition of the workforce... 11
2.6 Stylised facts ... 14
3. Flexible forms of employment... 15
3.1 Part-time work ... 15
3.2 Fixed-term employment... 16
3.3 Labour market transitions – The role of tenures ... 19
4. Employment protection and labour market outcomes ... 20
4.1 Evolution of employment protection regulation in EU countries ... 20
4.2 Theoretical and empirical background... 23
4.3 Effects of employment protection legislation on labour market outcomes... 25
4.3.1 EPL reduces employment opportunities for women and young persons ... 25
4.3.2 Partial deregulation of EPL may lead to dual labour markets... 26
5. The stepping-stone function of temp work: The example of recent labour market reforms in Germany ... 27
5.1 Personnel mediation: The stepping-stone function of temp work... 28
5.2 Evaluation of the reforms so far... 29
6. Conclusions ... 31
| i n March 2000, the European Council at Lisbon adopted a strategy that was intended to make the European Union the most competitive and dynamic knowledge-based economy in the world, capable of generating sustained economic growth and creating more and better jobs and greater social cohesion. The strategy aims (among other ambitious goals) at achieving an employment rate of 70% overall, 60% for women and 50% for older workers within the EU-15 by 2010.
Five years later, labour market participation has increased somewhat (overall from 62.5% in 1999 to 64.3% in 2003), but remains disappointingly low in the EU-15 (and even lower for the EU-25). Relative to the 2010 employment targets, the overall 2003 employment rate and that of women and older workers fell short by 5.7, 4.0 and 8.3 percentage points, respectively (European Commission, 2004a). The high-level group chaired by Wim Kok confirmed in its report (European Commission, 2004b) that Europe’s ambitious 10-year plan to achieve the Lisbon objectives is falling behind schedule. In particular, women, older workers and low-skilled persons seem to be poorly integrated into European labour markets, causing the shortfall in meeting the Lisbon targets.
Nevertheless, there is still a large number of unfilled jobs in Europe, despite persistently high unemployment (and underemployment), which points to another weakness in European labour markets – namely the inefficiency in the matching process.
This study takes as a point of departure the problems connected to flexibility (and thus efficiency) of the labour markets in Europe, which leave too many outside the job market and do not match the unemployed with job opportunities. Key questions are how flexibility can be increased and especially, what contribution private-sector actors can make towards improving the performance of labour markets.
In particular, this study undertakes research on the following issues:
1) the development of labour market participation across the member states for different types of occupations as well as age, gender and skill groups, with special attention paid to the characteristics of the jobs held by ‘marginal groups’;
2) the mismatch between unemployed persons and unfilled jobs and the reasons for it, especially with regard to skill, age and gender gaps and insufficient occupational as well as geographic labour mobility;
3) the different market-regulation approaches of member states and their role in preventing an adequate response to market fluctuations; and
4) the private-sector contribution to re-integrating the long-term unemployed on the basis of a case study in Germany.
Accordingly, following an introductory section, this study is organised in four parts, which correspond to the four issues enumerated above.
| 1
THE ROLE OF FLEXIBILITY IN TAPPING THE UNUSED
POTENTIAL IN EUROPEAN LABOUR MARKETS
A
NNAT
URMANN*1. Introduction
Globalisation and rapid technological change bring about more dynamic labour markets: while some new jobs are created others are lost. Job loss and creation do not occur in the same sectors, firms or regions in a country, nor do they occur at the same time. They usually differ in terms of pay, skills, age, gender and so on. This structural heterogeneity between jobs created and jobs lost is one of the reasons why, even in the presence of a hypothetical quantity match between the supply and demand of labour, costly qualitative adjustments are often the result. These costs increase with the level of inadequacies between supply and demand and the time needed to adjust (Auer, 2005). Structural unemployment and capacity problems for industrial production are the outcomes of both, caused by ill-adapted labour supply and lack of (or inflexibility in) demand and an inefficient and slow adjustment process.
Hence, in an increasingly integrated world, facing skill-biased technological change, the labour markets should be sufficiently flexible to cope with changes in the demand for human capital. But what does ‘sufficiently flexible’ mean?
According to Monastiriotis (2003), if labour market flexibility is defined as the extent to which labour market forces determine labour market outcomes, it follows that in a totally flexible labour market there are no financial, institutional, political, cultural or other impediments. The purpose of regulations is to organise the operation of the labour market and to establish commonly accepted rules from which both employers and employees should benefit. In addition, labour market regulations aim at neutralising the impact of other sources of labour market rigidity, such as the market power exercised by firms or labour-monopoly power as in the case of insiders versus outsiders of the labour market, which produce inflexibilities and sub-optimal outcomes for employment, output, prices and wages. Therefore, one cannot simply equate labour market deregulation with labour market flexibility. Deregulation is neither a sufficient nor a necessary condition for flexibility (Monastiriotis, 2003). Instead, many other measures, such as education and training or the promotion of regional mobility can support labour market flexibility.
Assessing or qualifying the degree of labour market flexibility is very difficult. As Gruber (2004) points out, “neither a generally accepted taxonomy for classifying economies into different (labour market-specific) institutional groupings nor a scale to measure the distance between these institutional settings is available”. Nevertheless, there are various elements of labour arrangements that are empirically observable and can be associated with market flexibility. On the basis of these factors and knowledge of their policy relevance, it is possible to classify and analyse countries with regard to the observed flexibility of their labour markets.
In this context, several indicators may be useful. This study involves the examination of the development of ‘non-standard’ employment arrangements, such as part-time work and
*
temporary placements, skills acquisition, occupational mobility (and thus the average length of job tenure) and the strictness of employment protection legislation. Further indicators are for example the extent to which labour turnover, the centralisation of wage bargaining, the level of minimum wages, the flexibility of nominal wages, union density or the coverage of collective agreements.
As developed in section four, impediments to flexibility such as employment protection regulation tend to reduce both dismissals and hiring. Its overall impact on aggregate employment and unemployment is therefore not clear. That notwithstanding, the effects of employment protection legislation are different for different socio-demographic groups. For instance, first-time entrants (e.g. young people), and re-entrants (e.g. women) are more likely to be affected by fewer hiring opportunities while in less of a position to benefit from fewer dismissals. Yet the impact on older workers and the low-skilled are more difficult to predict. For these groups the reduction in hiring rates resulting from strict employment protection could be compensated by a decrease in dismissals. Especially for the low-skilled, who tend to be employed in low-productivity jobs and are therefore more likely to be affected by adverse economic developments, employment protection might play an important role (while the flip-side may be an over-representation of unskilled workers in temporary work). In contrast, if employment protection legislation fulfils its stated purpose – protecting existing jobs – those benefiting most from job stability should mainly be men aged 25-54.
The theoretical prediction that employment protection for standard jobs has different effects for different demographic groups is taken as a starting point for this study. Accordingly, the first section presents a picture of recent labour market performance of EU member states with regard to different age groups, gender classes and skill levels. The second section follows with an analysis of the non-standard (or more flexible) types of job contracts, which are disproportionately held by the ‘marginal groups’ (i.e. women, younger and older workers and the least-educated groups) who face particular difficulties in entering the labour market in many member states. Finally, employment protection legislation is studied, as an example of the effects that institutional settings can have on fostering or hampering the integration of labour-market outsiders.
The aim of this paper is to arrive at a detailed description of the unused human potential in Europe’s labour markets and to attain an initial insight into the obstacles to integration.
2. Recent employment trends
This section develops stylised facts about the labour market performance of EU countries. It examines the general development of employment and unemployment rates for different groups by age, gender and skill in order to identify those groups in which potential outsiders are more prevalent.
This broader examination is followed by a more detailed gathering of statistical evidence on recent growth trends of atypical work and fixed-term employment, particularly vis-à-vis regular employment. In addition, job tenures are explored with the aim of looking at labour market dynamics in general in different member states.
Where useful, a comparison with the US is undertaken in order to underline specific differences between the labour markets of the two regions.
2.1 Overall development of the labour markets
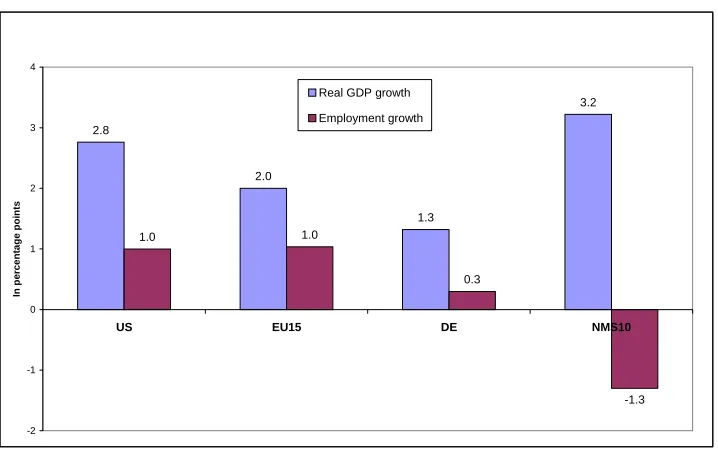
(CEECs)1 and the US, and a protracted economic slowdown in the early 2000s. Declining GDP growth rates translated into reduced (or even negative) employment growth – as in the case of Germany and those new member states that still have to complete their transition process (see Figure 1). Although the global economy has begun to recover over recent years, particularly in the US and Japan, the pace of the rebound in the EU-25 has been somewhat slower: while the US economy grew by 3.1% in 2003, the EU-25 economy grew by only 0.8%, down from 1.1% in 2002. Reflecting this modest pace of growth, employment growth was almost static at 0.2% (0.9% in the US), while the unemployment rate rose to 9.1% (6.0% in the US), up from 8.8% in 2002. Despite foreseen improvements in economic activity, the economic slowdown experienced in the EU in the early 2000s is expected to continue to weigh on the performance of EU labour markets, leading to limited employment growth in 2004 and 2005 (European Commission, 2004a). For the new member states, however, the contraction of employment growth has bottomed out, indicating that these states may show positive employment growth in the near future.
Figure 1. GDP and employment growth, 1999-2003 (% year-on-year average)
2.8
2.0
1.3
3.2
1.0 1.0
0.3
-1.3
-2 -1 0 1 2 3 4
US EU15 DE NMS10
In p
e
rc
e
n
ta
ge
poi
n
ts
Real GDP growth
Employment growth
Sources: Eurostat and OECD databases, own calculations.
In 2003, the labour market situation in the enlarged EU varied widely among the 25 member states (Figure 2). While Denmark, the Netherlands, Sweden and the UK showed employment rates above the Lisbon target of 70% – which were also ahead of the US (71.2% in 2003) – new member states such as the Slovak Republic (57.9%), Hungary (57%) and Poland (51%), along with Belgium and the southern EU countries of Spain, Greece and Italy had a poor overall performance with employment rates below 60%. Portugal ranks remarkably high among the southern member states with an employment rate of 67.2%, while the Czech Republic (64.9%) and Slovenia (62.5%) have the highest employment rates among the new member states.
1
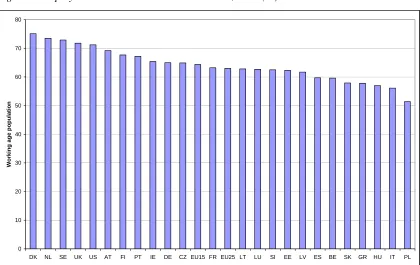
Figure 2. Employment rates in the EU-25 and the US, 2003 (%)
0 10 20 30 40 50 60 70 80
DK NL SE UK US AT FI PT IE DE CZ EU15 FR EU25 LT LU SI EE LV ES BE SK GR HU IT PL
Wor
k
ing a
g
e
p
opula
tion
Sources: Eurostat Labour Force Survey (LFS) and the OECD labour market statistics database.
The development of employment rates over the last five years shows that again, labour market developments are somewhat mixed (Figure 3). Among the large member states, Germany shows the most disappointing picture. Here, employment growth for the last two years has been negative (reaching –1.1% in 2003) and declining, although remaining positive overall, since 2000. Employment growth in France came to a standstill in 2003, while employment growth has decreased steadily over the past few years, down from 2.7% in 2000. In Italy, employment growth has also contracted since 2000, although in 2003 it was still positive at around 1%. Meanwhile, the UK experienced a recovery in employment growth with 0.8% in 2003, up from 0.2% in 2002. Employment growth from 1998-2003 has been dynamic in the Netherlands, Sweden, Finland, Luxembourg and Ireland, although only the latter two countries and Spain have been able to sustain high employment growth rates. In the new member states,2 where much of the disappointing overall development is attributable to Poland, signs of considerable improvements are only displayed by Hungary.3 Nevertheless, employment contraction in the new member states has recently taken place at a slower pace.
As previously mentioned, the unemployment rate in the enlarged EU was 9.1% in 2003, up from 8.9% in 2002 and some 3 percentage points higher than in the US. Unemployment rates were particularly high (over 10%) in the three Baltic States, Spain and Finland, and exceptionally high in Poland (19.7%) and the Slovak Republic (17.2%). In contrast, Luxembourg, the
2
In the following discussion, the situation in eight of the new member states is explored. Malta and Cyprus are left out, since they are too small to be significant. All workers in the new member states make up 15% of overall EU-25 employment.
3
Netherlands, Austria, Ireland, the UK and Denmark showed annual rates of around 5% or less. Compared with one year earlier, the jobless rates improved noticeably in Hungary, Poland, Greece and Italy and considerably in Latvia (down 2.7 percentage points) and the Slovak Republic (down 1.5 percentage points).
Figure 3. Overall employment rates for EU member states, 1998 and 2003 (%)
0 10 20 30 40 50 60 70 80
EU25 CZ EE LV IT HU PL SI SK EU15 BE DK DE GR ES FR IE IT LU NL AT PT FI SE UK
Wor
k
ing a
g
e
p
opula
tion
1998 2003
Lisbon overall ER target 2010 (70%)
Source: Eurostat LFS.
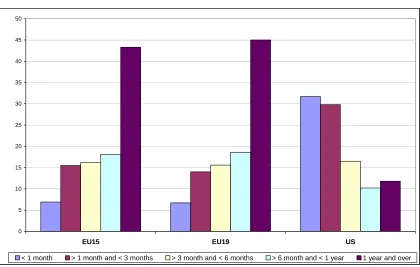
If one looks long-term unemployment (with spells of over one year), the situation is very disappointing in Germany, Greece, Italy, Poland and Slovenia, where in 2003 more than 50% of those unemployed have been without a job for more than a year. In the Slovak Republic, long-term unemployment is even as high as 66% of total unemployment. In those countries, high long-term unemployment rates indicate a higher and stronger persistence of unemployment than in the rest of the EU. The share of long-term unemployed persons in total unemployment is lowest in Denmark, Sweden, Finland and the UK, at around 20%. A comparison of unemployment by duration between the EU and the US shows very different patterns for the two regions: in the EU-19,4 45% of those unemployed are long-term unemployed, with rising shares of unemployed persons alongside growing durations of unemployment. In the US, over 60% of those unemployed are jobless for less than three months and the share of the long-term unemployment in total unemployment is only 12% (Figure 4).
While the average duration of unemployment for the EU is 16 months, according to OECD figures, unemployment lasts on average only 4 months in the US. This indicates that in many EU member states unemployment is not a frictional phenomenon but has become a persistent feature.
4
Figure 4. Unemployment by duration, 2002 (%)
0 5 10 15 20 25 30 35 40 45 50
EU15 EU19 US
< 1 month > 1 month and < 3 months > 3 month and < 6 months > 6 month and < 1 year 1 year and over
Source: OECD labour market indicators database.
In conclusion, one should note that overall labour market participation is best in the Nordic countries, the UK and the Netherlands, and worst in Poland, the Slovak Republic, Italy, Spain and Greece. With the exception of Hungary, the new member states have been experiencing a deterioration of labour market integration as a consequence of the socio-economic changes that have been taking place since the early 1990s. The performance of Germany and France has been in the mid-range, but below the overall Lisbon targets.
2.2 Women’s
employment
Although women’s employment rates are very heterogeneous across the EU-25 (ranging from 71.5% in Sweden to 42.7% in Italy in 2003), on average, women have much lower employment rates than men (Figure 5). The labour market participation of women is particularly high in Denmark, Sweden, Finland and the UK and very low in southern member states, such as Italy, Greece and Spain, where employment rates do not reach 50% and the gap between the employment rates of men and women rate adds up to more than 25 percentage points.
Over the last five years, however, women’s employment rates in all the old member states have improved considerably. Falling short of the Lisbon targets on average by only 4% in 2003, one could say that women are well on their way to reaching the Lisbon targets by 2010. In Sweden and Denmark (both at 70.5%), Finland (65.7%), the UK (65.3%), the Netherlands (65.8%), Austria (62.8%) and Portugal (60.6%),5 employment rates for women in 2003 were already well above the Lisbon target of 60%. In the southern member states of Spain and Italy, women’s
5
employment rates increased by 10 and 5 percentage points respectively. In the new member states,6 employment rates for women in 2003 were on average 5.6 percentage points lower than in the old member states (50.4% compared with 56%), even though the difference between men’s and women’s rates was in general less than in the EU-15 countries (on average the difference was 11.1 percentage points for the new member states and 16.6 percentage points for the old member states in 2003). Developments in employment rates for women in the new member states over the past five years have been disappointing, however. Except for Hungary, the big new member states of the Czech Republic, Poland and Slovakia have shown a decrease in women’s employment.
Figure 5. Employment rates for women in the EU member states, 1998 and 2003 (%)
0 10 20 30 40 50 60 70 80
EU25 CZ EE LV IT HU PL SI SK EU15 BE DK DE GR ES FR IE IT LU NL AT PT FI SE UK
F
e
ma
le
w
o
rk
in
g a
g
e
pop
ul
a
ti
o
n
1998 2003
Lisbon female ER target for 2010 (more than 60%)
Source: Eurostat LFS.
Women are on average also more susceptible to unemployment than men within the enlarged EU. In 2003, the average unemployment rate was 10% for women and 8.5% for men in the EU-25 and showed little change compared with 2002.
In 2003, the pattern of higher unemployment rates for women than for men held for all member states except for the UK, Sweden, Finland, Ireland, Germany, Hungary and Estonia, and was particularly strong with differences of 8 percentage points in Greece and Spain and 5 percentage points in Italy. On average, the difference in unemployment rates according to gender is higher in the old member states (by 1.4 percentage points) than in the new member states (by 1 percentage point).
6
2.3 Youth
employment
In most of the old member states, the situation for younger workers improved over the period 1997-2001. Youth employment rates (which refer to the age group 15-24) rose on average by more than 3.3 percentage points and unemployment rates decreased by over 5.7 percentage points for the EU-15. As a result, youth employment rates peaked in 2001 at 40.6% while youth unemployment dipped to a low of 14%. Over the subsequent two years, however, the situation deteriorated in most old member states, with a drop of the youth employment rate to 39.7% and a rise in youth unemployment to 15.4% in 2003. Young women were the most affected by the upturn, while young men were the most affected by the downturn.
In the new member states, job opportunities for young persons have become scarce. In the period 1998-2003, the employment of persons aged 15-24 declined in absolute terms and as percentage of the respective population. Even in Hungary, where overall employment rates increased, youth employment levels declined. On average, the youth employment rate was 24.4% in 2003 – 15 percentage points lower than in the old member states (Figure 6).
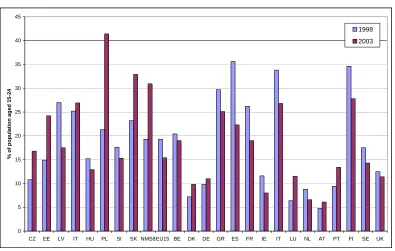
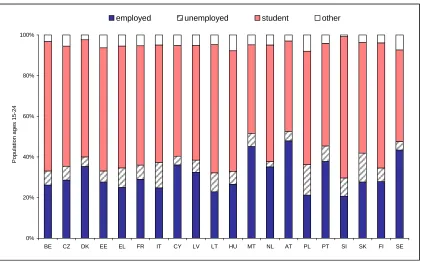
[image:11.595.87.482.377.628.2]Youth unemployment in the old member states was particularly high in Finland (27.8%), Italy (26.8%), Greece (25.1%) and Spain (22.3%) in 2003; but these were also the countries in which the situation for young persons improved considerably from 1997 onwards. Youth unemployment was lowest in Austria (6.1%) and the Netherlands (6.6%).
Figure 6. Youth unemployment rates, 1998 and 2003 (%)
0 5 10 15 20 25 30 35 40 45
CZ EE LV IT HU PL SI SK NMS8EU15 BE DK DE GR ES FR IE IT LU NL AT PT FI SE UK
% of
p
opu
la
ti
on aged
1
5
-2
4
1998
2003
Source: Eurostat LFS.
The high youth unemployment rate on average for the new member states was mainly attributable to unfavourable figures in Poland and the Slovak Republic, where the jobless rate of young persons reached 41.4% and 32.9% respectively. Youth unemployment in the new member states was lowest in Hungary at 12.9%, a country in which youth unemployment figures have been improving over the period 1998-2003, along with those in Slovenia.
[image:12.595.88.510.368.630.2]Since low youth employment rates could well relate to the fact that young persons take part in education, a look at their situation by self-perceived main status7 is very useful. As can be seen from Figure 7, for all member states (for which data were available) other than Austria and Malta, the greatest proportion of young persons perceive their main status as that of a student. The share of young persons with this status is generally between 50% and 60% and even nearly 70% in Slovenia, while the corresponding share of those whose perceived status is employed is generally lower the higher the share of perceived students. Hence, those who will be well prepared for future labour market integration through tertiary education show an actual low level of workforce participation. Against this background, the low employment rates of young persons throughout the enlarged EU are less worrying. Nevertheless, an average rate of unemployment for youth (18%) that is double that of the working age population (9.1%) throughout most of the member states and the recent negative development in the old member states are worrying signs.
Figure 7. Self-perceived status of the youth population (aged 15-24), 2003 (%)
0% 20% 40% 60% 80% 100%
BE CZ DK EE EL FR IT CY LV LT HU MT NL AT PL PT SI SK FI SE
Pop
u
lat
ion
ag
es
1
5
-2
4
employed unemployed student other
Note: No detailed 2003 data by main status were available for Germany, Spain, Ireland, Luxembourg or the UK.
Source: European Commission (2004a).
7
2.4 Older
workers
[image:13.595.88.509.287.579.2]On average, the workforce participation of older workers (aged 55-64) missed the Lisbon employment target by 10% in 2003. Here, the gap to be filled is much bigger, even though labour market participation again varies significantly across member states, showing no clear pattern (such as East versus West or north versus south). Again Sweden (69%), Denmark (60.7%), the UK (56.2%) and Finland (51.1%) showed high employment rates, but so did Portugal (50.1%) and Estonia (52.8%). Particularly low rates of employment at 30% and under were shown by Slovakia, Hungary, Belgium, Italy and Luxembourg. Slovenia had the lowest employment rate for this age group at less than 23%. As can be seen from Figure 8, in all of the old member states the employment trends for older workers have improved over the past five years, notably in the Netherlands, Denmark, Ireland, the UK and France, reflecting average developments.
Figure 8. Older workers’ employment rates in EU member states, 1998 and 2003 (%)
0 10 20 30 40 50 60 70 80
EU25 CZ EE LV LT HU PL SI SK EU15 BE DK DE GR ES FR IE IT LU NL AT PT FI SE UK
P
o
p
u
la
ti
o
n
ag
es
5
5
-6
4
1998 2003
Lisbon older workers' ER target for 2010 (50%)
Source: Eurostat LFS.
Figure 9. The EU-US employment gap by gender and age group (percentage points)
-35 -30 -25 -20 -15 -10 -5 0 5
Total Men Women Total Men Women Total Men Women
15-24 25-54 55-64
NMS8 EU15
Sources: Eurostat LFS and the OECD labour market statistics database.
2.5 Skill composition of the workforce
The skill content of the EU-25 working age population continues to rise. As a look at the figures for educational attainment (ISCED)8 in 2003 shows, on average the share of high-skilled persons was greater in the old member states (19.8%) than in the new member states (12%), as was the share of the low-skilled (below upper-secondary education), with 37% in the old member states and 24.2% in the new member states. Accordingly, the share of medium-skilled persons (having completed upper-secondary education) was on average about 20 percentage points higher in the new member states (63.7% in the East versus 43.2% in the West). The skill composition was broadly similar for men and women. On average, men had a slightly higher skill attainment in 2003, although this characteristic seems to be mainly attributable to Germany. In contrast, in member states such as Finland, Sweden, Denmark and Portugal, the share of high-skilled women in the working age population was higher (in Finland by 7.8 percentage points) than the share of high-skilled men.
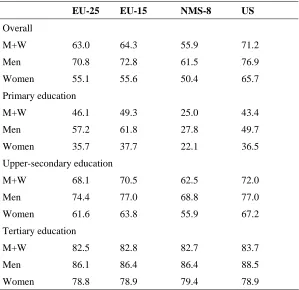
As can be expected, employment rates are generally greater the higher the level of education. Table 1 and Figure 10 confirm that in 2003, in countries where employment participation was the highest, the share of the population that attained tertiary and upper-secondary education was also highest. In the US, the UK and the Nordic countries, where the share of the population (aged 15-64) that completed tertiary education reached around 25%, overall employment rates came close to 70%. Employment rates of the high-skilled in all 25 member states (except for Spain and France) were above 80%. In contrast, countries in which the largest part of the population was still low-skilled tended to display a low degree of labour market participation.
8
For example, in the southern EU countries of Portugal, Spain, Italy and Greece, over half of the population had only completed primary education. Except for Portugal, where the overall employment rate in 2003 was 67.2%, employment rates in these countries for 2003 did not reach 60%. Employment rates of the low-skilled were on average about 17 percentage points lower than overall employment rates in the EU-25. Yet employment rates of the low-skilled varied by as much as 51 percentage points, from as low as 15.1% in the Slovak Republic to 66.8% in Portugal. Especially in the new member states, employment rates of the low-skilled were very low indeed, averaging 25% in the EU-8.
Table 1. Employment rates by skill/educational level, 2003 (%)
EU-25 EU-15 NMS-8 US
Overall
M+W 63.0 64.3 55.9 71.2
Men 70.8 72.8 61.5 76.9
Women 55.1 55.6 50.4 65.7
Primary education
M+W 46.1 49.3 25.0 43.4
Men 57.2 61.8 27.8 49.7
Women 35.7 37.7 22.1 36.5
Upper-secondary education
M+W 68.1 70.5 62.5 72.0
Men 74.4 77.0 68.8 77.0
Women 61.6 63.8 55.9 67.2
Tertiary education
M+W 82.5 82.8 82.7 83.7
Men 86.1 86.4 86.4 88.5
Women 78.8 78.9 79.4 78.9
Sources: Eurostst LFS and OECD database.
Figure 10. Skill/educational composition of the working age population in the EU and the US, 2003 (%)
0% 20% 40% 60% 80% 100%
US FI UK DK EE BE SE IE ES FR NL DE EU15 LT GR LV SI LU AT HU NMS8 PL CZ SK IT PT
Primary education Secondary education Tertiary education
Source: Eurostat LFS.
Figure 11. EU-US gap in employment rates by skill/educational level, 2003 (percentage points)
-20 -18 -16 -14 -12 -10 -8 -6 -4 -2 0 2 4 6 8
Overall Primary education Upper secondary education Tertiary education
EU15 NMS8
[image:16.595.86.510.450.713.2]Figure 12. EU-US gap in unemployment rates by skill/educational level, 2003 (percentage points)
-4 -2 0 2 4 6 8 10 12
Overall Primary education Upper secondary education Tertiary education
EU15 NMS8
Source: OECD labour market indicators database.
2.6 Stylised
facts
The study of labour market participation by different age, gender and skill groups in the EU and the US shows that countries with higher overall employment rates generally manage to better integrate their ‘marginal groups’. The US and the Nordic EU countries of Sweden, Denmark and Finland, along with the Netherlands and the UK show higher employment rates for women, younger persons and older workers. In countries where employment rates have improved considerably during recent years (Spain, Italy, the Netherlands and Finland), this development has mainly been attributable to an increase in women’s employment rates.
3.
Flexible forms of employment
Of the three main forms of flexible employment – self-, fixed-term and part-time employment – it is the latter that has been on the rise most consistently throughout the last two decades and which took the lead in 2003 with a share of 16.5% of total employment across the EU-25. Self-employment followed with a share of 14.8% in 2003, although its share had been decreasing over the last 10 years. Fixed-term employment, which has been on the rise for the past few years in most member states, held a share of 12.7% of total workers.
3.1 Part-time
work
There are two great divides in part-time employment across the EU: East versus West and men versus women. It is women who choose to work part-time in the old member states, with more women in the north deciding to do so. In 2003, 18.1% of EU-15 workers were employed part-time, while for the new member states, the (weighted) average was just about 9%. Among member states, part-time employment was most popular in the Netherlands (45%), followed by the UK (25%). In Austria, Belgium, Denmark, Germany and Sweden, 20% of workers chose part-time jobs.
Part-time employment has been on the rise in most member states (for which data are available) over the past 20 years with shares doubling in Belgium, Germany, France and the Netherlands compared with the early 1980s. Demand for this type of flexible work has been rising more slowly in Greece, Spain, Italy, Portugal and Luxembourg, reaching shares of total workers between 4% (Greece) and 13% (Luxembourg) in 2003. Longer time spans for assessing the trends in part-time employment are not available for the new member states (although such data are available for Austria, Finland and Sweden).
As can be seen from Figure 13, the rise in part-time work can be mainly attributed to the rise in demand by women workers. In some member states almost half of the women employed worked part-time in 2003, while in the Netherlands almost three-quarters of women chose this type of work, with shares of around 40% in Belgium, Austria, Sweden and the UK and 74% in the Netherlands in 2003.9 Part-time employment was also more frequent among some age groups than others. Especially younger (aged 15-24) and older (aged 55-64) workers took a proportionally more frequent recourse to part-time work. There is also a clear gender distinction in the occurrence of part-time work by age. Men are most likely to work part-time in their youth, while women are more likely to do so in the later stage of their careers. Moreover, while the share of men in part-time work decreases sharply from youth to prime-aged, for women the share remains roughly the same across all age categories (European Commission, 2004a). Nevertheless, the picture varies at member-state level. For example, in Denmark, 58% of the young employees and in Portugal 20% of the older workers held part-time jobs in 2003.
The skill composition of part-time workers throughout the EU-25 does not seem to differ much from that of total employees. In Germany, France, the Netherlands, Finland and the UK the educational attainment of part-time workers is slightly biased towards the low-skilled. Only in the southern member states of Spain, Portugal, Italy and Greece is the share of part-time workers who only completed primary education significantly higher than among those in regular employment.
9
Figure 13. Part-time employment by gender, 2003 (%)
0 10 20 30 40 50 60 70 80
EU25 EU15 BE CZ DK DE EE GR ES FR IE IT LV LT LU HU NL AT PL PT SI SK FI SE UK
% o
f tota
l e
m
ploy
me
nt
Total Men Women
Source: Eurostat LFS.
3.2 Fixed-term
employment
The share of workers holding a fixed-term contract varies across member states, but differences between old and new member states are far less striking for fixed-term than for part-time work. Spain sticks out as having had a share of workers on fixed-term contracts of over 30% in 2003, followed by Poland (21%)10 and Portugal (19%). In contrast, Estonia, Luxembourg, Ireland, Slovakia and the UK had very low shares of fixed-term employment below or around 5%. Germany, France, Latvia, the Netherlands, Slovenia, Finland and Sweden showed rates around the EU-25 average of 12.8%.
As the development over the past five years shows (Figure 14), the share of fixed-term work has been increasing in all the new member states, most notably in Poland, where the share increased from 4.7% in 1998 to 19.4% in 2003. In contrast, in most old member states the share of fixed-term workers was more or less the same in 2003 (12.8%) compared with 1998 (13.1%) and had been decreasing significantly after peaking in 2000, following a period of strong employment growth. Only in Portugal, the Netherlands and Italy had the share of fixed-term contracts been more or less constantly on the rise.
Unlike part-time work, fixed-term employment is more evenly spread between men and women at the EU level. In 2003, the share of fixed-term employment for the EU-15 was on average 13.9% for women and 11.9% for men, while in the new member states the respective shares were 14.7% for women and 16.7% for men. The share of fixed-term work was distinctly higher for women than for men in Belgium, Spain and Sweden, where the gender gap was around 5 percentage points; it was highest in Finland, where it exceeded 7 percentage points.
10
Figure 14. Share of employees in fixed-term employment, 1998 and 2003 (%)
0 5 10 15 20 25 30 35
EU25 EU15 BE CZ DK DE EE GR ES FR IE IT LV LT LU HU NL AT PL PT SI SK FI SE UK
% o
f tota
l e
m
ploy
me
nt
1998 2003
Source: Eurostat LFS.
Figure 15. Fixed-term employment by gender, 2003 (%)
0 5 10 15 20 25 30 35
EU25 EU15 BE CZ DK DE EE GR ES FR IE IT LV LT LU HU NL AT PL PT SI SK FI SE UK
% of tota
l e
m
ploy
m
e
nt
Total Men Women
[image:20.595.88.514.443.705.2]Looking at different age groups, it is young entrants in the labour market (aged 15-24) who are more likely than any other age group to have a temporary contract. The share of fixed-term employment for young workers is three to four times higher than for total employees of working age (15-64). In Germany, Poland, Slovenia, Sweden and Spain roughly one out of every two employees aged 15-24 is holding a fixed-term contract. The importance of fixed-term work decreases with age. The average share of this type of contract for older workers (aged 55-64) was only 6.3% for the EU-25 in 2003.
Throughout most EU-25 member states it holds true that the skill composition of fixed-term workers shows a bias towards the low-skilled. On average, the share of low-skilled workers in fixed-term employment is over 10 percentage points higher than their share in total employment. In contrast, the share of medium-skilled and high-skilled workers is 9 percentage points and 2 percentage points lower respectively in fixed-term employment than in total employment. Ireland, Finland, Sweden and France show much smaller differences in the skill composition of fixed-term versus overall workers than the average. Notably, the UK even has a higher share of workers (over 13 percentage points more) with tertiary education in fixed-term employment than in total employment.
In conclusion, one can say that flexible forms of employment, both part-time and fixed-term, are on the rise throughout the EU-25. Part-time employment, although not yet very common in the new member states, has increased remarkably over the past 20 years with shares in total employment doubling compared with the early 1980s in many member states. The demand by women workers for this type of flexibility, attributable to the aim of women to combine family and career, has been the main driving force for this development.
Fixed-term jobs grew twice as fast as permanent jobs throughout the period 1995-2001, despite the slow-down in the old member states. Growth of this type of flexible working was particularly high in those countries known for lower numerical flexibility,11 such as the southern member states and former socialist countries. In contrast, the share of workers in fixed-term work has been stagnant or decreased in Denmark, Ireland and the UK – countries with highly flexible labour markets. Within countries, this type of flexibility is very much concentrated on young persons. Here the function of short-term contracts as a probationary period comes into effect, as firms can choose to retain workers with the necessary skills during this ‘screening period’. Also, young workers can use these short-term periods themselves to experiment with different types of jobs. Finally, fixed-term employment is more common for less-qualified workers (with the exception of the UK), possibly pointing to their relative disadvantage in the labour market when it comes to finding a more stable form of employment. This trend is worrisome as evidence shows that workers on short-term contracts receive less the-job-training than those with permanent jobs, at least in the case of temporary project jobs and on-call jobs – as opposed to actual probationary periods (European Foundation of the Improvement of Living and Working Conditions, 2002).
The growth of flexible kinds of employment in countries that are known for strict labour market regulation, as well as the fact that both types of employment – regular and flexible – has been increasing in many member states, leads to the question of whether in some EU countries standard and flexible forms of employment function as complements in dual labour markets, with firms using both. If this is the case, it would mean that while for some groups their situation in the labour market and their employment relationships have not changed very much, for others quite the opposite holds true.
11
3.3 Labour market transitions – The role of tenures
[image:22.595.89.513.262.534.2]Looking at the development of the average tenure12 of jobs for EU countries for which data was available, one can see that although there was wide variation among countries, the averages for 1993 and 2003 remained almost unchanged (Figure 16). Hence, the long-term employment relationship is a long way from disappearing and is still the dominate form of employment in most EU countries (as can be seen from Figure 14, over 85% of total employment in the EU is of indefinite contractual duration). There is no ‘race to the bottom’ of the employment relationship taking place. One has to bear in mind, however, in view of average job tenure, these jobs increasingly include part-time employment and a quite stable share of self-employment – two forms of flexible contracts.
Figure 16. Average job tenure for EU countries and the US, 1993 and 2003 (years)
0 2 4 6 8 10 12 14
US UK DK IE ES NL DE LU FR BE IT PT EL
y
ears
1993 2003
Sources: Eurostat LFS and the US Bureau of Labour Statistics.
Job tenure not only shows the stability aspect of the employment relationship, but by definition the indicator reveals mobility as well. It is interesting to see from Figure 16 that those countries with a lower share of employment in fixed-term contracts (but with highly flexible labour markets in general) also had lower average tenures, as can be seen not only in the US and the UK, but also in Denmark and Ireland. In contrast, most countries on the right side of the figure, known for rigid labour markets, showed an increasing share of workers holding short-term contracts during 1993 and 2003.
Of course, even if the average tenure has remained the same, the various elements that make it up have been subject to change. As could be surmised from the analysis in section 3, different groups in the workforce (in different sectors of the economy) face different kinds of changes in
12
their employment relationships. Needless to say, and in line with the observation that fixed-term work is very much concentrated among young persons, average job tenures increase with age. Yet the average length of the employment relationship does not vary much among workers of different skill levels. In the group of prime-aged workers, those having the longest employment relationships on average are actually those with the lowest educational attainment.
This somewhat contradicts the observation in section 3.2 that low-skilled persons hold proportionally more fixed-term contracts than medium- or high-skilled workers. But if some of the less well-educated workers who left the labour market enter again as short-term workers and do not outweigh the ‘core’ of low-skilled workers with permanent jobs, it could well be that the labour market for low-skilled workers is segregated.
The development of different types of employment contracts shows that especially in those EU countries that have been known for rather rigid labour markets, flexibility has increased, at least for certain demographic groups. The data on job tenures reveals, however, that increased dynamics for some groups in the labour market have not yet led to an decrease in the length of employment relationships altogether. Hence, while compositional changes have taken place, the overall outcome has not been subject to change.
In the following section, the evolution of employment protection regulation since the late 1980s is examined with regard to the question of whether the increase in labour market flexibility has affected on firms’ hiring and firing decisions. In particular, an assessment is made of the extent to which the recent growth of ‘non-standard’ jobs for some socio-demographic groups in the labour market can be explained by the liberalisation of the respective employment regulations.
The analysis should answer the question of whether there is evidence of general labour market segregation in those EU countries where the employment protection regulation of regular contracts is very strict. It should also show where more fundamental reforms are needed across the entire spectrum of regulations that affect the cost of employing labour, so that outsiders or the demographic groups at risk of having to leave the labour market can profit from enhanced labour market flexibility.
4.
Employment protection and labour market outcomes
4.1 Evolution of employment protection regulation in EU countries
Employment protection regulation refers to the rules that govern hiring and firing decisions, such as the duration of work contracts, conditions of dismissal and severance pay provisions.
The most common summary indicators of employment protection regulation are provided by the OECD (1999 and 2004). Even though these indicators are not exhaustive, they are by now standard measures for the strictness of employment protection legislation (EPL). EPL index values are available for three points in time – the late 1980s, the late 1990s and 2003.13
As can be seen from Figure 17, the overall strictness of employment protection varies widely among EU countries.14 Specific requirements for collective dismissal do not seem to play a major role in explaining these differences, as they do not affect cross-country comparisons
13
Employment protection as measured by the OECD EPL index comprises regulations on individual and collective dismissals and regulations on temporary forms of employment. In the case of regular forms of employment, the EPL summary index refers to dismissal protection legislation. The EPL summary index on regulations of temporary employment comprises regulations on fixed-term contracts and temporary work agencies (TWAs).
14
much. On the contrary, the regulation of temporary forms of employment appears to be the key element in explaining differences in the levels of employment protection legislation between member states and the US. France, Greece, Spain and Portugal, situated at the right end of the figure, display the strictest levels of employment protection, while not having particularly stringent provisions for regular (or ‘permanent’) contracts. There is also more variation in the degree of strictness of temporary employment regulation than for regular contracts.
Figure 17. Employment protection legislation in EU countries and the US, 2003
0 0.5 1 1.5 2 2.5 3 3.5 4
US UK IE HU DK CZ SK FI PL AT NL IT BE DE SE FR EL ES PT
Scal
e
0-6
Protection of regular employment Collective dismissal requirements Regulation of temporary employment
Source: OECD database, using OECD (2004) Annex 2.A1 for calculation of the weights of the index components.
Even though there were still big differences in the strictness of EPL in 2003, when looking at the evolution of EPL over the last 15 years, one can see that there has been some convergence (see Figure 18). In many EU countries, employment protection was relaxed in the 1990s, especially in those countries with particularly high levels of overall regulation. Yet the relative position of EU member states across the spectrum of EPL strictness has not changed much since the 1980s: the UK, Ireland and Denmark have remained the least-regulated countries (following the US), even though their employment protection legislation has not been subject to major changes (apart from Denmark). Meanwhile, southern EU states have continued to show the highest degree of EPL strictness, despite having relaxed their labour market regulation.
France and Italy are exceptions to this rule: although Italy had one of the most-regulated labour markets in the late 1980s, it moved to the middle of the spectrum in 2003 while France moved in the opposite direction.
Figure 18. Overall employment protection reforms from the late 1980s to 200315
Source: OECD database.
One can see that changes in labour market regulations between the late 1980s and the late 1990s occurred in those countries where it was the strictest. Changes in market regulation between the late 1990s and 2003 are more mixed. Some member states at the bottom of the EPL ranking have tightened regulation, while others with stricter rules have continued their deregulation process.
As can be seen from Figure 19, in most cases changes in overall EPL strictness were driven by changes in the regulation of temporary work. Deregulation in this area has generally consisted of facilitating the use of fixed-term contracts and or providing recourse to workers hired from temporary work agencies (TWAs).
Most changes in overall employment protection regulation since the late 1980s have been driven by partial reforms. Indeed, for the most part reforms have affected either regulation of regular contracts or the regulation of temporary contracts – rarely both. In particular, many EU countries have chosen to enhance workforce flexibility by easing the use of temporary employment while keeping the existing provisions for regular contracts (OECD, 2004).
Does employment protection have an effect on labour market outcomes? If the reforms of EPL have rarely addressed the whole set of provisions but often only specific contractual types – are labour markets increasingly segregated in the sense that groups of workers with low employment security coexist with a core of workers who are highly protected against dismissals?
Against the picture of recent growth in temporary employment (section 3.2), these questions are addressed. The starting point is a survey of the theoretical predictions and empirical findings on the impacts of employment protection on labour market participation.
15
This includes specific requirements for collective dismissal.
Late 1990s versus 2003
0 0.5 1 1.5 2 2.5 3 3.5 4 4.5
0 0.5 1 1.5 2 2.5 3 3.5 4 4.5
Late 1990s 2 003 US UK IE HU DK PL CZ FIN NLBE AT SK DE IT ES F PT GR stricter
les s strict
Late 1980s versus late 1990s
0 0.5 1 1.5 2 2.5 3 3.5 4 4.5
0 0.5 1 1.5 2 2.5 3 3.5 4 4.5
Figure 19. Deregulation and re-regulation in regular and temporary work
Source: OECD database.
4.2 Theoretical and empirical background
Economic theory predicts that mandatory employment protection generates non-wage labour costs, unless it is offset by proportionate wage changes through efficient labour contracts (Lazear, 1990). Indeed, the set of rules governing unfair dismissals, layoffs for economic reasons, severance payments, minimum notice periods, administrative authorisation for dismissals and prior discussions with representatives of trade unions or labour market administrations certainly implies that layoffs are costly for employers. These costs reduce the profitability of firms and therefore output and employment. In addition, there may be a substitution effect that reduces labour demand (depending on the substitutability or
End 1990s - End 1980s
-1.4 -1.2 -1 -0.8 -0.6 -0.4 -0.2 0 0.2 0.4
US UK IE HU PL CZ DK AT FI SK FR NL BE DE SE EL ES IT PT
Change in regular employment legislation Change in temporary employment legislation Overall change
2003 - End 1990s
-0.7 -0.6 -0.5 -0.4 -0.3 -0.2 -0.1 0 0.1 0.2 0.3
US UK IE HU PL CZ DK AT FI SK FR NL BE DE SE EL ES IT PT
complementarity of other factors of production). These negative effects aggravate the situation if protection for insiders raises their bargaining power vis-à-vis outsiders of the labour market with the impact of increased labour costs through higher wages. Employers will take these costs – along with the likelihood that firing costs will also be incurred in the future – into account when hiring new workers. Therefore, employment protection could reduce both dismissals and hiring.
The benefits of long-term employer-employee contracts, apart from employment security, are a greater willingness of employers to invest in on-the-job training, thereby increasing the employees’ firm-specific human capital. In addition, employment protection may diminish firms’ ability to cope with a rapidly changing environment driven by globalisation, technological change and the derived organisational innovation (OECD, 2004). Here, employment protection translates into employment adjustment costs and may have the effect of
lowering labour productivity, when these costs impede an efficient reallocation of labour from old and declining sectors to new and dynamic ones.
Although economic theory does not provide a clear-cut hypothesis about the impact of more stringent employment protection on employment stocks, the predicted effect on worker flows is unambiguously negative. In countries with a high degree of employment protection, job turnover rates (referring to the sum of jobs created or destroyed in a labour market) as well as average job tenures are therefore expected to be lower than in countries with rather flexible regimes. Accordingly, flows into and out of unemployment are expected to be lower, while unemployment spells lengthen on average. The theory of dismissal protection furthermore suggests several structural effects. Worker reallocation may slow down more in sectors facing relatively volatile demand (e.g. in the hotel and restaurant sectors) than in those with more stable demand. The composition of employment may also change: since dismissal protection raises the costs of a bad hire, firms (all other things being equal), should become choosier in selecting employees. Youth and older workers are then at risk of not being hired. Women, under the assumption that they leave the labour market owing to family engagements more often, might be disproportionately affected by reduced hiring rates. Moreover, non-uniform enforcement may create a dual labour market in the sense that firms expand on jobs with less stringent dismissal protection provisions such as fixed-term contracts. More generally, firms may engage in strategic behaviour to avoid institutional constraints (Bauer et al., 2004).
The available empirical evidence for the impact of EPL on employment stocks and flows, surveyed by Bertola et al. (1999) and Addison & Teixeira (2001), does not clearly support the theoretical predictions, as the empirical outcome is mixed. Evidence supports the hypothesis that employment protection reduces net employment. The consequences are more discernible for some demographic groups than for others: for example, it seems clear that prime-aged male workers have not been adversely impacted, while younger persons have. Also, there is some positive association between employment protection and more flexible forms of work, even though there is little systematic evidence at cross-country level regarding atypical employment.
The impacts on unemployment are less clear-cut. Robust results are, however, observed for the effect of employment protection on structural unemployment (defined as the difference between the actual level of unemployment and its cyclical component), long-term unemployment and jobless rates for certain demographic groups, i.e. young persons. On employment flows, the only robust result is that more stringent employment protection reduces flows into and out of unemployment.
4.3 Effects of employment protection legislation on labour market
outcomes
4.3.1 EPL reduces employment opportunities for women and young persons
As discussed in the previous section, even though evidence of the role played by EPL on aggregate employment and unemployment rates remains mixed in both theoretical and empirical studies, the idea that EPL may not affect all socio-demographic groups in the same way finds more support.
[image:28.595.86.516.317.599.2]Although EPL is generally shown to have little or no impact on the employment and unemployment of prime-aged men, the situation for both women and young persons is a bit different (Figure 20). According to OECD (2004), EPL is found to significantly reduce the employment opportunities of prime-aged women while the results for youth, although showing the right signs, vary in significance.
Figure 20. Effects of EPL on employment and unemployment of different groups
Sources: Eurostat LFS and OECD database.
Indeed, there are reasons to think that young persons, as entrants into the labour market, and women with interrupted working lives, will primarily be affected by any reduced hiring caused by EPL while being less able to profit from reduced firings than other demographic groups. On the other hand, those already in the core labour market, mainly prime-aged men, will benefit from any greater job stability induced by EPL. As Figure 20 reveals, the employment rate seems unaffected by the strictness of regular contracts across countries. Female and youth unemployment rates, however, do seem to be affected by employment protection for permanent employment.
Share of fixed term w orkersin relation to protection of perm anent contracts, 2003
0 5 10 15 20 25 30 35
0 0.5 1 1.5 2 2.5 3 3.5 4 4.5
Scale 0-6 in p e rc e n t ES PT SK CZ PL
FIN SE NL
UK DK IE BE IT HU AT GR F DE
Em ploym ent rates of prim e-age m en versus the degree of strictness of regular contracts
0 20 40 60 80 100
0 0.5 1 1.5 2 2.5 3 3.5 4 4.5
Scale 0-6
Youth unem ploym ent rates versus the degree of strictness of regular contracts
0 10 20 30 40 50
0 0.5 1 1.5 2 2.5 3 3.5 4 4.5
Scale 0-6
Fem ale unem ploym ent rates versus the degree of strictness of regular contracts
0 5 10 15 20
0 0.5 1 1.5 2 2.5 3 3.5 4 4.5
Results for older workers suggest that the reduction in hiring rates might be compensated by a decrease in firings resulting from EPL. The cost of firing someone with a long tenure is very high and employers tend to retain these workers. Those older persons who are not employed are most probably inactive instead of unemployed, being too close to retirement age to actively search for jobs.
For the low-skilled, OECD (2004) also shows mixed evidence, with some specifications pointing to a positive effect of EPL on employment rates. As the low-skilled tend to be employed in low-productivity jobs, they are more likely to be affected by adverse economic developments that reduce labour demand. As section 3.2 showed, low-skilled persons are more likely (along with young persons) to be employed on a temporary basis, especially in countries where EPL is strict. Here, temporary contracts may support the employment opportunities for those unskilled workers outside the core labour market.
4.3.2
Partial deregulation of EPL may lead to dual labour markets
As explained in section 4.1, many countries have been easing their regulation on temporary forms of employment since the late 1980s. The existence of high firing costs may indeed constitute an incentive for employers to use fixed-term contracts in sequence rather than converting them into regular contracts.
Partial EPL reforms, where the regulation of regular employment remains unaltered while the regulation of temporary contracts is relaxed may lead to dual labour markets. In this regard, the Spanish labour market has been investigated, in which one-third of employees are under fixed-term employment contracts. According to Dolado et al. (2002), the effects of reforms “at the margin” in 1984 had neutral or limited effects on overall unemployment.
The extent to which flexible employment contracts are used by employers and how often these serve as stepping stones for regular employment largely depends on the way permanent contracts are regulated. The illustration in Figure 20 suggests that stricter rules applied to regular contracts increase the incidence of fixed-term work and limit the extent to which those contracts are converted into permanent ones. Indeed, comparing the outcomes of section 3.2 with those in section 4.1, one sees that flexible employment has grown faster in those countries where rules governing the use of temporary employment have been significantly eased compared with the regulation of regular contracts. For example, in Italy and Portugal, where rules on fixed-term employment have relaxed during recent years, this type of employment grew by several percentage points from 1998 to 2003.16 In the new member states, where regulation on permanent and temporary contracts is low to begin with, the use of temporary contracts has also increased considerably. In contrast, where overall labour market regulation is flexible, and fixed-term employment legislation (the maximum duration of fixed-term contracts) has even been tightened recently, the share of workers in temporary employment has decreased. Along these lines, Nunziata & Staffolani (2003), who observed the old member states from 1983 to 1998, show that temporary employment and permanent EPL are positively correlated.
16
Figure 21. Distribution of employment by length of tenure, percentage share, 2004 (years)
0 10 20 30 40 50 60
0 5 10 15 20 25
less than 1 year
1
0
ye
ar
s and more
DK
IE UK
EE LV
ES FI
LT NL
LU
GR
IT
BE PT
SI FR
DE PL
AT
SE
CZ HU SK
flexible and dynamic labour market segregation inflexible labour
markets
Source: Eurostat, LFS.
Figure 21 shows that in those countries where overall EPL is low – such as the UK, Ireland and Denmark, the share of jobs with a short-term character (tenure of less than one year) is high while the share of long-term jobs (with tenures of more than 10 years) is low. Conversely, in Spain, where overall regulation and especially regulation of regular employment is still high, the share of long-term jobs is much higher, yet the share of short-term jobs is comparable to that in dynamic countries. This underlines the suggestion that the Spanish labour market is somewhat segregated. Greece, Italy, Belgium and Luxembourg show signs of less dynamic labour markets – i.e. a high share of long-term jobs and a low share of short-term jobs.
5.
The stepping-stone function of temp work: The example of recent
labour market reforms in Germany
So far, fixed-term work and temporary agency work have been treated as equivalents owing to the lack of detailed macro-data on the latter. In the following discussion, the focus will only be on temporary agency work alone. According to Neugart & Storrie (2005), temporary agency work can be defined as follows: the temporary agency worker is employed by the temporary work agency and, by means of a commercial contract, is hired out to perform work assignments at a client firm.
to a limited extent by overtime (Burda & Kvasnicka 2003). Surveys among temp staffing industries show that temporary workers are primarily used to offset short-term needs in personnel that are caused by fluctuations in the supply of a firm’s own work force or in the demand for the goods it produces (see for example Houseman et al., 2003).
5.1 Personnel mediation: The stepping-stone function of temp work
Temporary work offers outsiders such as workforce entrants and formerly employed persons a starting point in the job market. Especially for workers with fringe-group characteristics, temp work could offer a possibility to (re-)enter the labour market, which would not have been available in the regular labour market.17 Particularly in times of an economic slow-down, taking temp work can be viewed as signalling a willingness to work. Surveys among temp workers confirm that the majority of the workers accept temporary jobs to avoid unemployment on the one hand and on the other to use the firm contacts to raise the possibility of being hired on a regular contract (CIETT, 2000). In the latter case temp work serves as a stepping stone into the regular labour market.
In Germany, the stepping-stone function of temp work was the declared objective of the recent labour market reforms in Germany (the so-called ‘Hartz reforms’). Specifically, the deregulation of the temp labour market and the area-wide setting-up of personal service agencies (PSAs) have the goal of bringing the unemployed back to work through temporary employment (Baur, 2003).
The recent reform of temporary work in Germany consisted of changes in the law that regulates the mediation of temporary workers (Arbeitnehmerüberlassungsgesetz, AÜG). The reform, which came into effect on 1 January 2004, envisaged the equal treatment principle for temp workers: the temporary agency (the ‘leasing firm’) has to offer the temp worker the same working conditions, including pay, as the client firm offers its employees.18 In return, the admissible renewal frequency of temp work contracts was abolished and the maximum total duration of the contracts lifted (before 2004, the maximum length of a temp contract was 24 months). In addition, the so-called ‘ban on synchronisations’, according to which the length of the contract with the temp agency had to be greater than the length of the first hire, was abolished. Furthermore, the restriction of temp work to certain sectors was loosened, allowing TWAs to offer their services in the construction industry as well. The former limitations to length of contracts, number of contract renewals and sectors were quite strict compared with the rules in other European temp labour markets that allow for the use of temp work (Burda & Kvasnicka, 2003). Therefore, these recent reforms of the temp market in Germany represent a big step.
In order to make use of the ‘bridge’ effect of temp work, the first Hartz reform (which came into effect on 1 January 2003) instigated the set-up of the subsidised PSAs.19 The overall aim of PSAs is the mediation of unemployed persons into regular jobs that are subject to social insurance contributions. The temporary contracts have a general duration of 12 months.
17
More than 60% of all workers who entered temp work in 2002 were not previously employed (Burda, 2003).
18
In case the TWA is covered by a collective agreement or the temp worker was unemployed before getting a job at a TWA, exemptions to the equal treatment principle are possible. As collective agreements are already quite common in the temporary staffing industry in Germany, many temp workers will be covered by those agreements rather than the equal pay principle.
19