Int. J. Electrochem. Sci., 10 (2015) 786 - 794
International Journal of
ELECTROCHEMICAL
SCIENCE
www.electrochemsci.orgElectrodeposition of Pt-P Nanoparticles
for the Electrocatalytic
Oxidation of Ethanol
Lei Shang, Faqiong Zhao, Baizhao Zeng*
College of Chemistry and Molecular Sciences, Wuhan University, Wuhan, Hubei Province 430072, People’s Republic of China
*
E-mail: [email protected]
Received: 21 October 2014 / Accepted: 27 November 2014 / Published: 2 December 2014
Platinum-phosphorus (Pt-P) nanoparticles were electrodeposited on a glassy carbon electrode from a solution containing 0.2 M Na2SO4, 1 mM H2PtCl6 and 0.1 mM NaH2PO2. Energy dispersive X-ray spectroscopy, X-ray photoelectron spectroscopy and X-ray diffraction revealed that P and Pt formed composite and in the Pt-P nanoparticles the content of Pt0 species was higher than that in Pt nanoparticles. The resulted Pt-P catalyst exhibited enhanced electrocatalytic activity and stability for ethanol oxidation compared with Pt nanoparticles. This fabrication method was green and simple with additional reducing agents and fixative process free.
Keywords: Electrodeposition, Pt-P nanoparticles, Ethanol, Electrocatalytic oxidation.
1. INTRODUCTION
Direct alcohol fuel cells (DAFCs) have attracted increasing attention as a promising potential power generator for portable electronic devices and vehicular applications [1, 2]. Although Pt electrocatalyst is well known in these full cells, Pt is expensive and resource-limited and it also has other disadvantages [3, 4]. In order to overcome Pt electrocatalysts’ shortcomings, one of the most common approaches is to prepare Pt based bimetals with other metals such as Rh, Ru, Sn, Fe, Co, Ni, Cu and Mn [5-10]. Thus the consumption of Pt can be reduced. Furthermore, the electrocatalytic activity and CO tolerance of Pt catalysts can be enhanced. However, few Pt-nonmetal composites have been reported as electrocatalyst [11, 12].
[11] fabricated highly dispersed platinum-phosphorus (Pt-P) nanoparticles on carbon support by reducing platinum ions in an aqueous solution containing hypophosphite (H3PO2). The obtained Pt-P catalyst showed higher activity to oxygen-reduction than pure Pt catalyst. Ma et al [12] prepared a carbon supported Pt-P (Pt-P/C) catalyst from Pt(NO3)2 and phosphorus yellow at room temperature. The P was thought to improve the electrocatalytic performance of Pt/C catalyst for the oxygen reduction reaction. However, to the best of our knowledge, the Pt-P catalysts have not been used for the electrochemical oxidation of ethanol. In addition, the reported preparation methods for Pt-P catalysts were complicated and time-consuming [11, 12]. Electrodeposition is a simple and controllable technique [13]; however it has not been used for the preparation of Pt-P catalyst.
In this paper, Pt-P nanoparticles are electrodeposited on a bare glassy carbon electrode (GCE). The structure and electrochemical property of the resulting Pt-P catalyst are studied by scanning electron microscopy (SEM), energy dispersive X-ray spectroscopy (EDX), X-ray photoelectron spectroscopy (XPS), X-ray diffraction (XRD) and voltammetry. The obtained Pt-P catalyst shows higher electrocatalytic activity and stability toward ethanol oxidation in comparison with the counterparting Pt nanoparticles.
2. EXPERIMENTAL SECTION
2.1 Reagents
H2PtCl6·6H2O, NaH2PO2·H2O, H2SO4, CH3CH2OH, CuSO4·5H2O, RuCl3, NiSO4·6H2O, NaWO4·2H2O and Na2SO4 were purchased from Sinopharm Chemical Reagent Co. Ltd. (Shanghai, China). All chemicals used were of analytical reagent grade. The water used was redistilled.
2.2 Apparatus
Electrodeposition, cyclic voltammetric (CV) and chronoamperometric experiments were performed with a CHI 604D electrochemical workstation (CH Instrument Company, Shanghai, China) and a conventional three-electrode system. The working electrode was a modified GCE (diameter: 3 mm) or a glass substrate (10 mm×10 mm×2.2 mm) coated with an indium tin oxide (ITO), and the auxiliary and reference electrodes were a platinum wire and a saturated calomel electrode (SCE), respectively. The SEM images and EDX spectroscopy were obtained by using a Hitachi X-650 SEM (Hitachi Co., Japan). XRD data were recorded with a Bruke D8 diffractometer (Germany) using Cu Kα radiation (40 kV, 40 mA) with a Ni filter. XPS was performed on an XSAM800 spectrometer (KRATOS Co., UK), using Mg Kα radiation (1253.6 eV, 16 mA × 12 kV) at a pressure of 6×10⁻⁷
2.3 Preparation of modified electrodes and electrochemical measurements
Pt-P catalyst was electrodeposited on a just polished GCE from a solution containing 1 mM H2PtCl6, 0.1 mM NaH2PO2 and 0.2 M Na2SO4 at room temperature. The potential was fixed at -0.3 V for 300 s. Then the resulting modified electrode (Pt-P/GCE) was washed carefully with redistilled water. For comparison, Pt/GCE was prepared by the similar method. Prior to each experiment, the working electrode was subject to potential cycling between -0.2 V and 1.2 V in 0.1 M HClO4 deoxygenized by N2 until a stable CV curve was obtained. Then 0.1 M ethanol was added into the solution and the CV curves for the ethanol electro-oxidation were recorded at rate of 50 mV/s.
3. RESULTS AND DISCUSSION
3.1 Morphological and structure analysis
Fig. 1 shows the SEM images of Pt and Pt-P catalysts. As can be seen, the electrodeposited Pt particles are not uniform, displaying an inhomogeneous size distribution ranging from 60 nm to 250 nm. However, the Pt-P particles are uniform, the particle diameter is about 100 nm and the particle density is higher. This indicates that NaH2PO2 is effective for reducing the size of Pt nanoparticles, promoting the deposition of Pt. This phenomenon is in line with the previous reports [11, 12].
Figure 1. SEM images of Pt (A) and Pt-P (B) deposited. The solution for electrodeposition: 0.2 M Na2SO4 containing 1 mM H2PtCl6 (A) and 0.1 mM NaH2PO2 (B); electrodeposition potential: -0.3 V; electrodeposition time: 300 s.
[image:3.596.154.442.425.561.2]
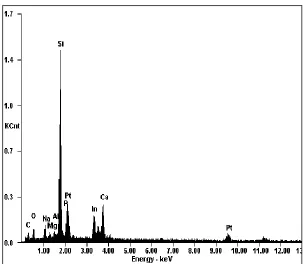
nanoparticles. The EDX of Pt-P particles are recorded and the peaks of Pt and P are observed, meaning that Pt and P are co-deposited on the electrode. The atom ratio of Pt to P is calculated to be 5.5:1.
Figure 2. XRD patterns of Pt (a) and Pt-P (b) nanoparticles.
The structure of Pt-P composites were also characterized by XPS (Fig. 3). The presence of Pt was confirmed by the Pt 4f5/2 and 4f7/2 regions at binding energies of about 74.6 eV and 71.4 eV (Fig. 3A), respectively [15, 16]. A binding energy of 133.8 eV is also observed (Fig. 3B), assigned to oxidized phosphorus (Pv) [17, 18]. The result indicates that most P in the Pt-P catalyst is at the oxide state.
Figure 3. (A) XPS spectra of Pt 4f for Pt-P catalyst (upper) and Pt catalyst (bottom). (B) XPS spectra of P 2p for Pt-P catalyst.
[image:4.596.184.407.130.308.2] [image:4.596.71.524.476.661.2]
at 71.27 eV and Pt 4f5/2 peak at 74.47 eV are assigned to Pt0, while Pt 4f7/2 peak at 73.02 eV and Pt 4f5/2 peak at 75.39 eV belong to PtII [12]. Compared with Pt nanoparticles, the binding energy values of Pt0 and PtII in Pt-P nanoparticles shift positively a little, attributed to strong Pt-P interaction. The reason is that when Pt interacts with P it would donate electrons to P, causing the decrease of the 4f electron density of Pt. Moreover, the area ratio of Pt0 peak to PtII peak in Pt-P nanoparticles is higher than that in Pt nanoparticles, indicating that the introduction of P can make the relative content of Pt0 significantly increase. This can be explained as follows: the PtII peaks may be produced by the Pt-Oad bonds at the surface layer [19, 20]. When P is doped into Pt, the oxidized phosphorus species on Pt nanoparticle surface restrains the interaction between Pt atom and O2 in air [21], thus the formation of Pt-Oad bonds is restricted.
3.2 Electrocatalytic performance of Pt-P catalysts
To study the electrochemical properties of the catalysts, CV curves of Pt and Pt-P nanoparticles are recorded in a N2 saturated 0.1 M HClO4 solution (Fig. 4A). As well known, the electrochemically active surface area (ECSA) of Pt nanoparticles can be estimated from the integrated charge in the hydrogen adsorption/desorption region of the cyclic voltammogram according to the following equation [22]:
A=QH / 0.21 mC cm-2
Where A represents the ECSA of the Pt nanoparticles, QH is the amount of charge corresponding to the hydrogen adsorption/desorption region, and 0.21 mC cm-2 is the charge density of Pt with a monolayer adsorption of hydrogen. The ECSA represents the number of Pt sites that are available for hydrogen adsorption and desorption. It can be observed that the Pt-P catalyst presents larger hydrogen adsorption/desorption peaks than the Pt catalyst, reflecting the larger electrochemically active surface area of Pt-P catalyst.
The stability of the catalyst is studied by chronoamperometry. As demonstrated in Fig. 4C, a decrease in the current density is observed for both catalysts with time going, which could be attributed to the intermediated poisoning species formed during the electrooxidation of ethanol. Noticeably, the Pt-P catalyst shows higher initial current density and limiting current density for a long time. This indicates that the Pt-P catalyst has higher electroactivity and stability than Pt catalyst for ethanol electrooxidation.
-0.4 -0.2 0.0 0.2 0.4 0.6 0.8 1.0 1.2 1.4 60 40 20 0 -20 -40 b C u rr e n t/ A Potential/V A a
-0.4 -0.2 0.0 0.2 0.4 0.6 0.8 1.0 1.2 1.4
0.2 0.0 -0.2 -0.4 -0.6 -0.8 -1.0 -1.2 -1.4 b C u rr e n t d e n s it y /m A c m -2 Potential/V B a
200 400 600 800 1000 0.0 0.2 0.4 0.6 0.8 1.0 1.2 1.4 1.6 b C u rr e n t d e n s it y /m A c m -2 Time/s C a
Figure 4. (A) Cyclic voltammograms of Pt-P (a) and Pt (b) catalysts in 0.1 M HClO4 solution at 50 mV s−1. (B) Cyclic voltammograms of Pt-P (a) and Pt (b) catalysts in 0.1 M HClO4 + 0.1 M CH3CH2OH solution at 50 mV s−1. (C) Chronoamperometric curves of Pt-P (a) and Pt (b) catalysts in 0.1 M HClO4 + 0.1 M CH3CH2OH solution at 0.6 V.
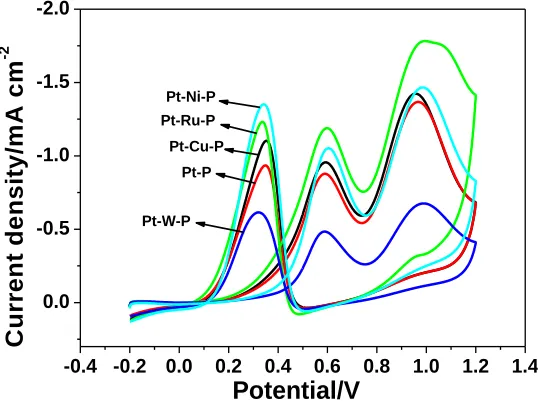
3.3 The effect of the third element
[image:6.596.74.523.203.529.2]
300 s in a solution containing 1 mM H2PtCl6, 0.1 mM NaH2PO2, 50 mM NiSO4 (or 5 mM Na2WO4) and 0.2 M Na2SO4. Fig. 5 shows the cyclic voltammograms of five different catalysts in ethanol solution. The anodic peak current densities corresponding to the forward scan of Pt-Ru-P, Pt-Cu-P and Pt-Ni-P are 1.4, 1.3 and 1.15 times as high as that of Pt-P catalyst, respectively, meaning that there is synergistic effect between the third element and Pt-P. However, when W is doped into Pt-P catalyst the peak current density decreases. This is related to the poor catalytic activity of W. Therefore, the catalytic property of Pt-P catalyst can still be improved by introducing other component.
-0.4 -0.2 0.0 0.2 0.4 0.6 0.8 1.0 1.2 1.4
0.0 -0.5 -1.0 -1.5 -2.0
Pt-Ru-P Pt-Ni-P
Pt-Cu-P Pt-P
C
u
rr
e
n
t
d
e
n
s
it
y
/m
A
c
m
-2
Potential/V
[image:7.596.166.435.220.422.2]Pt-W-P
Figure 5. Cyclic voltammograms of Pt-W-P, Pt-P, Pt-Cu-P, Pt-Ni-P and Pt-Ru-P catalysts (from inner to outer) in 0.1 M HClO4 + 0.1 M CH3CH2OH solution at 50 mV s−1.
4. CONCLUSIONS
In this work, a Pt-P catalyst was successfully prepared by co-deposition of Pt and P on a bare GCE at room temperature. The obtained catalyst exhibited enhanced catalytic activity and stability towards the electrooxidation of ethanol in comparison with the corresponding Pt nanoparticles. The preparation method is simple, green and has promising applications in full cells. In addition, the electrocatalytic activity of Pt-P catalyst can be improved by introducing other component.
ACKNOWLEDGEMENTS
Supplementary Materials:
Figure S1 EDS spectrum of the Pd–P nanoparticles.
References
1. E. Reddington, A. Sapienza, B. Gurau, R. Viseanathan, S. Sarangapani, E.S. Smotkin, T.E. Mallout, Science, 280 (1998) 1735-1736.
2. K.W. Park, J.H. Choi, B.K. Kwon, S.A. Lee, Y.E. Sung, H.Y. Ha, S.A. Hong, H. Kim, A. Wieckowski, J. Phys. Chem. B, 106 (2002) 1869-1877.
3. J.M. Leger, S. Rousseau, C. Coutanceau, F. Hahn, C. Lamy, Electrochim. Acta, 5 (2005) 5118-5125.
4. H. Wang, Z. Jusys, R.J. Behm, J. Phys. Chem. B, 108, (2004) 19413-19424.
5. J.P.I. de Souza, S.L. Queiroz, K. Bergamaski, E.R. Gonzalez, F.C. Nart, J. Phys. Chem. B, 10 (2002) 9825-9830.
6. L.H. Jiang, G.Q. Sun, S.G. Sun, J.G. Liu, S.H. Tang, H.Q. Li, B. Zhou, Q. Xin, Electrochim. Acta, 50 (2005) 5384-5389.
7. C.T. Hsieh, J.Y. Lin, J. Power Sources, 188 (2009) 347-352.
8. R. Srivastava, P. Mani, N. Hahn, P. Strasser, Angew. Chem. Int. Ed., 46 (2007) 8988-8994. 9. Y.J. Kang, C.B. Murray, J. Am. Chem. Soc., 132 (2010) 7568-7569.
10.H. Wang, Z. Jusys, R.J. Behm, J. Power Sources, 154 (2006) 351-359.
11.S. Suzuki, Y. Ohbu, T. Mizukami, Y. Takamori, M. Morishima, H. Daimon, M. Hiratani, J. Electrochem. Soc., 156 (2009) B27-B31.
12.J.A. Ma, Y.W. Tang, G.X. Yang, Y. Chen, Q. Zhou, T.H. Lu, J.W. Zheng, Appl. Surf. Sci., 257 (2011) 6494-6497.
13.B.M. Quinn, C. Dekker, S.G. Lemay, J. Am. Chem. Soc., 127 (2005) 6146-6147. 14.V. Ponec, G.C. Bond, Catalysis by Metals and Alloys, Elsevier, Amsterdam (1995).
[image:8.596.146.449.93.357.2]
16.Z.B. Wang, P.J. Zuo, G.J. Wang, C.Y. Du, G.P. Yin, J. Phys. Chem. C, 112 (2008) 6582-6587. 17.G. Yang, Y. Chen, Y. Zhou, Y. Tang, T. Lu, Electrochem. Commun., 12 (2010) 492-495. 18.H.B. Lee, D.S. Wuu, C.Y. Lee, C.S. Lin, Metal. Mater. Trans. A, 41 (2009) 450-455.
19.J.H. Kim, S.M. Choi, S.H. Nam, M.H. Seo, S.H. Choi, W.B. Kim, Appl. Catal., B, 82 (2008) 89-102.
20.G. Neri, C. Milone, S. Galvagno, A.P.J. Pijpers, J. Schwank, Appl. Catal., A, 227 (2002) 105-110. 21.H.J. Sun, J.F. Xu, G.T. Fu, X.B. Mao, L. Zhang, Y. Chen, Y.M. Zhou, T.H. Lu, Y.W. Tang,
Electrochim. Acta, 59 (2012 ) 279-283.
22.Z. Liu, J.Y. Lee, W. Chen, M. Han, L.M. Gan, Langmuir, 20 (2004) 181-187. 23.S. Chen, M. Schell, J. Electroanal. Chem., 478 (1999) 108-117.
24.R.T.S. Oliveira, M.C. Santos, B.G. Marcussi, S.T. Tanimoto, L.O.S. Bulhoes, E.C. Pereira, J. Power Sources, 157 (2006) 212-216.
25.L.F. Dong, R.R.S. Gari, Z. Li, M.M. Craig, S.F. Hou, Carbon, 48 (2010) 781-787. 26.J.M. Sieben, M.M.E. Duarte, Int. J. Hydrogen Energy, 37 (2012) 9941-9947.
27.K. Zhang, Q. Yue, G. Chen, Y. Zhai, L. Wang, H. Wang, J. Zhao, J. Liu, J. Jia, H. Li, J. Phys. Chem. C, 115 (2011) 379-389.
28.M. Wakisaka, S. Mitsui, Y. Hirose, K. Kawashima, H. Uchida, M. Watanabe, J. Phys. Chem. B, 110 (2006) 23489-23496.
29.A.K. Shukla, M. Neergat, P. Bera, V. Jayaram, M.S. Hegde, J. Electroanal. Chem., 504 (2001) 111-119.
30.S. Lee, H.J. Kim, S.M. Choi, M.H. Seo, W.B. Kim, Appl. Catal., A, 429 (2012) 39-47.`