Int. J. Electrochem. Sci., 11 (2016) 1416 - 1433
International Journal of
ELECTROCHEMICAL
SCIENCE
www.electrochemsci.orgAdditives of Suppressing Hydrogen Evolution at
Carbon-Containing Negative Plates of Valve-Regulated Lead-Acid
Batteries
Jingcheng Hu, Chengbin Wu, Xinle Wang, Yonglang Guo *
College of Chemistry, Fuzhou University, Fuzhou, 350116, PR China
*
E-mail: [email protected]
Received: 12 November 2015 / Accepted: 11 December 2015 / Published: 1 January 2016
The effects of several rare earth oxides and fluorine-containing compounds as additives on the hydrogen evolution at the negative plates containing commercial and purified carbon materials in valve-regulated lead-acid (VRLA) batteries have been studied by means of the constant current polarization and hydrogen gassing measurements. The activated carbon (AC) and iron impurity in the carbon materials greatly accelerate the hydrogen evolution. La2O3, Sm2O3, Gd2O3, Nd2O3, Dy2O3 and
polytetrafluoroethlene (PTFE) as electrolyte additives inhibit the hydrogen evolution. When the hydrogen evolution polarization potential is small as in the case of the oxygen depolarization in the oxygen cycles, the addition of 0.025% PTFE and 0.025% Dy2O3 additives to electrolyte increase its
overpotential, but these two additives can promote the hydrogen evolution at negative plates containing activated carbon (AC), expanded graphite (EG) or flake graphite (FG) with low impurity contents. In the test of cycle life of the 12 V 12 Ah VRLA batteries with the negative plate containing acetylene black (AB), the combined additive of PTFE and Dy2O3 greatly increases the charge
efficiency and thus decreases water loss.
Keywords: carbon materials; electrolyte additives; hydrogen evolution; negative plate; valve-regulated lead-acid batteries
1. INTRODUCTION
for high-power batteries such as uninterruptible power supplies (UPS) and deep-cycle batteries has been increasing significantly [1-2]. In the past decade, much work has been done to investigate the flooded and VRLA batteries in the application of the high-rate partial-state-of-charge (HRPSoC) duty, to reduce CO2 emission of road transportation vehicles for atmospheric environment [3-7]. These
batteries operate in a partial-state-of-charge. And they will be frequently discharged at high power and recharged at an extraordinarily high rate. To meet the requirements and aim of various governments for automakers to decrease CO2 emission, the micro-hybrid electric vehicles (micro-HEVs) with
stop-start and regenerative braking functions will become the main stream [8-10]. Based on different levels of powertrain hybridisation, the lead-acid batteries range from micro- to medium- and full hybrid applications. Lower hybrid degree means higher charge-discharge currents for the batteries. So the VRLA battery fails prematurely due to the progressive build-up of ‘hard’ lead sulfate on the surface of the negative plates, which markedly reduces the effective surface-area to such extent that the negative plate can no longer deliver and accept the power required by engine cranking, acceleration, and regenerative braking [11].
The Ultrabattery developed by CSIRO Energy Technology combines an asymmetric supercapacitor and a lead-acid battery in one unit cell by connecting internally the carbon-based negative plate (i.e., capacitor electrode) and the lead-acid negative plate in parallel [12-14]. The capacitor electrode acts as a buffer to share the discharge and charge currents at the high rates. Nakamurs [15-16] investigated the performance of the negative plates made with ten times the normal levels of carbon. It indicates that high levels of carbon greatly improve the recharge ability of negative plates by providing conductive networks around the peripheries of lead sulfate crystals and thus extend the battery cycle-life. Since the properties and actions of carbon vary with different morphologies and producing area, a lot of work has been done on what types of carbon can be added to the negative plates in the HRPSoC applications [17-27]. Moseley et al. [19] have summarized that the main function of carbon added to the negative plates is to improve the conductivity, impede the progressive growth of lead sulfate crystals, provide capacitance characteristic buffering high transient current and serve as nuclei of lead sulfate crystal growth as well as an electro-osmotic pump that facilitates acid diffusion. The preferred candidates are the carbons with very high surface area used in supercapacitors and graphite carbon with high surface area. Pavlov [18, 27] proposed the parallel mechanism of PbSO4
reduction on the electrochemically active carbon (EAC) and Pb surfaces. But the impurities in various carbons can decrease the hydrogen overpotential obviously and water loss becomes the main cause of the subsequent failure mode in the HRPSoC applications [28].
suppress hydrogen evolution and sulfation. They include Ga2O3, Bi2O3, synthetic lignin, polyaspartate
(PASP) and expander components. [40-44].
In this work, the effects of five rare earth oxides and three fluorine-containing compounds as additives on the hydrogen evolution rate at the negative plates containing various carbon materials were studied by means of the measurements of hydrogen polarization curves. A combined electrolyte additive was added to the 12 V 12 Ah VRLA battery. Water loss and charge efficiency were explored.
2. EXPERIMENTAL
2.1. Preparation of test negative plate
The paste of the test negative plate was prepared by mixing leady oxide, H2SO4, H2O and
additives which were composed of commercial barium sulfate, sodium lignosulfonate (Vanisperse A), fiber and different carbon materials. The carbon materials used were carbon black (CB), activated carbon (AC), acetylene black (AB), flake graphite (FG) and expanded graphite (EG). The paste contained 40 g H2SO4 per 1 kg lead powder and its apparent density was 4.1-4.3 g cm-3 based on
different carbon materials. 18.5 g paste was pasted by hand on Pb-Ca-Al grid with the dimensions of 44.3 (W)×73 (H)×1.5 (T) mm. And the negative plate was cured and dried in a high and low temperature-humidity test chamber (GD/HS4010, Shanghai) for two days. Then the plate was formed in 1.05 sp gr H2SO4 solution at constant current of 500 mA for 14 h + 200 mA for 12.5 h. After that the
formed plate was washed by 1.28 sp gr H2SO4 solution and then was soaked in bulk solution with 1.28
sp gr H2SO4 for 24 h to avoid the oxidation of fresh sponge lead on the negative plate and to ensure the
consistency of H2SO4 concentration in the next experiments.
[image:3.596.45.560.561.730.2]The purification of the carbon materials was carried out according to the following treatment: 10 g carbon was added to about 200 ml 1.28 sp gr H2SO4 solution. Stir the suspension for 4 h, wash the
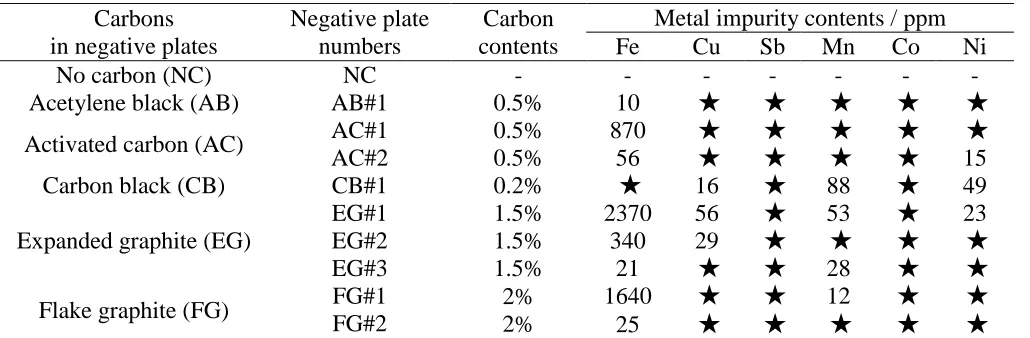
Table 1. Metal impurity contents in different carbon materials Carbons
in negative plates
Negative plate numbers
Carbon contents
Metal impurity contents / ppm
Fe Cu Sb Mn Co Ni
No carbon (NC) NC - - - -
Acetylene black (AB) AB#1 0.5% 10 ★ ★ ★ ★ ★
Activated carbon (AC) AC#1 AC#2
0.5% 0.5%
870 ★ ★ ★ ★ ★
56 ★ ★ ★ ★ 15
Carbon black (CB) CB#1 0.2% ★ 16 ★ 88 ★ 49
Expanded graphite (EG)
EG#1 EG#2 EG#3
1.5% 1.5% 1.5%
2370 56 ★ 53 ★ 23
340 29 ★ ★ ★ ★
21 ★ ★ 28 ★ ★
Flake graphite (FG) FG#1 FG#2
2% 2%
1640 ★ ★ 12 ★ ★
25 ★ ★ ★ ★ ★
carbon material by means of dilute H2SO4 solution and filter out impurities. Then the as-prepared
carbon was dispersed into the H2SO4 solution again, filtrated, washed with double-distill water and
then dried in a vacuum oven at 80 C for 4 h. The impurity contents of the commercial and purified carbon materials were listed in Table 1.
2.2. Measurement of hydrogen evolution
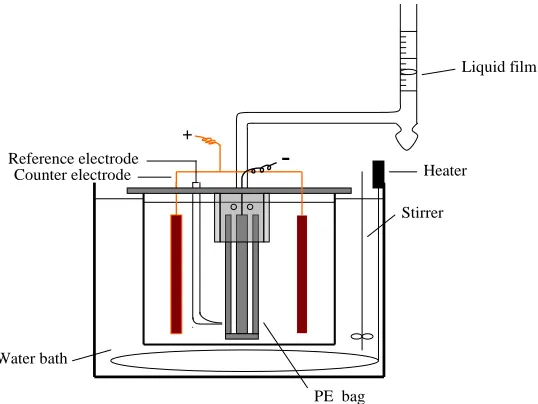
The formed negative plate as working electrode was put into a bag made by the polyethylene (PE) separator. Two positive plates as counter electrode were placed at both sides of the working electrode and the Hg/Hg2SO4/1.28 sp gr H2SO4 electrode was used as reference electrode. The
three-electrode electrolytic cell was in a water bath at 250.2 C, as shown in Fig. 1. In the measurement process, the hydrogen generated at working electrode in the cathodic polarization does not pass through the PE bag but escape from the liquid surface in the bag and the oxygen gassing from positive plate outside the PE bag does not reach the negative plate either. So only hydrogen is collected by a cap connecting a foam flowmeter (Fig. 1) which is used to measure the volume of hydrogen gassing.
+
Heater
Liquid film
Reference electrode
Water bath
PE bag Counter electrode
Stirrer
-Figure 1. Apparatus used to determine hydrogen gassing.
The formed negative plate was taken out of the soaked solution with 1.28 sp gr H2SO4 and
moved into the electrolyte cell containing 1.28 sp gr H2SO4 solution immediately. Then it was
polarized cathodically at 10 mA for 16 h to make the negative active mass transformed into sponge lead completely and de-aerate the H2SO4 electrolyte in the bag. Finally, the cathodic polarization was
[image:4.596.164.433.374.576.2]
2.3. Additives
All rare earth oxide reagents with analytical grade (AR) and commercial perfluorinated compounds were used as received without any further treatment. The rare earth additives of La2O3,
Sm2O3, Gd2O3, Nd2O3 and Dy2O3 with different contents were directly added to the 1.28 sp gr H2SO4
electrolyte due to their dissolubility. Since the solubility of the pentadecafluorooctanoic acid (PFOA) and perfluorooctanesulfonic acid potassium (PFOSAP) is very poor, these fluorine-containing additives were dispersed into H2SO4 solution via the ultrasound treatment and then added to the paste
in the preparation of the negative plates. The polytetrafluoroethlene (PTFE) was used as additives in both the H2SO4 electrolyte and the paste of negative plate, but it needs to be pretreated by the
ultrasonic dispersion before use.
2.4. Test batteries
The test batteries were the 6-DZM-12 VRLA batteries (12 V 12 Ah) used for electric bike, produced by Chaowei Power Co. Ltd., China. The 1.255 sp gr H2SO4 solution with the combined
electrolyte additives of 0.025% PTFE + 0.025% Dy2O3 was pretreated ultrasonically and then used for
the container formation. The cycle life test was conducted by Land battery test instrument (CT2001B) according to the operating conditions of the electric bike batteries, namely, the batteries were discharged at C2 rate to 10.5 V with 100% depth of discharge (DOD) and then were charged to 14.75
V at 2.5 A. When the charge current at 14.75 V dropped to 0.35 A, they were charged at this voltage for 4 h again. The battery capacity and charge efficiency were measured and the batteries were weighed to calculate the water loss in the cycle-life test.
2.5. Impurity measurement and characterization
The measurement for the impurities of the purified carbon was carried out by the inductively coupled plasma atomic emission spectrometry (Thermo iCAP 6000). The appearances of the carbon materials were observed by the scanning electron microscope (SEM, Zeiss, Supra 55). The apparent density, specific area and mean particle size of carbon materials were measured by the accelerated surface area and porosimetry system (ASAP 2020M).
3. RESULTS AND DISCUSSION
3.1. Effects of additives
near the Pb/PbSO4 equilibrium potential, though it is overcharged. It means that the current of
hydrogen evolution is normally very small at negative plates. So the selected current range is only from 2 to 8 mA in the experiments of hydrogen gassing. In order to accurately measure the hydrogen evolution rate, it is important to control the electrolyte temperature, to ensure the full charge for the negative plate and to precisely measure the volume of hydrogen gassing. In Fig. 1, a bubble of detergent was squeezed into the burette when the potential of the negative plate was stable. The hydrogen evolution volume, V, was measured after a period, t. The hydrogen evolution current, I, can be calculated by the following relationship[31]
total w
6
2 ( )
10
FV P P
I
RTt
(1)
where Ptotal denotes atmospheric pressure (101,325 Pa); Pw vapour pressure (3167 Pa); T absolute
temperature (298 K); F=96500 C mol−1; R=8.31 J mol−1 K−1;
-1.05 -1.12 -1.19 -1.26 -1.33
-2.8 -2.6 -2.4 -2.2
-2.0 NC AC#2 CB#1
AB#1 EG#3 FG#2
L
o
g
(I
/
A
)
Potential / V
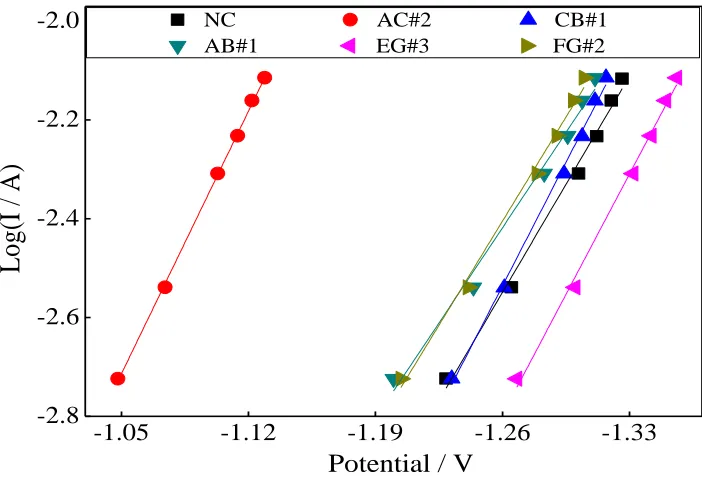
Figure 2. Polarization curves of hydrogen evolution at negative plates containing different carbons with low impurity contents in 1.28 sp gr H2SO4 solution.
[image:6.596.122.473.303.542.2]
Table 2. Properties of carbon materials
Carbons Apparent density / g m-3
Specific area / m2 g-1
Mean particle size / nm
Acetylene black (AB) 0.038 63.8 94.1
Activated carbon (AC)
0.223 1005.0 6.0
Carbon black (CB) 0.047 450.2 14.4
Expanded graphite (EG)
0.226 601.5 1.77×10⁴
Flake graphite (FG) 0.181 8.3 1.95×10⁴
Carbon black (CB) is widely used as an additive in the negative plates of flood and VRLA batteries [18-20, 22]. To inhibit the passivation of PbSO4 on the surface of the negative plate in the
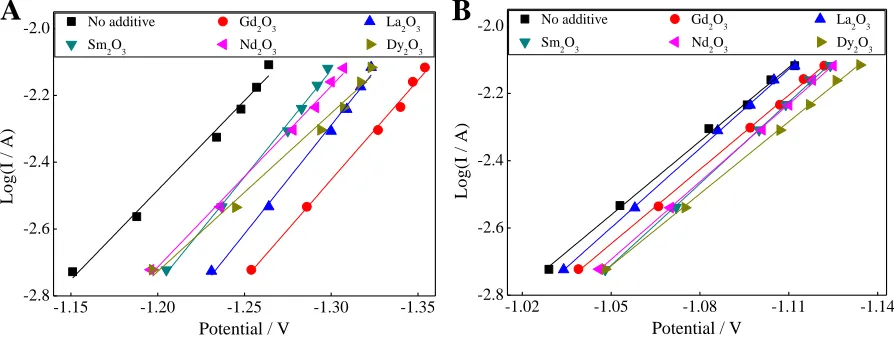
HRPSoC application of lead-acid batteries, a large amount of activated carbon (AC) as additive is added to the paste of the negative plate[24, 26-28], which accelerates the hydrogen evolution. Considering the maximum amount of activated carbon for the paste operability, Fig. 3 shows the changes of the cathodic polarization potential of hydrogen evolution at the negative plates containing 0.2% commercial carbon black (CB#1) and 0.5% commercial activated carbon (AC#1), and the effects of rare earth oxides as the electrolyte additives. It is clear from Fig. 3A and 3B that the polarization potential of hydrogen evolution at the negative plate containing 0.5% activated carbon in the H2SO4
solution without rare earth oxide additives decreases by about 120 mV, compared with the negative plate containing 0.2% carbon black.
-1.15 -1.20 -1.25 -1.30 -1.35 -2.8
-2.6 -2.4 -2.2
-2.0 No additive Gd2O3 La2O3
Sm2O3 Nd2O3 Dy2O3
L
o
g
(I
/
A
)
Potential / V
A
-1.02 -1.05 -1.08 -1.11 -1.14 -2.8
-2.6 -2.4 -2.2
-2.0 No additive Gd2O3 La2O3
Sm
2O3 Nd2O3 Dy2O3
L
o
g
(I
/
A
)
Potential / V
B
Figure 3. Polarization curves of hydrogen evolution at negative plates containing (A) 0.2% carbon black (CB#1) and (B) 0.5% activated carbon (AC#1) in 1.28 sp gr H2SO4 solution containing
different rare earth oxides. Additive concentration: 0.025%.
[image:7.596.75.522.483.652.2]
upper level of Fe, Sb, Ni, Cu and Co is lower than 10 ppm and that of Mn is lower than 3 ppm. It is clear from Table 1 that the increase of hydrogen evolution is mainly due to the fact that the commercial activated carbon (AC#1) contains a lot of iron impurity which depends on its production processes. Another reason is that the activated carbon (AC) has porous structure with very high specific area. The five additives of rare earth oxides increase the polarization potentials of hydrogen evolution at both negative plates to a certain extent. In Fig. 3A, their effect order is Gd2O3 > La2O3 >
Dy2O3 > Nd2O3 ~ Sm2O3 at the negative plate containing 0.2% carbon black and in Fig. 2B, it is Dy2O3
> Nd2O3 ~ Sm2O3 > Gd2O3 > La2O3 at the negative plate containing 0.5% activated carbon. This is
because these rare earth oxides are soluble and rare earth metal ions with high valence may adsorb at the surface of negative active mass, which will prohibit the hydrogen ions from coming closer to the electrode surface.
-1.02 -1.05 -1.08 -1.11 -1.14 -2.8
-2.6 -2.4 -2.2
-2.0 No additive PTFE PFOA PFOSAP
L
o
g
(I
/
A
)
Potential / V
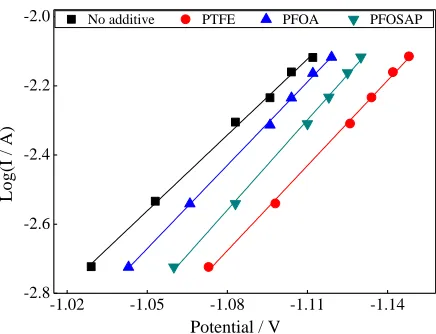
Figure 4. Polarization curves of hydrogen evolution at negative plates containing 0.5% activated carbon (AC#1) in 1.28 sp gr H2SO4 solution. PTFE, PFOA and PFOSAP were added
into the paste of negative plates. Additive amount: 0.05%.
Activated carbon (AC) is often added to the negative plate in the HRPSoC application of lead-acid batteries, but it can result in the increase of hydrogen evolution [22, 26-28]. Since only fluorine-containing organic compounds can be stable in the lead-acid battery system, three fluorine-fluorine-containing compounds as additives were added to the paste of the negative plates due to their limited dissolubility in H2SO4 solution. Fig. 4 shows the cathodic polarization curves of hydrogen evolution at the negative
plates containing 0.5% commercial activated carbon (AC#1). The effect order is PTFE > PFOSAP > PFOA and the PTFE additive increases the cathodic polarization potential by about 40 mV. The effects of these fluorine-containing organic compounds may be due to their adsorption at the surface of the negative electrode.
[image:8.596.189.407.286.453.2]
This is due to the increase of the specific area and the impurity effects when the commercial carbons are added. However, it can be seen from Fig. 5 that the PTFE electrolyte additive increases the hydrogen evolution potential by about 90 mV at the negative plates without carbon.
-1.24 -1.28 -1.32 -1.36 -1.40 -2.8
-2.6 -2.4 -2.2
-2.0 NC NC+PTFE
L
o
g
(I
/
A
)
Potential / V
Figure 5. Polarization curves of hydrogen evolution at negative plates without carbon in 1.28 sp gr H2SO4 solution with and without 0.025% PTFE additive.
3.2. Effects of additive concentrations
Considering the nonuniformity of fluorine-containing compounds in the paste and their stability in the electrolyte of lead-acid batteries, the effects of fluorine-containing compounds as electrolyte additives on hydrogen evolution were investigated.
-1.02 -1.05 -1.08 -1.11 -1.14 -2.8
-2.6 -2.4 -2.2
-2.0 No additive 0.0125% Dy2O3 0.025% Dy2O3
0.04% Dy2O3 0.05% Dy2O3
L
o
g
(I
/
A
)
Potential / V
A
-1.02 -1.05 -1.08 -1.11 -1.14 -2.8
-2.6 -2.4 -2.2
-2.0 No additive 0.0125% PTFE 0.025% PTFE
0.05% PTFE
L
o
g
(I
/
A
)
Potential / V
B
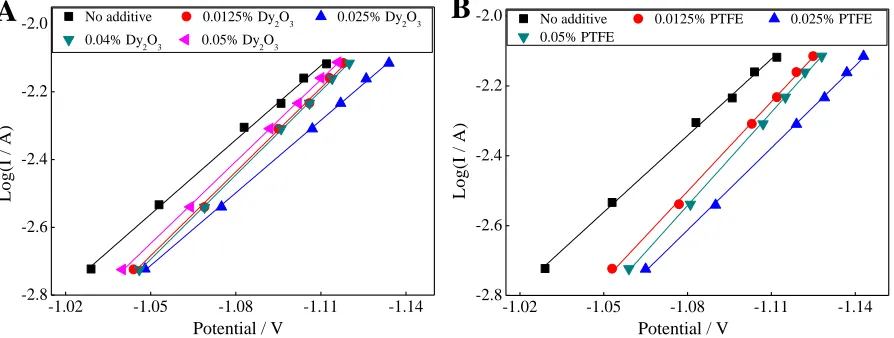
Figure 6. Polarization curves of hydrogen evolution at negative plates with 0.5% activated carbon (AC#1) in 1.28 sp gr H2SO4 solutions containing different concentrations of (A) Dy2O3 and (B)
PTFE.
Although Fig. 3A indicates that the additives of both Gd2O3 and La2O3 have more negative
[image:9.596.189.408.141.303.2] [image:9.596.76.523.489.658.2]
activated carbon in Fig. 3B has porous structure with very high specific surface area and its capacitance characteristic is superior to that of other types of carbon. The negative plates used in the HRPSoC application of lead-acid batteries are expected to contain activated carbon and have the capacitance characteristics with high performance in the charge-discharge at very high rate.
However, the iron impurity in commercial active carbon can promote the hydrogen evolution. How to suppress hydrogen evolution at the negative plates containing active carbon has drawn much attention. Based on the results in Fig. 3B and Fig. 4, the electrolyte additives of Dy2O3 and PTFE were
studied next. Fig. 6 shows the effects of different concentrations of Dy2O3 and PTFE in the electrolytes
on hydrogen evolution rate at negative plates with 0.5% activated carbon (AC#1). Both additives with different concentrations increase the polarization potentials of hydrogen evolution. And the effect order of Dy2O3 additive is 0.025%Dy2O3 > 0.04%Dy2O3 ~ 0.0125%Dy2O3 > 0.05%Dy2O3 and for
PTFE additive, it is 0.025%PTFE > 0.05%PTFE > 0.0125%PTFE. Therefore, both additives with 0.025% content in the electrolyte have the most negative cathodic polarization potentials at negative plates containing 0.5% activated carbon and they will be investigated in the following sections.
[image:10.596.99.498.537.720.2]3.3. Effects of carbon materials and impurities
[image:11.596.99.500.66.454.2]
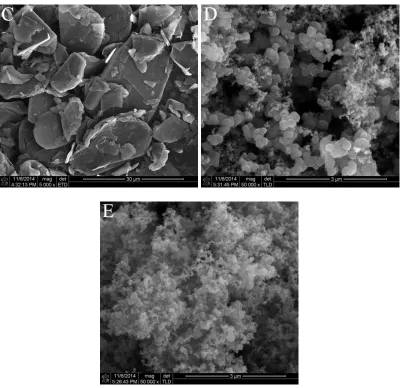
Figure 7. SEM images of different carbon materials. (A) activated carbon, (B) expanded graphite, (C) flake graphite, (D) carbon black, (E) acetylene black.
It indicates that the activated carbon (AC) has the highest specific area and the smallest mean particle size, which can increase the surface area of negative active mass and decrease the current density and polarization of hydrogen evolution. The order of the specific area is AC > EG > CB > AB > FG, but the order of mean particle size is FG > EG > AB > CB >AC. Both EG and FG have very large mean particle sizes. And AB and CB have the smallest apparent density.
Fig. 7 shows the SEM images of the five commercial carbon materials. The order of particle size is FG > EG > AC > CB >AB.
Activated carbon with very large specific area has the property of supercapacitor and is often added to the negative plate to inhibit the passivation of lead sulfate in the HRPSoC application of lead-acid batteries [22,26-27]. But activated carbon can accelerate the hydrogen evolution greatly [28]. Fig. 8 shows the polarization curves of hydrogen evolution at negative plates containing activated carbon in the H2SO4 solution both without and with electrolyte additives. For the negative plate containing AC#1
in which there is a lot of iron impurity, the addition of PTFE, Dy2O3 and Dy2O3 + PTFE on average
increases the polarization potential of hydrogen evolution by 34, 21 and 19 mV, respectively.
-1.02 -1.05 -1.08 -1.11 -1.14
-2.8 -2.6 -2.4 -2.2 -2.0 L o g (I / A )
Potential / V
AC#1 AC#1+Dy
2O3 AC#1+PTFE
AC#2 AC#2+Dy2O3 AC#2+PTFE
AC#1+Dy
2O3+PTFE AC#2+Dy2O3+PTFE
Figure 8. Polarization curves of hydrogen evolution at negative plates with 0.5% activated carbon in 1.28 sp gr H2SO4 solution without and with electrolyte additives of 0.025%PTFE, 0.025%
Dy2O3 and 0.025% Dy2O3 + 0.025%PTFE.
-1.05 -1.12 -1.19 -1.26 -1.33
-2.8 -2.6 -2.4 -2.2 -2.0
EG#1 EG#1+PTFE EG#2 EG#2+PTFE
EG#3 EG#3+PTFE
L o g (I / A )
Potential / V
A
-1.05 -1.12 -1.19 -1.26 -1.33
-2.8 -2.6 -2.4 -2.2 -2.0 EG#1+Dy
2O3 EG#1+Dy2O3+PTFE
EG#2+Dy2O3 EG#2+Dy2O3+PTFE EG#3+Dy2O3 EG#3+Dy2O3+PTFE
L o g (I / A )
Potential / V
B
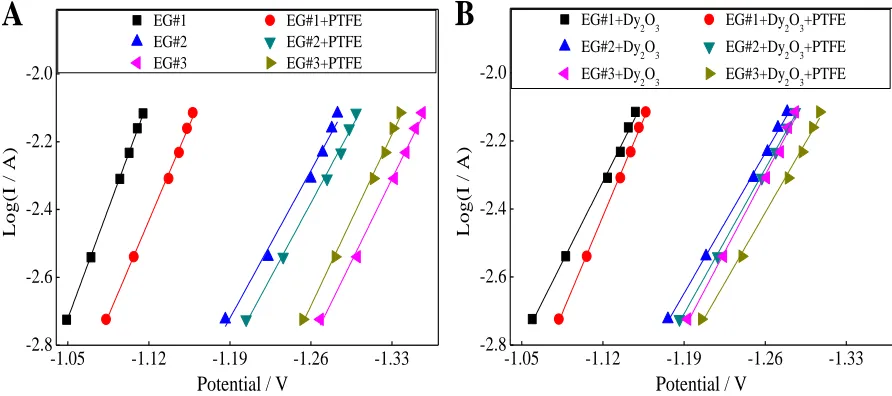
Figure 9. Polarization curves of hydrogen evolution at negative plates with 1.5% expanded graphite containing different impurity contents in 1.28 sp gr H2SO4 solution without and with
[image:12.596.180.416.211.403.2] [image:12.596.74.520.482.680.2]
After the commercial activated carbon (#1) was purified, the three kinds of electrolyte additives mentioned above do not affect the hydrogen evolution of the negative plate containing purified activated carbon (AC#2) much. In the presence of PTEF, the AC#1 sample with high iron content has lower hydrogen evolution rate in comparison with AC#2 with low iron content. This is because the AC#1 and AC#2 samples have very small hydrogen evolution overpotential and the standard electrode potential of Fe2+/Fe (-0.447 V) is only 91 mV negative to that of PbSO4/Pb (-0.356 V). At this time,
the Fe3+ ions is reduced to Fe2+ ions rather than Fe at the surface of the electrode and the presence of Fe2+ ions can inhibit the H+ ions to access the surface of electrode, which slows down hydrogen evolution.
EG#1 is the negative plate prepared by the commercial expanded graphite with very high iron content and some copper impurity. EG#2 and EG#3 are those made by the purified EGs with different impurity contents. Fig. 9 shows the effects of three kinds of expanded graphite with different impurity contents on the hydrogen evolution at the negative plates. In Fig. 9A, the polarization potentials of the hydrogen evolution at EG#2 and EG#3 negative plates increase by 170 and 234 mV with the decrease of the iron contents from 2370 to 340 and 21 ppm corresponding to EG#1, EG#2 and EG#3 negative plates, respectively. The PTFE additive in the electrolyte causes the polarization potentials of hydrogen evolution at EG#1 and EG#2 negative plates to increase by 40 and 15 mV, but EG#3 negative plate decreases by 18 mV reversely. For EG#1 negative plate containing high impurity content in Fig. 9B, the electrolyte additives of Dy2O3 and Dy2O3 + PTFE on average increase the polarization potentials of
hydrogen evolution by 26 and 39 mV, respectively, compared with EG#1 negative plate in the solution without the electrolyte additive in Fig. 9A. But, they decrease reversely by 72 and 54 mV at EG#3 negative plate. And they do not affect EG#2 negative plate much. This is because the iron and copper impurities are reduced to metal Fe and Cu at the polarization potential in Fig. 9.
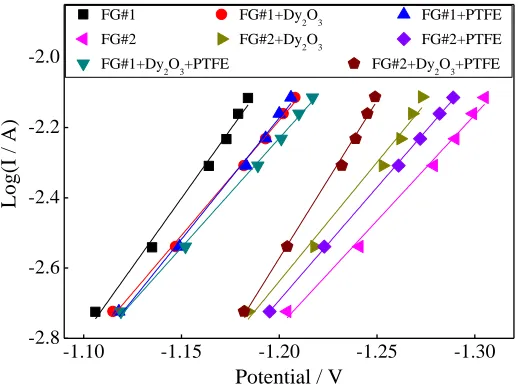
-1.10 -1.15 -1.20 -1.25 -1.30
-2.8 -2.6 -2.4 -2.2 -2.0
FG#1 FG#1+Dy2O3 FG#1+PTFE
FG#2 FG#2+Dy
2O3 FG#2+PTFE FG#1+Dy
2O3+PTFE FG#2+Dy2O3+PTFE
L
o
g
(I
/
A
)
Potential / V
Figure 10. Polarization curves of hydrogen evolution at negative plates containing 2% flake graphite in 1.28 sp gr H2SO4 solution without and with electrolyte additives of 0.025%PTFE, 0.025%
[image:13.596.169.428.477.672.2]
Hydrogen can generate from metal Fe, Cu, expanded graphite or negative active mass containing other additives, and the order of its evolution overpotential is negative active mass > expanded graphite > Fe > Cu. Therefore, the three electrolyte additives inhibit the hydrogen evolution at the negative plates with high iron content or low hydrogen overpotential while they can accelerate the hydrogen evolution when the impurity content is very low and the hydrogen evolution overpotential is very high.
Fig. 10 shows the polarization curves of hydrogen evolution at negative plates containing flake graphite (FG). The effects of the three additives on the hydrogen evolution rate mainly depend on the impurity contents in flake graphite. The hydrogen evolution overpotential at FG#2 negative plate containing low iron content increases obviously compared with FG#1 negative plate containing high iron content. However, the effects of the three additives on the two negative plates with different impurity contents are just opposite. For FG#1 negative plate with high iron content and low hydrogen overpotential, the three additives increase the hydrogen evolution overpotential, while they decrease the hydrogen evolution overpotential when the iron content is very low and the overpotential of hydrogen evolution is high at FG#2 negative plate. It is similar to the expanded graphite. When the hydrogen evolution polarization potential shifts in the negative direction, the iron impurity is reduced to metal Fe, which decreases hydrogen evolution overpotential greatly.
3.4. Effects of additives on battery cycle life
Fig. 11 shows the effects of the electrolyte additives on the hydrogen evolution rate at the negative plate containing acetylene black. The order of additive effect is Dy2O3 + PTFE > PTFE ~
Dy2O3 > no additive. Both Dy2O3 and PTFE additives make the polarization potential of hydrogen
evolution increase by 30-34 mV and the combined additive of Dy2O3 and PTFE makes it increase by
57 mV.
-1.20 -1.24 -1.28 -1.32 -1.36 -2.8
-2.6 -2.4 -2.2 -2.0
AB#1 AB#1+PTFE AB#1+Dy2O3
AB#1+Dy 2O3+PTFE
L
o
g
(I
/
A
)
Potential / V
Figure 11. Polarization curves of hydrogen evolution at negative plates containing 0.5% acetylene black in 1.28 sp gr H2SO4 solution without and with electrolyte additives of 0.025%PTFE,
[image:14.596.177.420.522.691.2]
Acetylene black or carbon black was widely used as an additive at the negative active mass in the VRLA batteries. Based on the results in Fig. 11, a combined electrolyte additive of Dy2O3 + PTFE
was added to the 12 V 12 Ah VRLA battery with the negative plate containing acetylene black when the battery was formed. Fig. 12 shows the effects of the combined additive on water loss and charge efficiency in the test of the battery cycle life. It can be seen from Fig. 12A that the combined additive greatly reduces the water loss of the test battery from the 60th to 120th cycles compared with the contrast battery without additive. After that, the water loss rate of both batteries is similar and then that of the contrast battery becomes a little slow. Fig. 12B indicates that the combined additive obviously improves the charge efficiency of the test battery. The charge efficiency of the contrast battery drops linearly before the 120th cycle and then becomes slow. The lower charge efficiency means the higher oxygen cycle current. As a result, the potentials of positive and negative plates shift in the positive direction at a constant charge voltage. Therefore, the low hydrogen evolution rate leads to reduction of water loss rate of the contrast battery after the 180th cycle in Fig. 12A.
0 100 200 300 400
10 20 30 40 50 60
No additive Dy2O3+PTFE
W
a
te
r
lo
ss
/
g
Cycle number
A
0 100 200 300 400
80 85 90 95
100 No additive Dy2O3+PTFE
C
h
ar
g
e
ef
fi
ci
en
cy
/
%
Cycle number
[image:15.596.110.492.321.467.2]B
Figure 12. The changes of (A) water loss and (B) charge efficiency in the cycles of 12 V 12Ah VRLA batteries without and with the combined electrolyte additive of 0.025% Dy2O3 + 0.025% PTFE.
0 100 200 300 400
9 11 12 14
15 No additive Dy2O3+PTFE
D is c h a rg e c a p a c it y / A h Cycle number A
0 150 300 450 600
0.0 0.6 1.2 1.8 2.4 3.0
No additive Dy
2O3+PTFE
C h a rg e c u rr e n t / A
Charge time / min
B
Figure 13. The changes of (A) discharge capacity in the cycles and (B) charge current in the 200th cycle for 12 V 12Ah VRLA batteries without and with combined electrolyte additive of 0.025% Dy2O3 + 0.025% PTFE.
The teardown analysis shows that the failure battery is caused by the serious corrosion of the positive grids. Fig. 13B shows the change of the charge current of both batteries. At the stage of the limited or constant voltage, the battery without additive has the higher charge current. It means the oxygen cycle current of the contrast battery is larger and the test battery with additive has higher charge efficiency which is in agreement with the results in Fig. 12B. The higher oxygen cycle current leads to the higher positive polarization potential, which is one of the reasons for the positive grid corrosion.
4. CONCLUSIONS
In the HRPSoC application of lead-acid batteries, various carbon materials are added to the negative plate, which affects the hydrogen evolution rate greatly and this depends on the material morphologies and the impurity content. The negative plate without carbon has very high cathodic polarization potential of hydrogen evolution. When the impurity content is very low, the addition of 0.2% carbon black (CB), 0.5% acetylene black (AB), 2% flake graphite (FG) or 1.5% expanded graphite (EG) to the negative plates only affects 20-30 mV overpotential for the hydrogen evolution. But 0.5% activated carbon (AC) in the negative active mass makes its polarization potential decrease by about 194 mV because activated carbon has very high specific area.
Five electrolyte additives of La2O3, Sm2O3, Gd2O3, Nd2O3 and Dy2O3 rare earth oxides inhibit
the hydrogen evolution at the negative plates containing 0.2% CB or 0.5% AC. The fluorine-containing additives of PTFE, PFOA and PFOSAP also increase polarization potential of hydrogen evolution. The function of various additives for the negative plates containing different carbons is different. And the effects of the activated carbon and the impurities in various commercial carbon materials are dominant. When iron content in carbon materials is very high and the hydrogen evolution overpotential is very small, 0.025% PTFE, 0.025% Dy2O3 and their combined additive increase the
[image:16.596.109.489.70.218.2]
evolution is very high. In the charge of VRLA batteries, the cathodic polarization of the negative plates is very small because of the depolarization of oxygen cycle. It implies that PTFE and Dy2O3 additives
can suppress the hydrogen evolution effectively.
Although the acetylene black has very low impurity content and high overpotential of hydrogen evolution, PTFE, Dy2O3 additives and their combined additive can still increase the polarization
potential of hydrogen evolution, which is different from what happens in the case of AC, EG and FG materials. And the combined additives of PTFE and Dy2O3 greatly increase the charge efficiency of
the 12 V 12 Ah VRLA battery with the negative plate containing acetylene black and thus decreases water loss in the test of cycle life.
ACKNOWLEDGEMENTS
The authors thank for the financial support of this work by the Natural Science Foundation of Fujian Province (No. 2013J01039).
References
1. R. Wagner, J. Power Sources, 144 (2005) 494–504.
2. M. Chen, W. Guo, M. Zhang, F. Cheng, P. Liu, Z. Cai, Y. Zhang, Electrochim. Acta, 164 (2015) 243-251.
3. J. Xiang, P. Ding, H. Zhang, X. Wu, J. Chen, Y. Yang, J. Power Source, 241 (2013) 150–158. 4. L.T. Lam, N.P. Haigh, C.G. Phyland, A.J. Urban, J. Power Sources, 133 (2004) 126–134. 5. P. Bača, P. Křivík, J. Zimáková, D. Fryda, Int. J. Electrochem. Sci., 10 (2015) 10307–10320. 6. M. Saravanan, M. Ganesan, S. Ambalavanan, J. Electrochem. Soc., 159 (2012) A452–A458. 7. J. Furukawa, T. Takada, D. Monma, L.T. Lam, J. Power Sources, 195 (2010) 1241–1245. 8. P.T. Moseley, D.A.J. Rand, J. Power Sources, 133 (2004) 104–109.
9. G.J. May, J. Power Sources, 133 (2004) 110–115.
10. L.T. Lam, R. Louey, N.P. Haigh, O.V. Lim, D.G. Vella, C.G. Phyland, L.H. Vu, J. Furukawa, T. Takada, D. Monma, T. Kano, J. Power Sources, 174 (2007) 16–29.
11. D. Pavlov, P. Nikolov, J. Electrochem. Soc., 159 (2012) A1215-A1225.
12. A. Cooper, J. Furakawa, L.T. Lam, M. Kellaway, J. Power Sources, 188 (2009) 642–649. 13. A.G. Pandolfo, A.F. Hollenkamp, J. Power Sources, 157 (2006) 11–27.
14. L.T. Lam, R. Louey, J. Power Sources, 158 (2006) 1140–1148.
15. K. Nakamura, M. Shiomi, K. Takahashi, M. Tsubota, J. Power Sources, 59 (1996) 153–157. 16. M. Shiomi, T. Funato, K. Nakamura, K. Takahashi, M. Tsubota, J. Power Sources, 64 (1997) 147–
152.
17. S. Logeshkumar, R. Manoharan, Electrochim. Acta, 144 (2014) 147-153. 18. D. Pavlov, P. Nikolov, T. Rogachev, J. Power Sources, 196 (2011) 5155–5167. 19. P.T. Moseley, R.F. Nelson, A.F. Hollenkamp, J. Power Sources, 157 (2006) 3–10. 20. P.T. Moseley, J. Power Sources, 191 (2009) 134–138.
21. J. Valenciano, A. Sánchez, F. Trinidad, A.F. Hollenkamp, J. Power Sources, 158 (2006) 851–863. 22. M. Fernández, J. Valenciano, F. Trinidad, N. Muňoz, J. Power Sources, 195 (2010) 4458–4469. 23. S.W. Swogger, P. Everill, D.P. Dubey N. Sugumaran, J. Power Sources, 261 (2014) 55–63. 24. K. Yang, L. Peng, D. Shu, C. Lv, C. He L. Long, J. Power Sources, 239 (2013) 553–560. 25. M. Saravanan, M. Ganesan, S. Ambalavanan, J. Power Sources, 251 (2014) 20–29.
26. X. Zou, Z. Kang, D. Shu, Y. Liao, Y. Gong, C. He, J. Hao, Y. Zhong, Electrochim. Acta, 151 (2015) 89-98.
28. K.R. Bullock, J. Power Sources, 195 (2010) 4513–4519. 29. D. Berndt, J. Power Sources, 154 (2006) 509–517.
30. K.C. Leonard, A.J. Bard, J. Am. Chem. Soc., 135 (2013) 15885−15889.
31. L.T. Lam, H. Ceylan, N.P. Haigh,T. Lwin, D.A.J. Rand. J. Power Sources, 195 (2010) 4494−4512.
32. Y. Wu, W. Li, X. Long, F. Wu, H. Chen, J. Yan, C. Zhang, J. Power Sources, 144 (2005) 338–345.
33. W. Li, H. Chen, X. Long, F. Wu, Y. Wu, J. Yan, C. Zhang, J. Power Sources, 158 (2006) 902–907. 34. L.T. Lam, J.D. Douglas, R. Pillig, D.A.J. Rand, J. Power Sources, 48 (1994) 219–232.
35. Y. -D Cho, G.T. –K Fey, J. Power Sources, 184 (2008) 610–616. 36. D. Berndt, J. Power Sources, 95 (2001) 2–12.
37. D. Pavlov, A. Kirchev, B. Monahov, J. Power Source, 144 (2005) 521–527. 38. A. Kirchev, D. Pavlov, J. Power Sources, 162 (2006) 864–869.
39. H. Li, H. Liu, Q. Wang, H. Chen, A. Ren, J. Hu, Electrochim. Acta, 56 (2010) 663-666. 40. G. Petkova, P. Nikolov, D. Pavlov, J. Power Sources, 158 (2006) 841–845.
41. K. Sawai, T. Funato, M. Watanabe, H. Wada, K. Nakamura, M. Shiomi, S. Osumi, J. Power Sources, 158 (2006) 1084–1090.
42. N. Hirai, T. Tanaka, S. Kubo, T. Ikeda, K. Magara, I. Ban, M. Shiota, J. Power Sources, 158 (2006) 1106–1109.
43. D. Pavlov, P. Nikolov, T. Rogachev, J. Power Sources, 195 (2010) 4435–4443. 44. L. Zhao, B. Chen, J. Wu, D. Wang, J. Power Sources, 248 (2014) 1–5.