Int. J. Electrochem. Sci., 7 (2012) 2695 - 2709
International Journal of
ELECTROCHEMICAL
SCIENCE
www.electrochemsci.orgEthanol Sensor Based On Platinum-MWCNT-NiO
Nanoparticles Platform Electrode
Abolanle S. Adekunle1,*, Oluwatobi S. Oluwafemi2,*, Vuyelwa Ncapayi2,Rotimi E. Sadiku3 , John T. Agee4, Sunday O. Ojo5 and Sandile P. Songca6
1
Department of Chemistry, Obafemi Awolowo University, Ile-Ife, Nigeria.
2
Department of Chemistry and Chemical Technology, Walter Sisulu University, Mthatha Campus, Mthatha 5117, Eastern Cape, South Africa.
3
Department of Mechanical Engineering, Tshwane University of Technology, Pretoria, South Africa.
4
Deparment of Electrical Engineering, Tshwane University of Technology, Pretoria, South Africa.
5
Faculty of Information and Communication Technology, Tshwane University of Technology, Pretoria, South Africa.
6
Faculty of Science, Engineering and Technology, Walter Sisulu University, PO Box 19712, Tecoma, East London. South Africa.
*
E-mail: [email protected], [email protected]
Received: 5 December 2011 / Accepted: 6 February 2012 / Published: 1 March 2012
Reported in this work is a novel electrochemical ethanol sensor that is simple to prepare, cost effective, stable and resistant to intermediates poisoning by using platinum (Pt) electrode modified with multi-walled carbon nanotubes (MWCNT)/NiO nanoparticles. The modified electrode (Pt-MWCNT-NiO) was characterized using field emission transmission electron microscopy (FETEM), x-ray diffraction (XRD), energy dispersive spectroscopy (EDS), Cyclic voltammetry, linear sweep voltammetry and chronoamperometry. The electrode showed the highest ethanol oxidation current compared with the other electrodes studied. Ethanol oxidation current increased with increasing MWCNT-NiO loading on the Pt-MWCNT-NiO electrode. Chronoamperometry analysis gave the lowest limit of detection (LoD) of 1.63 ppm and a sensitivity of 0.01 µAmM-1. The catalytic rate constant Kcat and the diffusion
coefficient of ethanol on the electrode are 1.94 x 103 cm3 mol-1 s-1 and 5.2 x 10⁻⁸ cm2s-1 respectively. The high Tafel value of 1227 mVdec-1 obtained suggests the involvement of reaction intermediates. However, the repetitive scanning analyses indicates the electrode to be of very high stability (ca 98%), with capacity to withstand poisoning effects of ethanol oxidation products. The analytical data obtained in this study compared well with other studies reported in literature. The lowest LoD (38.8
M or 1.63 ppm) obtained for chronoamperometry suggest the high sensitivity of this technique over other techniques studied and as such should be considered when constructing the Pt-MWCNT-NiO ethanol sensor for commercial applications.
1. INTRODUCTION
Ethanol is a small organic molecule of significant importance and has attracted wide industrial applications in fuel cell in the last few decades especially as a renewable fuel cell source [1-5]. It has also found application in food and pharmaceutical industries either as solvent during drug preparations [6], as preservatives [7] or as food especially in brewing industries [8]. Thus, its detection and quantification during every stage of industrial processes or in the final effluents resulting from these industrial activities in order to protect the soil and water from pollution cannot be overemphasised. Because of its simplicity, convenience and precision, electrochemical method is gaining application in the sensing of ethanol over other conventional methods [9].
It is of interest to know that ethanol oxidation is usually characterized with adsorption of oxidation intermediates (e.g. CO) which had been a long time challenge in its application especially in fuel cell or energy devices. This has led to different electrode configuration that can either prevent or ameliorate the effect of adsorbed intermediates during electrochemical oxidation of ethanol. Several studies on the electrooxidation of ethanol devoted mainly to identify the adsorbed intermediates, showed the presence of carbon monoxide species (CO) strongly adsorbed at the electrode surface. Identification of intermediates and final products from the electrochemical oxidation of ethanol, provided by many authors with the use of differential electrochemical mass spectrometry (DEMS) and in situ Fourier transform infrared spectroscopy (FTIRS) [10-12], identified acetaldehyde and CO2 as
primary reaction products.
Platinum (Pt) is a precious metal with high electron transfer properties, outstanding catalytic properties, electrical stability, resistant to wear and chemical attack and excellent high temperature characteristics for industrial application. It has many applications in different areas despite being expensive. Though it can be poisoned by CO molecules adsorbed during the alcohol oxidation (e.g. ethanol), the use of metallic Pt as electro-catalyst for the oxidation of small organic molecules has been widely investigated [13, 14]. In the literature, Pt–M (M= transition metals) and Pt-MO-based binary catalysts such as Pt-Ni or Pt-NiO are used to enhance the catalytic activity and eliminate or inhibit the CO poisoning effect [14-17].
Aside platinum modified electrodes, other studies using metal and metal oxides decorated electrodes for biological and environmental sensing of ethanol have been reported [9,18-21]. For example, Glassy carbon electrodes modified with a Ni/Al–Cl hydrotalcite-type anionic clay have been tested for the oxidation of methanol and ethanol [18]. Recently, Shibli et al. developed an electroless Ni–P coating incorporated with TiO2-supported nano-RuO2 as a high performance amperometric
ethanol sensor [9]. Tin oxide (SnO2) doped with cerium oxide (CeO2) has also been used for selective
sensing of ethanol in ambient humid air [19]. Also, there is a report on ethanol gas sensor based on Al-doped ZnO nanomaterials [20]. Nano-sized -Fe2O3 based solid solutions with different compositions
of SnO2, ZrO2 and TiO2 have been prepared and tested as sensor for ethanol gas [22]. Other studies
sensor especially that, which will take care of the poisoning effect resulting from CO is of great importance and all these form the basis for this work.
In this study, platinum electrode modified with acid-functionalized MWCNTs and decorated with NiO nanoparticles was used for the electrochemical sensing of ethanol. To the best of our knowledge, no report on the use of this electrode (Pt-MWCNT-NiO) platform for ethanol sensing has been reported. The motivation to this study are: (i) To improve the electronic properties of the based Pt electrode, (ii) Improve its sensing behaviour towards ethanol and eliminate or minimised CO poisoning as much as possible, (iii) To synthesise the MWCNT-NiO nanocomposite material in bulk quantity that can be used continuously to fabricate novel ethanol sensor that will be readily available and affordable for commercial application. The carbon nanotudes (CNT) provides a large surface area for metal (M) or metal oxide (MO) deposition on the electrodes and thus, provides a synergistic relationship for an improved electron transfer between the base electrode (platinum in this case) and the metal or metal oxide nanoparticles [23-25]. The modified Pt-MWCNT-NiO electrode gave very low detection limit (1.63 ppm), good stability and resistant to electrode poisoning even after several repetitive cycling of the electrode in the analyte.
2.EXPERIMENTAL
2.1. Materials and Reagents
Multi-walled carbon nanotubes (MWCNTs), obtained from Aldrich, was acid-functionalised [26] to improve its solubility and electronic properties. NiNO3, ethylene glycol (C2H6O2, NaOH,
(NH4)2CO3 and ethanol were purchased from Sigma-Aldrich chemicals. Hydrazinium hydroxide
(N2H5OH) was purchased from Merck chemicals. All chemicals were of analytical grade and used as
received without further purification. Ultra pure water of resistivity 18.2 MΩcm was obtained from a Milli-Q Water System (Millipore Corp., Bedford, MA, USA) and was used throughout for the preparation of solutions. Phosphate buffer solutions (PBS) at various pHs were prepared with appropriate amounts of Na2HPO4 and NaH2PO4, and the pH adjusted with 0.1 M H3PO4 or NaOH.
2.2. Equipment and Procedure
and platinum wire were used as references and counter electrodes respectively. All solutions were de-aerated by bubbling nitrogen prior to each electrochemical experiment. Experiments were performed at 25 ± 1 °C.
2.3. Electrode Modification and Pretreatments
Platinum surface was cleaned by gentle polishing in aqueous slurry of alumina nanopowder (Sigma-Aldrich) on a SiC-emery paper. The electrode was subjected to ultrasonic vibration in absolute ethanol to remove residual alumina particles that might be trapped on the surface. The procedures for the synthesis of the Ni [27] and NiO [28] nanoparticles have been reported and exemplified for NiO nanoparticles as summarised in scheme 1, along side with the electrode modification process. The electrode modification was by drop-dried method. Typically 2.5 to 10 mg of the synthesised Ni and NiO nanoparticles were weighed and dissolved in dimethylformamide (DMF) solution with and without 2 mg of the functionalised MWCNT. The mixtures were stirred at room temperature for 48 h. About 20 µL of the obtained MWCNT-Ni and MWCNT-NiO were drop-cast on the Pt and annealed in the oven at 50 0C for 5 min. The modified electrode is denoted as Pt-MWCNT-Ni or Pt-MWCNT-NiO. Other Ni and NiO modified electrodes were obtained using the drop-dried method.
3. RESULTS AND DISCUSSION
3.1. Characterisation with FETEM, XRD, EDX and XPS
Scheme 1 summarises the synthesis and the electrode modification procedure as exemplified with NiO nanoparticles. The Transmission electron micrograph obtained for the different as- synthesised materials are presented in Figure 1.
NiNO3(aq) NiCO
3.Ni(OH)2.xH2O(s)
(ii) Stirred at 400C for 1 hr.
(i) (NH4)2CO3
(iii) Dried at 1050C for 12 hr
+
(iv) Heated in air at 4000C for 1hr
NiO (s)
Pt
MWCNT-COOH
(stirred for 48 hrs)
MWCNT-NiO
Drop-dried +
Drop-dried
(a) Pt-NiO (b) Pt-MWCNT-NiO
500 nm 500 nm
200 nm
200 nm
(a) (b)
(c) (d)
Figure 1. Typical TEM images of (a) Ni nanoparticles (b) NiO nanoparticles (c) MWCNT-Ni nanoparticles and (d) MWCNT-NiO nanoparticles.
The synthesised Ni nanoparticles appeared amorphous (Fig. 1a and 1c) while their NiO counterparts are crystalline, mono-disperse nanoparticles with particle size in the range 15–30 nm. After modification with MWCNT, the particles were distributed evenly along the length of the MWCNT (Fig. 1c and 1d), which was made possible by the electronic interactions between the nanoparticles and the carboxylated MWCNT (MWCNT-COOH).
Cou
nt
s
/
A
rbi
tra
ry
un
its
NiO
Cou
nt
s
/
A
rbi
tra
ry
un
its
[image:5.596.120.472.68.326.2]NiO
[image:5.596.120.477.520.725.2]
Figure 2 shows the EDX profile of the synthesised MWCNT-NiO nano hybrid material. Compared with the EDX of the funtionalised MWCNT (inset in Fig. 2), it is obvious that the MWCNT was successfully modified with NiO nanoparticles as earlier shown by the TEM images. The presence of nickel peaks (ca 84%) in Figure 2 is a clear proof of the successful synthesis of the metal; while the prominent oxygen peak further confirmed the occurrence of the nickel nanoparticles in its oxide form rather than pure nickel nanoparticles.
3.2 Electrochemical characterization
Figure 3 compares the cyclic voltammograms of the bare and modified Pt electrode in 5 mM Fe(CN)6]4-/[Fe(CN)6]3- solutions. Except for the bare Pt electrode with one redox peak at about 0.2 V,
attributed to the Fe(CN)6]4-/[Fe(CN)6]3 redox process, the Ni or NiO modified electrode showed a
second peak at about 0.73 V corresponding to Ni2+/Ni3+ redox process. This further confirms the successful modification of the Pt electrode with Ni nanoparticles. The high current response seen in Pt-MWCNT-NiO is associated with fast electron transport leading to the overlap of the Fe(CN)6]
4-/[Fe(CN)6]3 and Ni2+/Ni3+ peaks as indicated by the occurrence of one broad peak (ca 0.6 V) on the
electrode and the disappearance of the reversible peak corresponding to Fe(CN)6]4-/[Fe(CN)6]3 redox
process. The electrode exhibited high current response over other electrodes, which increased with increasing NiO loading. It’s enhanced current response and fast kinetics is an indication of improved electrochemical performance, arising from the presence of the MWCNTs.
-0.06 -0.04 -0.02 0 0.02 0.04 0.06 0.08 0.1
-0.2 0 0.2 0.4 0.6 0.8 1
E/V (vs Ag|AgCl, sat'd KCl)
I
/
m
A
Pt
Pt-Ni Pt-NiO
Pt-MWCNT-Ni
Pt-MWCNT-NiO-2.5mg Pt-MWCNT-NiO-10mg
Figure 3. Comparative CVs showing the current response of Pt, Ni, NiO, MWCNT-Ni, Pt-MWCNT-NiO-2.5 mg, Pt-MWCNT-NiO-10 mg in 5 mM Fe(CN)6]4-/[Fe(CN)6]3- solution (scan
[image:6.596.148.448.442.707.2]
3.3. Comparative electrocatalytic oxidation of ethanol
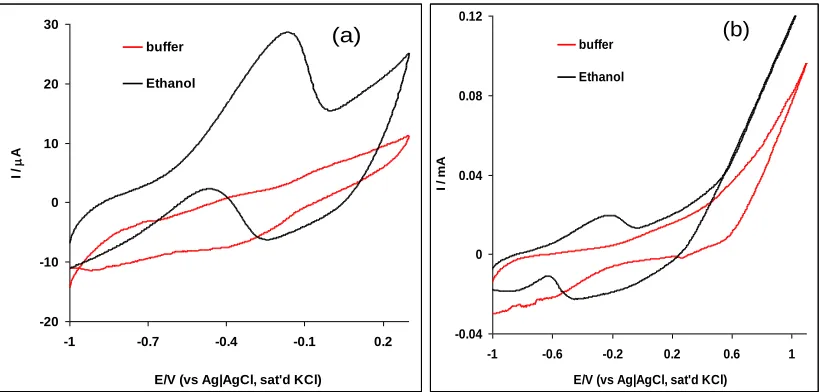
Figure 4 is the cyclic voltammograms comparing the electrocatalytic response of the Pt-MWCNT-NiO electrode in 0.5 M NaOH solution only and 0.5 M NaOH solution containing 1.0 M ethanol at: (a) negative potential window and (b) positive potential window respectively. The result can be summarised in two ways. Firstly, in both cases (Figs. 4a and 4b), there was no peak observed in NaOH as compared with prominent ethanol oxidation current peak observed in the ethanol solution. Secondly, contrary to expectation, the ethanol oxidation peak was observed in the negative potential window (lower energy, Fig. 4a) compared with the positive potential window (Fig. 4b) where no ethanol oxidation peak was noticed. This is an interesting result and it indicates that a lower energy will be needed to carry out ethanol oxidation on the Pt-MWCNT-NiO electrode especially when compared to other electrodes platform reported in literature where the analyte oxidation took place at the positive potential window (higher energy) [4,5,9,18].
-20 -10 0 10 20 30
-1 -0.7 -0.4 -0.1 0.2
E/V (vs Ag|AgCl, sat'd KCl)
I /
A
buffer
Ethanol
(a)
-0.04 0 0.04 0.08 0.12
-1 -0.6 -0.2 0.2 0.6 1 E/V (vs Ag|AgCl, sat'd KCl)
I
/
m
A
buffer
Ethanol
(b)
Figure 4. Comparative CVs showing the current response of Pt-MWCNT-NiO electrode in 0.5 M NaOH buffer alone, and 0.5 M NaOH containing 1.0 M ethanol at : (a) negative and (b) positive potential windows (scan rate: 25 mVs-1).
[image:7.596.94.504.313.509.2]
and CH3COOH are formed and electrode poisoning can occur due to the re-adsorbed CO molecules
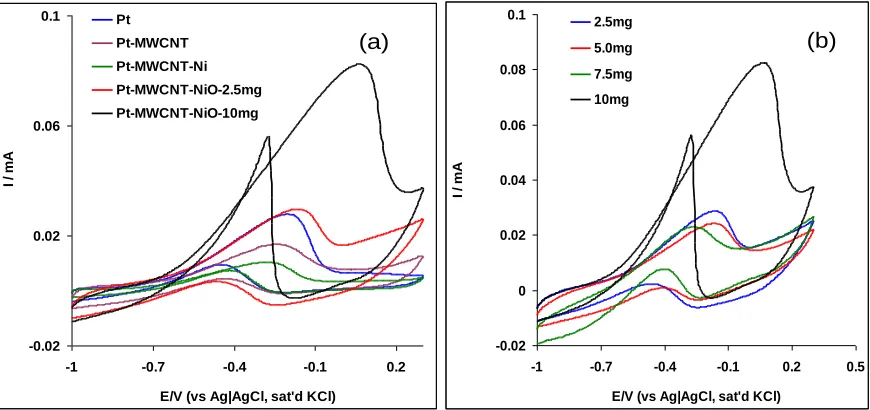
[14, 21]. However during the reverse process, the NiOOH and formed platinum oxides are reduced thereby reactivating the surface of the electrode. Thus re-oxidation of ethanol and other carbonaceous species takes place as indicated by the presence of an intense anodic oxidation peak at about -0.45 V [14,21]. From Figure 5a, the electrocatalytic efficiency of Pt-MWCNT-Ni towards the analyte was very poor and lower compared with that of the bare Pt electrode. Pt-Ni and Pt-NiO electrodes were also studied (not shown) but with no appreciable ethanol oxidation current as compared with the bare Pt electrode. On the other hand, Pt-MWCNT-NiO gave the highest oxidation current in this study compared with the other electrodes investigated.
The result can be ascribed to different material types and surface roughness among other factors which could dictate diffusion pattern of ethanol molecules on the electrode surface or the larger available surface area of the modified electrode due to the nanometre dimension of the MWCNTs supporting the distribution of the NiO nanoparticles on the Pt-MWCNT-NiO and thus enhancing its catalysis. Since Pt-MWCNT-NiO was identified as the best electrode, the catalysis of the electrode towards the analyte was optimised by increasing the amount of MWCNT-NiO loading on its surface (Fig. 5b).
Much improved ethanol oxidation current was obtained at 10 mg MWCNT-NiO loading (82.2 µA) than at 2.5 mg MWCNT-NiO loading (29.3 µA), after which the oxidation current remained constant and later dropped at higher MWCNT-NiO loading on the electrode. This phenomenon was attributed to the passivation or insulation of the electrode layer as a result of too many catalyst loaded on the electrode surface. The mechanism of ethanol oxidation on the Pt-MWCNT-NiO electrode is summarised in scheme 2 below:
Scheme 2. Mechanism of ethanol oxidation reaction at the Pt-MWCNT-NiO electrode.
The Ni2+ ion in NiO forms Ni(OH)2 in basic medium (Eqn. 1) which further oxidised to
NiOOH (Eqn.2). The NiOOH interacts with ethanol (CH3CH2OH) and oxidized it [Eqn. 3] forming
intermediates such as CH3COO-, CO adsorptions, small amount of CH3CHO etc. [21]. The
intermediates are oxidized to produce more CH3CHO (Eqn. 4). Since the oxidation rate of aldehyde is
faster than that of alcohol, aldehyde will be continuously oxidized to acids (Eqn. 5).
Ni2+ + 2OH- Ni(OH)2 (1)
OH- + Ni(OH)2 NiOOH + H2O + e- (2)
NiOOH + CH3CH2OH intermediate + Ni(OH)2 (3)
NiOOH + intermediate CH3CHO + Ni(OH)2 (4)
-0.02 0.02 0.06 0.1
-1 -0.7 -0.4 -0.1 0.2
E/V (vs Ag|AgCl, sat'd KCl)
I
/
m
A
Pt
Pt-MWCNT
Pt-MWCNT-Ni
Pt-MWCNT-NiO-2.5mg
Pt-MWCNT-NiO-10mg
(a)
-0.02 0 0.02 0.04 0.06 0.08 0.1
-1 -0.7 -0.4 -0.1 0.2 0.5
E/V (vs Ag|AgCl, sat'd KCl)
I
/
m
A
2.5mg
5.0mg
7.5mg
10mg
[image:9.596.82.517.72.277.2](b)
Figure 5. Typical cyclic voltammograms showing (a) the current response of the modified electrodes in 0.5 M NaOH containing 1.0 M ethanol at the bare Pt, MWCNT, MWCNT-Ni, Pt-MWCNT-NiO-2.5mg and Pt-MWCNT-NiO-10mg, scan rate : 25 mV s- (b) catalysis of the electrode towards the analyte by increasing the amount of MWCNT-NiO loading on its surface
3.4. Effect of varying scan rates and stability study
Effect of scan rate (scan rate : 25-1000 mVs-1) was investigated by carrying out cyclic voltammetry experiment at constant concentration (1.0M) of the ethanol in 0.5 M NaOH using the Pt-MWCNT-NiO electrode (Fig. 6a). The CV data indicated an irreversible electro-oxidation of ethanol. A more pronounced anodic current increase was observed for the oxidation sweep and none for the reduction sweep, suggesting that the potential sweep favours electro oxidation of DA. The ΔEp
increases at higher potential sweep rates.
From the Randles-Sevčik equation for an anodic oxidation process [30] (Eqn. 6):
Ip=3.01×10⁵ n [(1 − α)nα]1/2ACbD1/2v1/2 (6)
Where n is the number of exchange electrons and α is the electron transfer coefficient, A is the electrode surface area; C and D are the concentration and the diffusion coefficients of the analyte respectively. The plots of peak current, Ip for the anodic versus square root of scan rate (1/2) (Fig. 6b)
was linear (R2 = 0.9903), signifying a diffusion controlled redox process [30-34]. Using Tafel equation (Eqn. 7) [30], a linear plot between the peaks potential Ep and the log (not shown) was obtained.
. log
2 const
b
Ep (7)
The Tafel slope b was estimated from the slope of the plot of Ep versus log and the value was
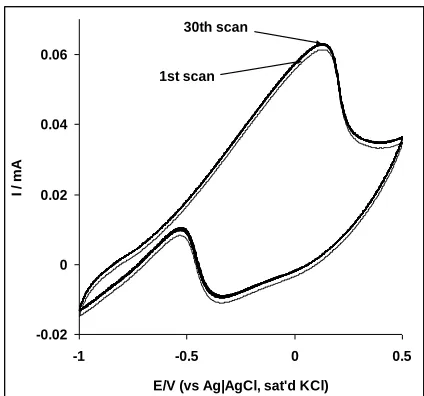
by repetitive scanning of the electrode (30 cycles) in 1.0 M ethanol, a small rise in current (2%) was noticed between the first and the second scan, which later remain stable for the remaining 30 cycles (Fig. 7). Despite the high Tafel value obtained in this study, this result portrayed the electrode to have very high stability (ca 98%), with capacity to withstand poisoning effects of ethanol oxidation products such as CO adsorption which has always been a great challenge to maintaining the catalytic performance of catalyst on modified electrodes. Similarly, when rinsed in a fresh PBS (pH 7.0), the electrode can be used for the analysis of ethanol after storage in a refrigerator for up to four weeks without a significant change in its response.
-0.06 0 0.06 0.12 0.18
-1 -0.6 -0.2 0.2 0.6 1 1.4
E/V (vs Ag|AgCl, sat'd KCl)
Ip
/
m
A
25 1000 mVs-1
(a)
y = 0.1469x + 0.0226 R2 = 0.9903
0.03 0.06 0.09 0.12 0.15 0.18
0.1 0.3 0.5 0.7 0.9
1/2 / (Vs-1)1/2
I
/
m
A
[image:10.596.85.511.235.430.2](b)
Figure 6. (a) Cyclic voltammograms of Pt-MWCNT-NiO obtained in 0.5 M NaOH containing 1.0M
ethanol at scan rates 25 to 1000 mV s-1 (inner to outer). (b) Is the plot, Ip vs. 1/2 for the anodic
process.
-0.02 0 0.02 0.04 0.06
-1 -0.5 0 0.5
E/V (vs Ag|AgCl, sat'd KCl)
I
/
m
A
1st scan 30th scan
Figure 7. Repetitive cyclic voltammograms (30 cycles) of Pt-MWCNT-NiO electrode in 0.5 M NaOH
[image:10.596.191.403.518.716.2]
3.5. Electroanalysis of Ethanol concentrations using cyclic voltammetry, linear sweep voltammetry and chronoamperometry techniques.
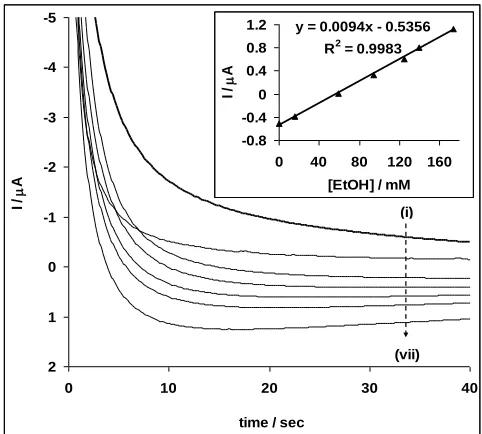
Concentration study was carried out by investigating the response of Pt-MWCNT-NiO electrode to the different concentrations of ethanol (Figures 8-10) using cyclic voltammetry, linear sweep voltammetry and chronoamperometry (at a fixed potential of -0.15 V) experiments. Figure 10 is the modified chronoamperogram after reversing the current axis.
-25 -15 -5 5 15 25 35 45
-1 -0.7 -0.4 -0.1 0.2
E/V (vs Ag|AgCl, sat'd KCl)
I /
A
23.8 214.3 mM
(a) y = 0.1008x + 18.709R2 = 0.998
20 25 30 35 40
10 30 50 70 90 110 130 150 170 190 210
[EtOH] / mM
Ip
/
A
[image:11.596.92.503.212.415.2](b)
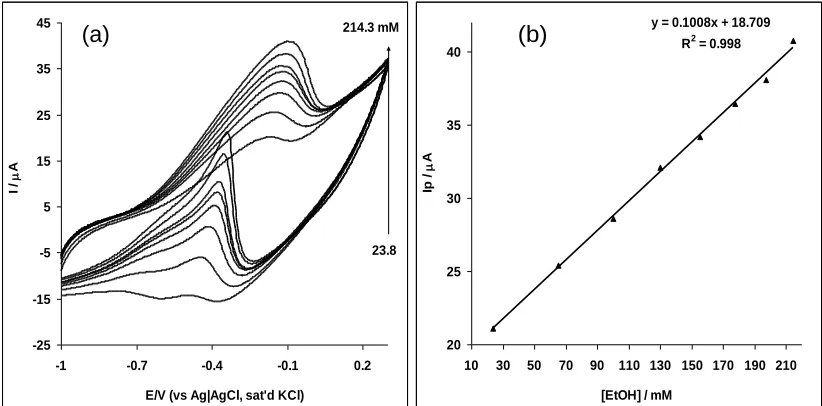
Figure 8. Cyclic voltammetric evolutions of the Pt-MWCNT-NiO in 0.5 M NaOH solution containing different concentrations of ethanol representing 23.8, 65.2, 100.0, 130.0, 155.0, 177.0, 197.0, and 214.0 mM, respectively). (b) is the plot of peak current (Ip) vs. concentration of ethanol.
-10 -6 -2 2 6 10
-0.5 -0.4 -0.3 -0.2 -0.1 0 0.1 0.2
E/V (vs Ag|AgCl, sat'd KCl) I / m
A
16.1 206 .0 mM
(a) y = 0.0295x - 0.2893
R2 = 0.9971
0 1 2 3 4 5 6 7
0 50 100 150 200
[EtOH] / mM Ip
/
m
A
(b)
[image:11.596.90.508.503.701.2]
From the plot of current response against concentration (Figs. 8b, 9b), a linear relationship was obtained for all the techniques at the different ethanol concentration range studied. The limit of detection (LoD) was estimated using the relationship LoD = 3.3 s/m [36], where s is the relative standard deviation of the intercept and m, the slope of the linear current versus the concentration of ethanol. The sensitivity, limit of detection and the concentration range are 0.10 AmM-1, 8.91 mM (410 ppm) and 23.8 – 214.0 mM for cyclic voltammetry; 0.03AmM-1, 12.1 mM (557 ppm) and 16.1 – 206.0 mM for linear sweep voltammetry; and 0.01AmM-1, 38.8 M (1.63 ppm) and 1.0 M – 174.0 mM for chronoamperometry respectively. Generally, the LoD values are very low and agrees with other literature values [37-39] but the lowest LoD reported in this work (38.8 M or 1.63 ppm) for chronoamperometry suggest the high sensitivity of this technique over other techniques studied and as such should be considered when constructing the Pt-MWCNT-NiO ethanol sensor for commercial applications. Secondly, the LoD value of 1.63 ppm (~ 0.0002 %) is low enough for the application of the proposed sensor in the detection of ethanol levels of many commercially available alcohol drinks where ethanol level is usually greater than 2%.
-5
-4
-3
-2
-1
0
1
2
0 10 20 30 40
time / sec
I /
A
(i)
(vii) y = 0.0094x - 0.5356
R2 = 0.9983
-0.8 -0.4 0 0.4 0.8 1.2
0 40 80 120 160
[EtOH] / mM
I /
A
Figure 10. Chronoamperogramms of the Pt-MWCNT-NiO in 0.5 M NaOH solution containing
different concentrations of ethanol (i - vii) representing 0.0, 0.001, 16.1, 58.8, 94.9, 125.0 and 174.0 mM, respectively. Inset is the plot of peak current (Ip) vs. concentration of ethanol.
[image:12.596.177.418.336.553.2]
2 1 2
1
)
(
kCt
I
I
buff
cat
(8)
2 1 2 1
2 1
t C nFAD I
(9)
The diffusion coefficient D of ethanol at this electrode was estimated from the Cottrell Equation (9) [30], where C is the bulk concentration (mol cm−3), A is the area of the electrode in cm2 and n = 2, from the experimental plots of I versus t−1/2 at different concentrations (not shown), the diffusion coefficient D of ethanol was calculated as 5.2 x 10⁻⁸ cm2 s-1.
4. CONCLUSION
This study describes the efficient electrocatalytic detection and oxidation of ethanol using Pt-MWCNT-NiO modified electrode. The Pt-Pt-MWCNT-NiO electrode showed faster electron transport behaviour in Fe(CN)6]4-/[Fe(CN)6]3- redox probe and enhanced current response towards ethanol
oxidation compared to other electrodes investigated. The catalysis and ethanol oxidation current response increased on Pt-MWCNT-NiO with increasing MWCNT-NiO loading. Ethanol oxidation on the electrode was diffusion-controlled and characterised with the involvement of some reaction intermediates. The limit of detection, catalytic rate constant and the diffusion coefficient are 1.63 ppm, 1.94 x 103 cm3 mol-1 s-1 and (5.2 x 10⁻⁸ cm2 s-1) respectively. The limit of detection is lower and compared favourably with other values reported in literature. The electrode was very stable towards poisoning effect of ethanol oxidation product and could be used in real life application for the detection of the analyte based on its low limit of detection.
ACKNOWLEDGEMENTS
We thank the National Research Foundation (NRF) for supporting this work under the Knowledge Field Development (KFD) grant UID # 74768. The authors also acknowledge the support of the following institutions, Obafemi Awolowo University, Ile-Ife, Nigeria, Walter Sisulu, Eastern Cape, South Africa and the Tshwane University of Technology, Pretoria, South Africa.
References
1. D. M. dos Anjos, F. Hahn, J.-M. Léger, K. B. Kokoh, G. Tremiliosi-Filho, J Solid State Electrochem., 68 (2007) 1567.
2. W. Feng, L. Yanhong, W. Chuan, Rare Metals 29 ( 2010) 255.
4. Z-H. Wang, J. Li, X. Dong, D. Wang, T. Chen, H. Qiao, A. Huang, International Journal of Hydrogen Energy 33 (2008) 6 1 4 3.
5. R. B. Kutz, B. Braunschweig, P. Mukherjee, R. L. Behrens, D. D. Dlott, A. Wieckowski, Journal of Catalysis 278 (2011)181.
6. H. Waard, H. W. Frijlink W. L. J. Hinrichs, Pharm Res, 28 (2011) 1220.
7. A. Bello, F. Bianchi, M. Careri, M. Giannetto, V. Mastria, G. Mori, M. Musci, Sens. Actuat. B 125 (2007) 321.
8. A. M. Azevedo, D. M. F. Prazeres, J. M. S. Cabral, C. L. P.Fonseca, Biosens. Bioelectron. 21 (2005) 235.
9. S. M. A. Shibli, N. D. Suma, V. S. Dilimon, Sens. Actuat. B 129 (2008) 139. 10. J. Willsau, J. Heitbaum, J. Electroanal. Chem. 27 (1985) 194.
11. T. Iwasita, E. Pastor, Electrochim Acta 39 (1994) 531.
12. U. Schmiemann, U. Muller, H. Baltruschat, Electrochim Acta 40 (1995) 99.
13. E. A. Batista, G. R. P. Malpass, A.J. Motheo, T. Iwasita, Electrochem. Commun. 5 (2003) 843. 14. R. G. Freitas, M. C. Santos, R. T. S. Oliveira, L. O. S. Bulhoes, E. C. Pereira, Journal of Power
Sources 158 (2006) 164.
15. Y. Ishikawa, M. S. Liao, C. R. Cabrera, Surf. Sci. 66 (2000) 463.
16. Y. E. Sung, H. Kin, S. Thomas, A. Wieckowiski, R. Liu, H. Iddir, Q. Fan, G. Hou, A. Bo, K.L. Ley, E.S. Smotkin, J. Phys. Chem. B. 104 (2000) 3518.
17. K. W. Park, J. H. Choi, B. K. Kwon, S. A. Lee, Y. E. Sung, H. Y. Ha, S. A. Hong, H. Kim, A. Wieckowiski, J. Phys. Chem. B. 106 (2002)1869.
18. B. Ballarin, R. Seeber, D. Tonelli, A. Vaccari, Journal of Electroanalytical Chemistry 463 (1999) 123–127.
19. F. Pourfayaz, Y. Mortazavi, A. Khodadadi, S. Ajami, Sens. Actuat. B 130 (2008) 625. 20. Z. Yang, Y. Huang, G. Chen, Z. Guo, S. Cheng, S. Huang, Sens. Actuat. B 140 (2009) 549. 21. B. Tao, J. Zhang, S. Hui, L. Wan, Sens. Actuat. B 142 (2009) 298.
22. O. K. Tan, W. Cao, W. Zhu, J. W. Chai, J. S. Pan, Sens. Actuat. B 93 (2003) 396.
23. A. S. Adekunle, J. G. Ayenimo, X-Y. Fang, W. O. Doherty, O. A. Arotiba, B. B. Mamba, Int. J. Electrochem. Sci., 6 (2011)2826.
24. A. S. Adekunle, B. B. Mamba, B. O. Agboola, K. I. Ozoemena, Int. J. Electrochem. Sci., 6 (2011) 4388.
25. A. S. Adekunle, B. B. Mamba, B. O. Agboola, O. S. Oluwafemi K. I. Ozoemena, Int. J. Electrochem. Sci., 6 (2011)4760..
26. J. A. Liu, , G. Rinzler, H. Dai, J. H. Hanfer, R. K Bradley, P. J. Boul, A. Lu, T Iverson, K. Shelimov, C. B. Huffman, F. R. Macias, Y. S. Shon, T. R. Lee, D. T. Colbert, Science 280 (1998) 1253.
27. S. H. Wu, D. H. Chen, J. Colloid Interf. Sci. 259 (2003) 282. 28. L. Xiang, X. Y. Deng, Y. Jin, Scripta Mater. 47 (2002) 219.
29. A. S. Adekunle, K. I. Ozoemena, J. Electroanal. Chem. 645 (2010) 41.
30. A. J. Bard, L. R. Faulkner, Electrochemical Methods: Fundamentals and Applications, 2nd ed., John Wiley & Sons, Hoboken, NJ., 2001.
31. S. Majdi, A. Jabbari, H. Heli, A. A. Moosavi-Movahedi, Electrochim. Acta 52 (2007) 4622. 32. H. Yao, Y. Sun, X. Lin, Y. Tang, L. Huang, Electrochim. Acta 52 (2007) 6165.
33. S. Jo, H. Jeong, S. R. Bae, S. Jeon, Microchem. Journ. 88 (2008) 1.
34. X. Wang, N. Yang, Q. Wan, X. Wang, Sens. Actuat. B Chem. 128 (2007) 83. 35. A. S. Adekunle,K. I. Ozoemena, Int. J. Electrochem. Sci. 5 (2010) 1972.
36.G. D. Christian, 2004 Analytical Chemistry, 6th ed. John Wiley and Sons New York, p 113. 37. Javier Gonzalo-Ruiz, M. Asuncio´n Alonso-Lomillo, Roger Escude´-Pujol, F. Javier Mun˜oz,
Electroanalysis 18 (2006) 1231.
39. H. N. Choi, S.H. Yoon, Y-K Lyu, W.Y. Lee, Electroanalysis 19 (2007) 459. 40. M. H. Pournaghi-Azar, R. Sabzi, J. Electroanal. Chem. 543 (2003) 115.

![Figure 3. Comparative CVs showing the current response of Pt, Pt-Ni, Pt-NiO, Pt-MWCNT-Ni, Pt-MWCNT-NiO-2.5 mg, Pt-MWCNT-NiO-10 mg in 5 mM Fe(CN)6]4-/[Fe(CN)6]3- solution (scan rate: 50 mVs-1)](https://thumb-us.123doks.com/thumbv2/123dok_us/1921128.151202/6.596.148.448.442.707/figure-comparative-showing-current-response-mwcnt-mwcnt-solution.webp)