Sharp Mitre Elbow
.
White Rose Research Online URL for this paper:
http://eprints.whiterose.ac.uk/127688/
Version: Published Version
Article:
Al-Tameemi, W.T. and Ricco, P. (2018) Pattern-based Pressure Drop Of Air–water Flow
Across A 90° Sharp Mitre Elbow. International Journal of Computational Methods and
Experimental Measurements, 6 (1). pp. 198-207. ISSN 2046-0546
https://doi.org/10.2495/CMEM-V6-N1-198-207
© 2018 WIT Press. Reproduced in accordance with the publisher's self-archiving policy.
[email protected] https://eprints.whiterose.ac.uk/ Reuse
Unless indicated otherwise, fulltext items are protected by copyright with all rights reserved. The copyright exception in section 29 of the Copyright, Designs and Patents Act 1988 allows the making of a single copy solely for the purpose of non-commercial research or private study within the limits of fair dealing. The publisher or other rights-holder may allow further reproduction and re-use of this version - refer to the White Rose Research Online record for this item. Where records identify the publisher as the copyright holder, users can verify any specific terms of use on the publisher’s website.
Takedown
If you consider content in White Rose Research Online to be in breach of UK law, please notify us by
© 2018 WIT Press, www.witpress.com
ISSN: 2046-0546 (paper format), ISSN: 2046-0554 (online), http://www.witpress.com/journals DOI: 10.2495/CMEM-V6-N1-198-207
W. Al-Tameemi & P. Ricco, Int. J. Comp. Meth. and Exp. Meas., Vol. 6, No. 1 (2018) 198–207
PATTERN-BASED PRESSURE DROP OF AIR–WATER FLOW
ACROSS A 90
°SHARP MITRE ELBOW
WAMEEDH T. M. AL-TAMEEMI1,2 & PIERRE RICCO1 1Department of Mechanical Engineering, The University of Sheffield, UK.
2Reconstruction and Project Directorate, Ministry of Higher Education and Scientific Research, Iraq.
ABSTRACT
Air–water flow in a 90° sharp elbow (mitre bend) is studied in a new purpose-built experimental facility at the University of Sheffield. For the first time, the two-phase flow is investigated in a mitre bend for water-based Reynolds numbers Rew= 5600–12800 and water-to-air mass flow rate ratios m m w/ a=10–3800. Four different flow patterns are observed in the upstream pipe (plug, slug, slug-annular and annular) by using a high-speed high-resolution camera. The results show that the perturbation length upstream and downstream of the elbow and the pressure drop are significantly affected by the flow patterns. Two new values of the Lockhart–Martinelli parameter C are found for the pressure drop across the elbow.
Keywords: 90° sharp elbow, flow patterns, pressure drop, two-phase flow.
1 INTRODUCTION
Pipe fittings like elbows are common in many two-phase flow industrial applications and the prediction of pressure drop across these represents a very important fundamental and practi-cal issue for piping system design. The physics of two-phase flows across elbows is obviously more complicated than in single-phase flow due to many additional factors, like the buoyancy force, which is mainly responsible for the two-phase flow patterns. An accurate prediction of the flow patterns for different flow conditions is essential in two-phase flow studies because the local pressure drop is strongly affected by the flow regimes [1, 2].
Flow patterns are influenced by many factors like the flow orientation (horizontal or vertical), the flow conditions (adiabatic or diabatic), and the physical properties of the fluids. Although there are many empirical maps predicting the two-phase flow patterns in horizontal pipes, [3, 4], none of these maps can predict the flow patterns accurately for all flow conditions [1, 5].
Two-phase pressure drops in straight pipes (dp*/dz*)tp were correlated by Lockhart and Martinelli [6] as follows:
(dp*/dz*)tp= Φ2k(dp* /dz*) ,k (1)
where k is the flow phase (liquid F or gas tt) and Φ is the two-phase multiplier, expressed by Chisholm [7] as:
ΦF c X X 2 2 1 1
= + + , (2)
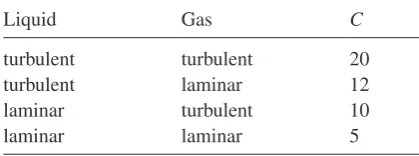
where C is an experimental parameter (given in Table 1), X is the Martinelli parameter
defined as:
X p z
p z F G 2 =( * *) ( * / *) , d /d
d d (3)
Although this model was developed for two-phase pressure drop in round straight pipes, many studies [8–13] proved that the Lockhart–Martinelli model can be successful in
predict-ing the pressure drop for different flow geometries by modifypredict-ing the parameter C. Other
studies [9, 14] used the Lockhart–Martinelli model to fit pressure drop data of bubbly flow through 90° and 45° horizontal elbows.
In this study, we are motivated to investigate different air–water flow patterns in horizontal pipes upstream and across a sharp 90° elbow and to measure the pressure drop. Another cru-cial objective is to find the Lockhart–Martinelli parameter C for the pressure drop across the elbow.
2 EXPERIMENTAL FACILITY AND PROCEDURES
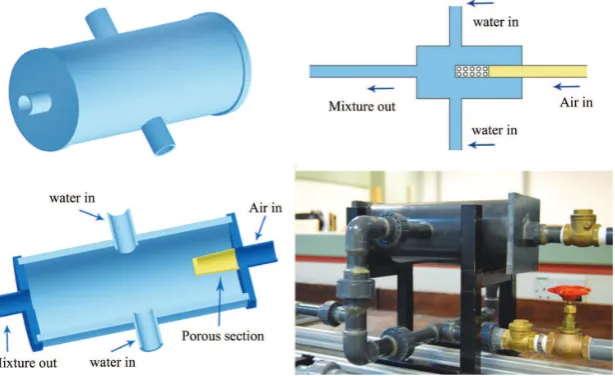
A new experimental facility was designed and built for this work in the Department of Mechanical Engineering at The University of Sheffield. The facility consists of water and air lines, a phase mixer and a test section fitted with the 90° sharp elbow. The facility is shown schematically in Fig. 1.
2.1 Water and Air Lines
[image:3.496.142.352.85.163.2]Water is pumped from a storage water tank to the test section by using a variable speed pump with 80 LPM maximum flow rate at constant pressure. An automatic variable speed
Table 1: Experimental values of the parameter C [7].
Liquid Gas C
turbulent turbulent 20
turbulent laminar 12
laminar turbulent 10
laminar laminar 5
[image:3.496.93.404.448.619.2]200 W. Al-Tameemi & P. Ricco, Int. J. Comp. Meth. and Exp. Meas., Vol. 6, No. 1 (2018)
controller is used to obtain a constant pressure flow at variable flow rates. Two different water filters are located before the pump to minimize the intrusion of impurities in the test section. Water flow rates are measured by two different turbine flow meters (FTB-100 and FTB-104) to cover a wide range of water flow rates: 1.3–13.5 LPM and 6.5–60 LPM, respectively. The flow meters were calibrated by the manufacturer with a ±0.5% flow reading accuracy. A six digits ratemeter (Omega DPF-702) is used to display the flow meters readings in LPM.
The high-pressure (10 bar) compressed air is supplied by an air compressor, which is located outside the building. A pressure valve is used to regulate the air pressure to the required air flow rate. An air filter and dryer is located before the air flow meter to supply the test section with clean dry air. The air flow rates are measured by using an air mass flow meter (FMA-1612A-v2), operating in the range of 2.5–500 SLPM. The flow meter was calibrated by the manufacturer with an accuracy of ±0.8% of reading and ±0.2% of FS.
2.2 Phase Mixer
An air–water phase mixer was designed and constructed for this work. Two jets of water enter the mixer from opposite sides and perpendicularly to the axis of the mixer. Air enters the mixer parallel to its axis through a section of porous media with 0.1 mm holes diameters to obtain a smooth air stream. The two-phase mixture leaves the mixer from the opposite side of the air entrance, as shown in Fig. 2.
2.3 Test Section
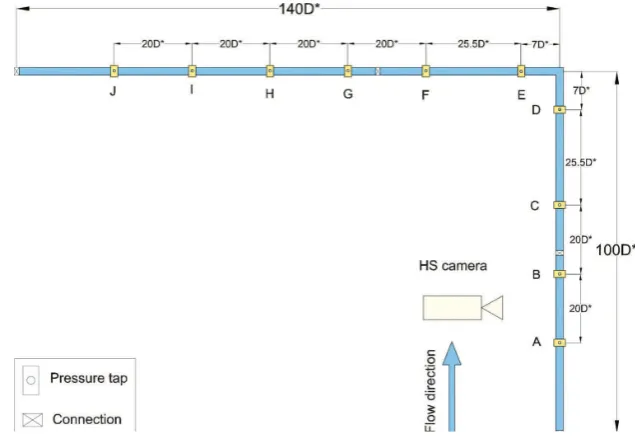
The test section was constructed from commercial acrylic pipes with a wall thickness of
2 mm, a diameter D* = 21 mm and a total length of 240D* (100D* upstream and 140D*
[image:4.496.97.405.434.622.2]downstream of the elbow). The section was assembled from segments which were joined together by using specially designed acrylic flanges. The 90° sharp elbow was constructed by cutting two pipe pieces accurately at a 45° angle and by welding them together using a special acrylic welding solution.
Ten measurement stations are located along the test section to measure the pressure distri-bution, as shown schematically in Fig. 3. Pressure taps were designed for this work and they were machined from the same material of the pipes. After fixing the taps in their locations, 1-mm holes were bored radially through the pipe wall to allow the fluid to flow out without perturbing the flow inside the pipe.
2.4 Data Acquisition
A differential pressure transducer (PX409-10WDWUI) calibrated by the manufacturer with
±0.08% FS BSL accuracy is used to measure the two-phase pressure drop along the test sec-tion. An absolute pressure transducer (PX309-100G5V) is used to measure the absolute pressure in the range of 0–6.8 bar. It was calibrated by the manufacturer with ±0.25% FS BSL uncertainty. A National Instrument data acquisition system with 16-bit resolution and a dedi-cated Labview code are used for data logging of the pressure measurements. Flexible clear pipes with a diameter of 6 mm connect the pressure transducers and the measurement stations.
Type K thermocouples are used with a Picco data logger to measure the air and water tem-peratures at the beginning of each experiment. The thermocouples were calibrated carefully against an accurate thermometer with less than ± 0.5°C accuracy.
The properties for air and water are calculated by using NIST Refprop software [15] by using the measured temperature and pressure for each experiment.
[image:5.496.85.403.406.626.2]A Phantom v210 high-speed HS high-resolution camera is used to study the two-phase flow patterns in the straight pipe upstream of the elbow at 1750 FPS. A white acrylic plate with white LED light is employed as a monitor background to obtain optimum quality vid-eos. The videos at different flow conditions are analyzed to distinguish the observed flow patterns.
202 W. Al-Tameemi & P. Ricco, Int. J. Comp. Meth. and Exp. Meas., Vol. 6, No. 1 (2018)
2.5 Experimental procedure
All experiments are started by regulating the water flow rate to the needed value after record-ing the initial values of pressure and temperature. The connectrecord-ing pipes between the measurement stations and the pressure transducers are then purged from air bubbles. The preparation of the mixture is started after obtaining a steady state water flow by regulating the air flow rate to the needed value manually by using a needle valve. The videos are then cap-tured by the high-speed camera and the pressure drop and the flow temperature are recorded. These steps are repeated for different water and air flow rates at all the measurement stations. Flows with five different water superficial velocities jw*
. .
=0 297 0 678 m/s m/s and 32 air − superficial velocities ja*
. .
=0 1485 24 75 m/s are studied in this work, where − jk* V Ak*
* = / is the superficial velocity of the phase k V, *
is the volume flow rate, and A* is the pipe cross-sec-tional area.
2.6 Uncertainty analysis
The square root of the sum of the sequence method (RSS) [16] is used for the uncertainty analysis. The measuring instruments are either calibrated by their manufacturers or in the lab, as clarified in section 2.4. The uncertainties of the measured values (diameter, length, surface roughness and physical properties) are obtained by direct measurements. The pipe diameter is measured at five different locations by using a micrometer with ±0.1 mm uncertainty. The length of the test section and the distances between the measurement stations are measured
by using measuring tape with ± 1 mm uncertainty, while the pipe surface roughness is
measured by using a Dektak 150 surface profiler with ± 2% uncertainty. The angle of the
assembled 90° sharp elbow is measured carefully by using a special protractor with ± 0.5° uncertainty. The maximum data uncertainties are indicated by error bars in the graphs of section 3.
3 EXPERIMENTAL RESULTS
For the first time, the two-phase pressure drop across a horizontal 90° sharp mitre elbow for 143 different flow conditions is investigated. The experimental data for the flow visualization and pressure measurements are presented in this section.
3.1 Flow Visualization
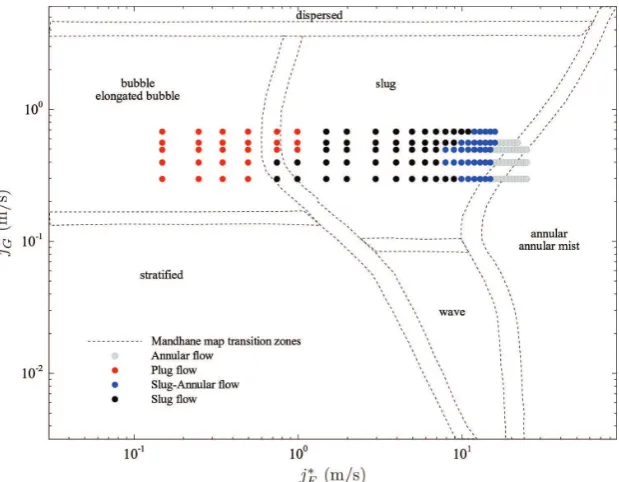
Four different flow patterns (plug, slug, slug-annular and annular) are observed, as shown in Fig. 4. The flow patterns are divided into two groups: (i) intermittent patterns, which include the plug and slug patterns, and (ii) continuous patterns, which include the slug-annular and annular patterns. Figure 5 depicts a comparison between our experimentally observed flow patterns and Mandhane [4]’s predicting map for horizontal pipes. About 70% of the experi-mental flow patterns are predicted by the map, 20% of the data are located in the boundary regions, while 10% of the data are unpredictable by the map because they are located in dif-ferent regions.
3.2 Pressure Distribution
Figure 4: Flow patterns in horizontal pipe upstream of the elbow for jw* =0 495 m/s and . different ja* values.
[image:7.496.95.405.343.584.2]204 W. Al-Tameemi & P. Ricco, Int. J. Comp. Meth. and Exp. Meas., Vol. 6, No. 1 (2018)
[image:8.496.96.403.205.333.2]downstream of the elbow for different flow patterns. Figure 6a depicts the pressure distribu-tion for an intermittent flow pattern case. The pressure increases slightly between stadistribu-tions C and D before dropping after station D upstream of the elbow. Downstream of the elbow, the effect of the elbow lasts longer than upstream of it and it disappears after station G.
[image:8.496.94.399.373.610.2]Figure 6b shows that, upstream of the elbow, the perturbation starts from station D for the continuous flow, while downstream of the elbow the flow recovers after station G, similar to the effect in intermittent flow pattern case. The elbow pressure loss for both intermittent and continuous patterns was computed as the difference between the intercepts on the y-axis of the two best fit straight lines defining the straight pipe pressure gradient upstream and downstream of stations C and G (dash-dotted blue lines), as shown in Fig. 6.
Figure 6: Pressure distribution along the test section at jw*
. =0 4 m/s.
3.3 Pressure Drop in 90° Elbow
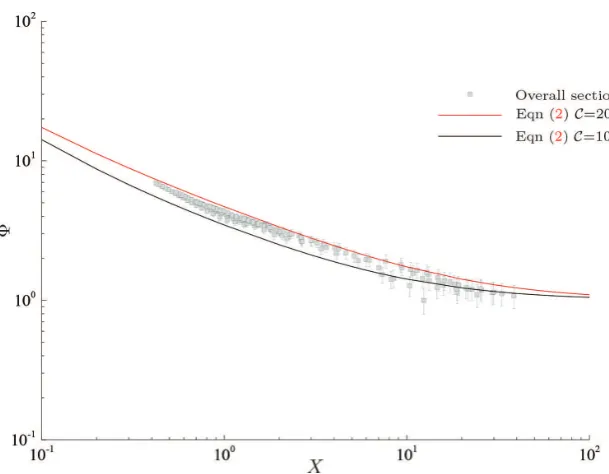
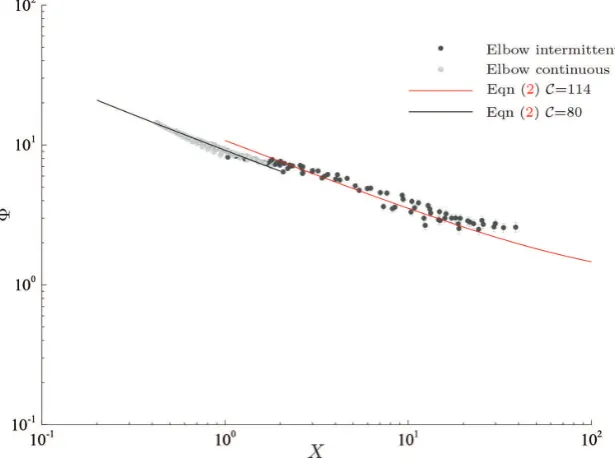
Figure 7 shows the scaled experimental data of the two-phase multiplier Φ fitted with the Lockhart–Martinelli correlation, given by eqn. (2) [6]. The two-phase multiplier Φ across the whole test section between stations A and J is comprised between the correlation curves eqn. (2) for C= 10 and C= 20. The scatter is due to the additional factors generated by the elbow, such as the severe flow separation and significant perturbation of the flow patterns. The pressure drop per unit length (dp*/dz*) across the elbow is larger than across the whole section section and it is strongly affected by the flow patterns, as depicted in Fig. 8.
There-fore, we choose to use two C parameters, one corresponding to the intermittent patterns
(slug and plug) and one corresponding to the continuous patterns (slug-annular and annu-lar). The new values are C= 114 ± 9.4% for intermittent patterns and C= 80 ± 2.9% for continuous patterns.
4 CONCLUSIONS
This work proved the ability of Lockhart–Martinelli method to fit the pressure data across a horizontal 90° sharp elbows for different flow patterns. Further investigations will be con-ducted in vertically oriented elbows with different pipe diameters.
ACKNOWLEDGEMENTS
[image:9.496.94.402.73.306.2]The authors are highly acknowledged the financial support for this work by the Iraqi Ministry Of Higher Education and Scientific Research.
206 W. Al-Tameemi & P. Ricco, Int. J. Comp. Meth. and Exp. Meas., Vol. 6, No. 1 (2018)
REFERENCES
[1] Brennen, C., Fundamentals of Multiphase Flow. Cambridge University Press, 2005.
[2] Thome, J., Engineering data book III, 2004.
[3] Baker, O., Simultaneous flow of oil and gas. Oil and Gas Journal, 53, pp. 185–195, 1954.
[4] Mandhane, J., Gregory, G. & Aziz, K., A flow pattern map for gas-liquid flow in hori-zontal pipes. International Journal of Multiphase Flow, 1(4), pp. 537–553, 1974. https://doi.org/10.1016/0301-9322(74)90006-8
[5] Cheng, L., Ribatski, G. & Thome, J., Two-phase flow patterns and flow-pattern maps: fundamentals and applications. Applied Mechanics Reviews, 61(5), p. 050802, 2008. https://doi.org/10.1115/1.2955990
[6] Lockhart, R. & Martinelli, R., Proposed correlation of data for isothermal two- phase, two-component flow in pipes. Chemical Engineering Progress, 45(1), pp. 39–48, 1949. [7] Chisholm, D., A theoretical basis for the Lockhart-Martinelli correlation for two-phase
flow. International Journal of Heat and Mass Transfer, 10(12), pp. 1767–1778, 1967. https://doi.org/10.1016/0017-9310(67)90047-6
[8] Qiao, S., Mena, D. & Kim, S., Inlet effects on vertical-downward air–water two- phase flow. Nuclear Engineering and Design, 312, pp. 375–388, 2017.
https://doi.org/10.1016/j.nucengdes.2016.04.033
[9] Kim, S., Park, J., Kojasoy, G. & Kelly, J., Local interfacial structures in horizontal bub-bly flow with 90-degree bend. International Conference on Nuclear Engineering, 2, pp. 219–226, 2006.
[10] Kong, R. & Kim, S., Characterization of horizontal air–water two-phase flow. Nuclear Engineering and Design, 312, pp. 266–276, 2017.
https://doi.org/10.1016/j.nucengdes.2016.06.016
[11] Mishima, K. & Hibiki, T., Some characteristics of air-water two-phase flow in small diameter vertical tubes. International Journal of Multiphase Flow, 22(4), pp. 703–712, 1996.
https://doi.org/10.1016/0301-9322(96)00010-9
[12] Zhao, T. & Bi, Q., Pressure drop characteristics of gas–liquid two-phase flow in verti-cal miniature triangular channels. International Journal of Heat and Mass Transfer, 44(13), pp. 2523–2534, 2001.
https://doi.org/10.1016/s0017-9310(00)00282-9
[13] Lee, H. & Lee, S., Pressure drop correlations for two-phase flow within horizontal rect-angular channels with small heights. International Journal of Multiphase Flow, 27(5), pp. 783–796, 2001.
https://doi.org/10.1016/s0301-9322(00)00050-1
[14] Kim, S., Kojasoy, G. & Guo, T., Two-phase minor loss in horizontal bubbly flow with
elbows: 45-degree and 90-degree elbows. Nuclear Engineering and Design, 240(2),
pp. 284–289, 2008.
https://doi.org/10.1016/j.nucengdes.2008.08.019
[15] Lemmon, E., Huber, M. & McLinden, M., NIST Standard ReferenceDatabase 23: Reference Fluid Thermodynamic and Transport Properties - REFPROP. 9.0., 2010.
[16] Taylor, J., An introduction to error analysis 2nd edn. University Science Books,
NOMENCLATURE
Symbol Description Units
Abbrevations
m* Mass low rate kg/s
V
* Volume low rate m3/sC Lockhart-Martinelli experimental constant
-A* Pipe cross sectional area m2
BSL Best straight it line
-D* Pipe diameter m
FPS Camera speed Frame/s
FS Full scale
-j* Supericial velocity m/s
LPM Litre per minute
-p* Pressure Pa
Re Reynolds number
-SLPM Standard litres per minute
-z* Length m
Greek symbols
Two-phase flow multiplier
-Scripts
a Air
F Liquid-phase
G Gas-phase
k Flow phase
tp Two-phase