o f X -ra y S e le c te d
A c tiv e G a la c tic N u c le i
fro m t h e H E A O -1 S u r v e y
Roger James Verge Brissenden
November, 1989
A thesis submitted for the degree of
Doctor of Philosophy
S t a t e m e n t b y t h e c a n d id a te
The work contained in this thesis is that of the candidate alone except where acknowledged in the text and below.
This thesis results from a program to identify the optical counter parts of ~ 600 X-ray sources from the HEAO-1 all-sky survey. The program has resulted in a six year collaboration between researchers at the Australian National University (ANU), the Massachusetts Institute of Technology (MIT) and the Harvard-Smithsonian Center for Astrophysics (CfA). The work has been carried out by Dr. I. R. Tuohy, Dr. D. A. H. Buckley, myself (ANU), Prof. H. V. Bradt, Dr. R. A. Remillard (MIT), Dr. D. A. Schwartz and Ms. W. Roberts (CfA).
The work presented in this thesis falls into two categories: (1) the discovery of newly identified active galactic nuclei (AGN) as the optical coun terparts of HEAO-1 X-ray sources and (2) multiwavelength observations and analysis of a sample of the newly identified AGN. Chapters 2 and 7 are pre sented in the form of scientific journal articles which have either been accepted (Chapter 7) or submitted (Chapter 2) for publication by the Astrophysical
Journal. The papers are:
“Thirteen New X-ray Selected AGN from the HEAO-1 All-sky Sur vey” , Brissenden, R. J. V., Tuohy, I. R., Remillard, R. A., Bradt, H. V., and Schwartz, D. A. (Chapter 2).
“H1722+119: A Highly Polarized X-ray Selected BL Lacertae Ob
ject” , Brissenden, R. J. V., Remillard, R. A., Tuohy, I. R., Schwartz, D. A., and Hertz, P. L. (Chapter 7).
Chapter 2
Tuohy Assisted with spectral, photometric and radio observations, made com ments on the completed manuscript.
Rem illard Assisted with spectral and photometric observations, provided the X-ray data presented in Table 1 and Figure 1.
Bradt and Schwartz Made comments on the completed manuscript.
Chapter 7
Tuohy Assisted with spectral, photometric, radio and polarimetric observa tions, made comments on the completed manuscript.
Rem illard Contributed some photometric, spectral and CCD observations and made substantial comments relating to the section “X-ray Observa tions and Identification”.
Schwartz Assisted in the calculation of the X-ray spectral index of H1722+119 and made comments on the completed manuscript.
H ertz Made one VLA radio measurement.
This includes telescope proposals, observations, data reduction and interpre tation.
All remaining aspects of the papers were contributed by myself.
To Deborah for
her love and support, and to my parents
for their
I take pleasure in thanking my supervisors, Dr. Ian Tuohy and Dr. Geoff Bicknell for their support during this thesis. Dr. Tuohy’s lessons in careful observing and his good humour during many observing trips were appreciated as was Dr. Bicknell’s refreshingly fundamental approach to as- trophysical questions. The value of the ANU/MIT collaboration has been immense and I thank Prof. Hale Bradt and Dr. Ron Remillard for adding an international flavour to this work. I am indebted to Dr. Remillard for focusing many thoughts and teaching me how to meet impossible deadlines.
During this thesis, observations were made at many institutions both in Australia and the United States and I thank all those who made me welcome and provided such professional assistance. In particular, I am grateful to the staff of Mount Stromlo and Siding Spring Observatories (MSSSO), the Anglo-Australian Observatory (AAO), the Parkes Radio Telescope, the Fleurs Synthesis Telescope, Goddard Space Flight Center (IUE), the Very Large Ar ray, the Infrared Processing and Analysis Center and the Center for Space Research at the Massachusetts Institute of Technology.
The observations, analyses, conferences and collaboration under taken in the United States were made possible by the generous support of the Department of Industry, Technology and Commerce under the Australia/US Cooperative Science Program and funding from the International Astronomi
cal Union and the Australian National University. The support of a Common wealth Postgraduate Research Award is also acknowledged as is the support of the telescope time allocation committees of MSSSO, the AAO, Parkes and the National Aeronautics and Space Agency. I thank Ms W. Roberts for providing
I th an k Profs. D. S. M athewson and A. W. Rodgers for th eir guid ance as directors of MSSSO and the staff and students for th e m any friendships I have m ade during th e last four years, making life on th e M ountain so pleas ant. I also th an k Drs. M. A. D opita and P. J. M cGregor for m any useful discussions.
already made, but not to make one.
— Albert Einstein, 1934.
X-rays will prove to be a hoax.
V l l l
A b stra ct
M ultifrequency d a ta for a sam ple of 35 newly identified Ac tive G alactic Nuclei (A G N ) from th e High Energy A stronom y O bserva to ry (H EAO -1) all-sky survey are presented. T he sam ple is com prised of 24 Seyfert 1 galaxies, 8 quasars and 3 BL Lacertae o b jects, w ith 0.01 < z < 0.24 an d 14 < V < 1 7 m ag. T h e discoveries of 13 of th e emission-line AGN an d one BL Lac object are described in detail. T h e b ro ad -b an d Spectral Energy D istrib u tio n s (SED ) are c o n stru cted from X-ray, ultrav io let, optical, near-infrared, far-infrared an d radio m easurem ents an d a n u m b er of p aram eters relating to th e basic em ission com ponents of th e AGN are derived.
T h e SED of th e m a jo rity of objects exhibit th ree emission com ponents: an infrared - X -ray pow er-law , an optical - u ltrav io let excess above th e power-law (big blue b u m p ) an d a radio com ponent th a t is distinct from th e infrared - X -ray energy d istrib u tio n . T he n ear an d far-infrared colour d istrib u tio n s are generally co n sisten t w ith a n o n th erm al origin and strong correlations betw een b o th th e n ear and far-infrared lum inosities an d the in frared and X -ray lum inosities su p p o rts th e conclusion. T h e radio emission ap p ears to be u n connected to th e in frared - X -ray power-law.
T h e d istrib u tio n of th e in frared - X -ray pow er-law indices, defined by /„ oc i/- " ’1, is rem arkably uniform w ith o ,x = 1 .03± 0.15. T h e d istrib u tio n argues for a com m on n o n th e rm a l continuum com ponent op eratin g over 6 decades of energy in all AGN.
H/7 lum inosities of th e sample. The bum p acts as an additional source of ionizing photons to th e underlying power-law continuum which are efficient at producing H/+ The correlation betw een the big bum p and X-ray lum inosity m ay arise if th e X-ray radiation directly produces the bum p lum inosity, for exam ple by th e heating of a accretion disk.
We investigate a num ber of emission-line correlations and find strong relationships between X-ray lum inosity and both Hß and [0 III] lu minosity, w ith th e Hß - X-ray relation being the tighter. The EW of Fe II
is found to decrease w ith increasing FW HM of Hß which m ay indicate th a t th e Fe II is being collisionally de-excited. In addition we extend a previous study of th e X-ray spectral and Fe II properties of AGN and find support for a correlation between softer X-ray spectra and larger Fe Il/H /L
T he broad-band spectrum of the quasar H0557—503 is investigated in detail. The object possesses an extrem e big blue bum p which we model as th e emission from an optically thick, geom etrically thin, classical steady- sta te accretion disk. X-ray spectra from E X OS A T and ultraviolet spectra from IUE offer th e m ost convincing evidence for a big blue bum p th a t ex tends from optical to X-ray energies. The d a ta constrain th e m odel to re quire highly super-E ddington luminosities corresponding to very low black- hole masses ( ~ 107 M@) and high accretion rates ( ~ 100 M@ y r_1). T he d a ta seriously challenge th e current models for th e big blue bum p.
C o n te n ts
Statement by the C a n d id a te ... ii
Acknowledgements ... v
A b s tra c t ... viii
C h a p te r 1. In tro d u ctio n ... 1
1.1 The HEAO-1 Identification Program ... 1
1.2 Outline of the T h e s is ...2
1.3 The HEAO-1 Mission ... 4
1.4 The Optical Identification Technique ... 5
1.5 The Classes of X-ray S o u rc e ... 7
1.5.1 The Galactic Sources ... 8
1.5.2 The Extragalactic Sources ... 10
1.6 References ... 12
C h a p te r 2. Thirteen New X-ray Selected AGN From the HEAO-1 All-sky Survey ... 15
2.1 Abstract ... 15
2.2 Introduction ... 16
2.3 X-ray Positions and Identification ... 17
2.4 Optical Identification and O bservations... 18
2.4.1 Candidate Selection ... 18
2.4.2 Spectroscopic O bservation... 18
2.4.3 Photometry ... 20
2.4.4 Radio Observations ... 21
2.5 Results ... 23
2.6 Comments on Individual Objects ... 35
2.8 Acknowledgements... 42
2.9 References ... 42
C hapter 3. Active Galactic Nuclei: A Review ... 45
3.1 AGN and the Standard Model ... 45
3.2 X-ray Observations of AGN ... 50
3.3 IUE Observations of AGN ... 52
3.4 IRAS Observations of AGN ... 53
3.5 Radio Observations of A G N ... 55
3.6 Optical Polarization in AGN ... 57
3.7 The Multiwavelength Continua of AGN ... 58
3.8 References ... 63
Chapter 4. Multiwavelength Data for the Sample ... 69
4.1 Introduction ... 69
4.2 X-ray Observations of the Sample AGN ... 71
4.3 Optical Spectra ... 74
4.3.1 Spectral Observations ... 74
4.3.2 Spectral Reduction ... 75
4.4 Ultraviolet S p e c tra ... 79
4.5 Optical and Infrared P h o to m e try ... 94
4.5.1 Optical Photometric Observations and Reduction ... 99
4.5.2 Infrared Observations and Reduction ... 103
4.6 Polarimetry ... 103
4.7 Coadded IRAS Results ... 109
4.8 Radio M easurem ents... 112
4.8.1 Parkes Observations and Reduction ... 113
4.8.2 Fleurs Observations and Reduction ... 116
118 4.9 The Basic Properties of the AGN ...
4.10 References ...
Appendix A: Fundamental Formulae ...
A.l The F o rm u lae...
A.2 Rest Wavelength of Useful Lines ...
A.3 Continuum Measurements ...
A.4 Unit C onversions...
Appendix B: 24 Serendipitous Emission Line Objects ..
C hapter 5. Broad-band Spectral Energy Distributions and Correlations of the AGN ...
5.1 Introduction ...
5.2 Spectral Energy Distributions ...
5.3 The Big Blue Bump ...
5.4 Selection Effects and Statistics ...
5.4.1 Selection Effects ...
5.4.2 Statistical Analysis ...
5.5 Infrared Emission from A G N ...
5.5.1 The Near-infrared Colours ...
5.5.2 The Far-infrared Colours ...
5.6 Broad-band Spectral Properties ...
5.7 Linear Correlations ...
5.7.1 Statistical Analysis ...
5.7.2 Continuum Radiation Correlations ...
5.7.3 Emission Line Correlations ...
5.8 Fe II Emission and X-ray Spectrum ...
5.9 Big Bump Correlations ...
5.10 Discussion and Summary ... . xii
129
132
132
134
134
138
139
152
152
154
197
204
204
205
207
207
212
217
224
224
225
233
241
246
5.11 References...251
Chapter 6. The Ultraviolet and Soft X-ray Excess of the Unusual QSO H0557—503 ... 255
6.1 In tro d u ctio n ... 255
6.2 X-ray Observations ... 258
6.3 Broad-band Spectrum ... 259
6.4 The Simple Accretion Disk Model ... 264
6.5 Models of H0557-503 ... 270
6.6 Conclusions ... 276
6.7 References ... 277
Chapter 7. H1722-1-119: A Highly Polarized X-ray Selected BL Lacertae Object ... 279
7.1 Abstract ... 279
7.2 In tro d u ctio n ... 280
7.3 X-ray Observations and Identification ... 281
7.4 Optical Spectrum and Polarimetry ... 284
7.4.1 Spectral Observations ... 284
7.4.2 Polarization Measurements ... 287
7.5 The Multiwaveband Spectrum ... 290
7.5.1 Radio Observations ... 290
7.5.2 Photometry ... 291
7.5.3 UV Spectrum ... 292
7.6 Discussion ... 293
7.7 Source Models for H1722-fll9 ... 298
7.7.1 Application of SSC to H1722-fll9 ... 300
7.7.2 Magnetic Field Strength of H1722+119 ... 305
XIV
7.9 References ... 308
C hapter 8. Summary and Future W ork... 312
8.1 Thesis Summary ... 312
8.2 Future W o rk ... 315
List o f F igures
2.1 X-ray Maps for the A G N ... 24
2.2 A AT Spectra ... 29
2.3 2.3 m S p e c tra ...32
3.1 Broad-band Spectra of radio-quiet and radio-loud AGN ... 59
4.1 Broad-band Instrumental C overage... 72
4.2 X-ray Maps for the A G N ...73
4.3 Optical spectra of the Sample AGN ... 80
4.4 Ultraviolet Spectra of the Sample A G N ... 96
4.5 Radio Map for the QSO H2044—032 ... 121
4.6 Optical Spectra of the Serendipitous Emission Line objects(Appendix B) ... 140
5.1 Broad-band Spectral Energy D istributions... 157
5.2 The Distribution of the Infrared - X-ray Power-law Indices ... 198
5.3 Near-infrared Colour Diagram for the Sample ... 209
5.4 Near-infrared Colour Diagram for AGN ... 210
5.5 Infrared Flux Correlation for the AGN Sample ... 214
5.6 IRAS Colour Diagram for the Sample ... 216
5.7 Broad-band Spectral Plot for the Sample ... 219
5.8 Broad-band Spectral Plot for A G N ...223
5.9 K Band and X-ray Correlation ... 228
5.10 IRAS 25 fim and X-ray Correlation ... 229
5.11 Radio and X-ray Correlation - Present Sample ... 231
5.12 Radio and X-ray Correlation - Piccinotti and Present S am ple...232
5.13 Integrated Eß and 2 — 10 keV X-ray Correlation ... 234
5.14 Integrated [0 III] and 2 — 10 keV X-ray C orrelation...235
XVI
5.16 FWHM H/3 and Equivalent Width F ell Correlation ... 239
5.17 Optical F ell and Soft X-ray Spectral Slope Correlation ... 244
5.18 X-ray and H/3 Luminosity Correlation ... 247
6.1 Broad-band Spectrum of H0557—503 ... 260
6.2 Components of the 3000 Ä Bump ... 262
6.3 Spectra in the Region of the 3000 Ä Bump ... 263
6.4 Fitting the 3000 Ä Bump ... 265
6.5 Simple Accretion Disk Model Temperature Profile ... 269
6.6 Constraints on Mass and Accretion Rate for H0557—503 ... 272
6.7 Two Model Fits for the UV Excess of H0557—503 ... 273
7.1 X-ray Detections of H1722+119 ... 283
7.2 Finding Chart: H1722+119 ... 286
7.3 Optical Spectrum: H1722+119 ... 288
7.4 Polarization Data: H1722+119 ... 289
7.5 Broad-band Spectrum: H1722+119 ... 294
7.6 H1722+119 Broad-band Spectral Fit ... 302
L ist o f T ables
1.1 Galactic X-ray Sources ... 10
1.2 Extragalactic X-ray S o u rces... 11
2.1 MC X-ray Observations ... 19
2.2 Radio Observations ... 22
2.3 Observing Log and Classification ... 26
2.4 The AGN: Observational Data ... 27
2.5 Optical Spectral M easurem ents... 34
3.1 Classification of AGN ... 46
4.1 Observing Log for the AGN Sample ... 76
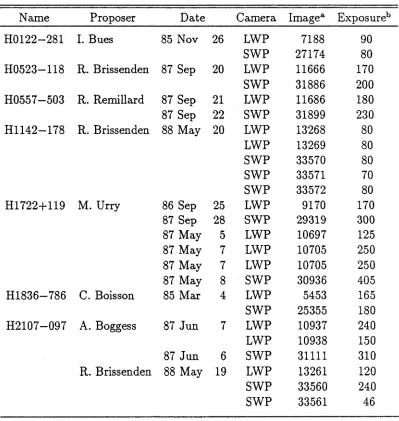
4.2 Observation of AGN with IUE ... 95
4.3 Emission Line Properties for IUE Observed A G N ... 98
4.4 Optical Photometric Observations of the AGN S a m p le ... 100
4.5 Infrared photometry of the AGN Sample ... 104
4.6 Polarimetrie Observations of the AGN S a m p le ... 107
4.7 IRAS Coadded Results for the AGN S a m p le ... 110
4.8 Parkes and Fleurs Observations ... 114
4.9 VLA Flux Data ... 119
4.10 VLA Positional Data ... 120
4.11 Basic Properties of the HEAO-1 A G N ... 123
4.12 Optical Spectral Measurements ... 126
4.13 Line Flux Reddening Correction ... 128
4.14 Basic Properties of the Serendipitous Objects (Appendix B) ... 148
4.15 Infrared Observations of the Additional Objects ... 149
4.16 Optical photometry of the Additional Objects (Appendix B ) ... 150
4.17 Parkes radio data for the Serendipitous Objects (Appendix B) . . . . 151
XV111
5.2 Power-law Fits ... 194
5.3 Big Bump Parameter ... 200
5.4 Big Bump Luminosity Parameter ... 203
5.5 IRAS Indices ... 215
5.6 Broad-band Spectral Indices ... 218
5.7 Statistics of the Broad-band Spectral Indices ... 221
5.8 Statistical Regression and Correlation ... 226
5.9 Fe II and X-ray Spectral D a t a ... 243
5.10 AGN Parameters and Emission Regions ... 249
7.1 H1722+119: Properties ... 285
1.
I n tr o d u c ti o n
1.1
T h e H E A O -1 Id e n tif ic a tio n P r o g r a m
Surveys of the celestial sphere at non-optical wavelengths have resulted in great advances in our understanding of both galactic and extragalactic phenomena. The earliest surveys were made at radio wavelengths and included the Parkes and Cambridge surveys (Wall et al. 1971; Bennett 1962). Identification of the optical counterparts of these sources led to the discovery of QSOs and radio galaxies. More recently, the all-sky survey of the Infrared Astronomical Satellite (IRAS; Neugebauer et al. 1984) provided a picture of the far-infrared (12 fim - 100 /Im) sky. Results from these data included the discovery of dis crete bands of emission girdling the solar system, probable protostars which allowed a greater understanding of the formation of low mass stars, the diffuse galactic emission and a new class of “super luminous” infrared galaxy emit ting greater than 95% of their luminosity in the infrared (see Beichman 1987, Soifer et al. 1987 and references therein). In the ultraviolet, the International Ultraviolet Explorer (IUE), whilst not a survey instrument, has contributed to many areas including cometary comae (Bertaux et al. 1973), high excitation stellar atmospheric physics (e.g., Jordan and Linsky 1987) and our understand ing of the broad-band continua of Active Galactic Nuclei (AGN; e.g., Malkan 1983).
At hard (2 — 10 keV) X-ray wavelengths, the 842 sources detected by the Large Area Sky Survey (LASS) instrument onboard the first High En ergy Astronomy Observatory (HEAO-1) satellite, represent the most recent, complete and sensitive all-sky survey. The identification of the optical coun terparts to these sources was made difficult by the poor positional constraints
provided by the X-ray data and required additional broad-band techniques. A collaborative program commenced in 1983 between researchers at the Aus
2
from the Modulation Collimator (MC) and LASS experiments of HEAO-1, together with a UV-excess search method. Of the identified sources, > 100 were previously unknown objects and included both galactic and extragalactic objects. The work presented in this thesis stems from the program and focuses on the discovery and broad-band spectral properties of 35 previously unknown AGN (hereafter “the sample'’).
The most fundamental question in AGN research remains the origin of the enormous luminosity emitted across the electromagnetic spectrum, from radio to X-ray frequencies. Variability studies of AGN at different frequencies suggest that the higher frequency radiation originates from a smaller spatial re gion than the lower frequency emission and has prompted a “standard” model where radiation of progressively lower frequency arises from regions of increas ing spatial extent. We are motivated to study the broad-band continuum of a sample of hard X-ray selected AGN in order to test, at a basic level, the relationship between the X-ray emission and associated underlying power-law energy distribution, and the processes at other (lower) frequencies. The AGN from the HEAO-1 survey represent the brightest examples of their class and are ideal for multiwavelength study.
The discovery of 44 new AGN resulting from the identification pro gram have been published in three papers: Remillard et al. (1986; hereafter Paper I), Remillard et al. (1989a; hereafter Paper II) and Brissenden et al.
(1989a; hereafter Paper III). The discovery of five BL Lacertae objects have been presented separately (Remillard et al. 1989b; Brissenden et al. 1990). Preliminary results of this study have been presented by Brissenden et al.
1987, Brissenden et al. 1989c and Remillard et al. 1988.
1.2
O u tlin e o f th e T h esis
chapters. A final chapter presents conclusions and suggestions for future work.
The contents of each chapter are described in more detail below.
In the remainder of this chapter we review the HEAO-1 mission, the instruments carried and surveys conducted (§1.3), describe the optical identification technique (§1.4) and review the classes of X-ray source detected by the HEAO-1 and previous missions. Chapter 2 (Paper III) describes the discovery and classification of thirteen AGN included in the sample.
A review of multiwavelength observations of AGN is presented in Chapter 3, with emphasis placed on the interpretation of the broad-band con- tinua. In Chapter 4 we give the multiwavelength data for the sample AGN including optical spectra, optical photometry, near-infrared photometry, IRAS data, radio flux and spectral measurements, ultraviolet spectra (in some cases) and X-ray fluxes. Polarization data are given for ~ 30% of the sample and we present line flux and width measurements for selected emission lines derived from the optical and ultraviolet spectra. In one appendix, commonly used formulae are listed and in a second appendix we present optical spectra and some multi wavelength data for 24 emission line objects (mainly H II regions
and high redshift QSOs) discovered serendipitously during the program.
In Chapter 5 the broad-band spectra of the full sample of AGN are constructed and various emission components identified. A number of parameters based on the deconvolution of the components are derived for each
object and their relationships with the underlying emission mechanisms and other basic properties of the AGN, investigated.
Chapter 6 contains a detailed analysis of the broad-band spectrum of the QSO H0557—503. Particular attention is paid to the high quality X-ray and UV spectra available for the object, in the context of current accretion disk models for the UV - X-ray excess or i4big blue bump”. Chapter 7 is the paper “H1722+119: A Highly Polarized X-ray Selected BL Lacertae Object” . In addition to describing the observations leading to the BL Lac classification,
calculations are made within the framework of the Synchrotron Self Compton model to show that relativistic boosting may not be important in the object.
4
and consider in particular, the impact of the next generation of space based missions on multiwavelength studies of AGN.
1.3
T h e H E A O -1 M issio n
Since the discovery of X-rays from outside the solar system (Giacconi et al.
1962) and the early balloon experiments, there have been two phases in the
development of X-ray astronomy. The first phase comprised a series of non imaging low earth-orbit satellites (UHURU, SAS-3, Ariel V, OSO-8, Vela)
carrying proportional counter experiments and culminating with the HEAO-1 mission in 1978-9. These missions carried scanning experiments and made all sky surveys. The second phase commenced after HEAO-1 with satellites such as HEAO-2 (Einstein Observatory), EXOSAT, TENMA and GING A which had pointing capabilities and carried both imaging and spectroscopic experi ments covering a variety of energy ranges. These missions have provided the most detailed understanding of the X-ray emission mechanisms in individual objects however, since none of the missions after HEAO-1 performed an all sky survey, the 842 sources detected by the LASS experiment (2 — 10 keV) constitute the most sensitive all-sky survey of the X-ray sky.
The HEAO-1 satellite was launched on August 12, 1977 and made 3 complete scans of the sky during the 17 months of operation. The satellite carried four experiments denoted A1-A41.
A l The LASS experiment consisted of 7 proportional counters sensitive to the energy range 1 —20 keV. The all-sky survey detected 842 sources with a flux greater than 0.22 /zJy at 5.2 keV (Wood et al. 1984) while utilizing only the first of 3 celestial scans by the observatory. The LASS produced error boxes between 0.01 and 1 degree2 as a function of X- ray flux. The positions of the fainter sources were poorly constrained
and identification of the optical counterpart was very difficult without information from other detections (e.g., from the MC experiment or from the X-ray images provided by the Einstein or EXO SAT Observatories).
A2 The experiment consisted of 6 multilayer proportional counters, and was less sensitive than A1 but covered a broader energy range, 0.2 — 60 keV, and allowed low-resolution X-ray spectroscopy (Marshall et al. 1979; Pic- cinotti et al. 1982; Nugent et al. 1983). The subgroup of extragalactic sources from the survey (Piccinotti et al. 1982) forms a complete sample of the 89 brightest X-ray sources at high galactic latitude. We use the subset of ~ 30 AGN contained within the Piccinotti et aL sample to extend the X-ray flux range of our sample AGN (see Chapter 5). The Piccinotti et al. AGN have been the target of an independent multiwave length study (Carleton et al. 1987; Unger et al. 1987).
A3 The Modulation Collimator experiment consisted of two banks of argon filled proportional counters (MCI and MC2) sensitive to the energy range 1 — 13 keV. Each bank was covered with layered grids of wires which modulated incoming X-rays as the detectors scanned across the source. A set of positional bands for each detector is derived from the phase of the detected transmission peaks. Since the grids of wires producing the modulation were rotated by 20°, the allowed positional bands intersected, producing a multiplicity of parallelograms (or “diamonds”). The error diamonds had a maximum size of P x 4' at a confidence level of 90%. When combined with detections from the LASS experiment, the MC positions reduce the search area for the optical counterpart typically by a factor of 40 (the counterpart was expected to be within one of these diamonds). This was one of the important criteria for the optical searches conducted by the ANU/MIT/CfA collaboration.
A4 The instrument, comprised of 7 scintillation counters, detected high energy X-rays and low energy gamma-rays in the range 13 — 2300 keV and the resulting ~ 70 sources have been catalogued by Levine et al. (1984).
1.4
T h e O p tic a l Id e n tif ic a tio n T e c h n iq u e
6
the source substantially reduces the search area for the optical counterpart, however wide field techniques are still required. As a preliminary to the op tical identification technique, the MC diamond positions are combined with the LASS error box and the error regions from other surveys such as UHURU
and Ariel V, to produce an X-ray “map”. There were typically between 6 and
40 MC diamonds lying within, or close to the LASS error box.
The identification technique comprised four steps2:
1. The available catalogues (~ 80) containing known X-ray emitting classes were searched for objects positionally coincident with allowed X-ray po sitions. The procedure sometimes resulted in the identification.
2. The Palomar Observatory Sky Survey (POSS) or European Southern Observatory (ESO) sky survey plates were examined for obvious can didates (prominent galaxies, clusters of galaxies, bright [V < 10] stars etc.).
3. Ultraviolet excess is a well established characteristic of both galactic (Bradt and McClintock 1983) and extragalactic X-ray sources (e.g., Stein
et al. 1976) and we used this property to select candidate objects. A
U- and B- double-exposed Schmidt plate centered on the LASS error box was taken with either the KPNO, CTIO, Uppsala or UK Schmidt telescopes. The resulting pairs of U/B images were examined for UV- excess objects lying in an MC diamond and near the LASS error box. There were typically 3 —5 such objects that were considered as candidates for spectroscopic observation.
4. Spectroscopic observations were made to classify the candidate objects,
and fully assess their candidacy as optical counterparts.
The probability that a given candidate object was the X-ray source was evaluated by considering: (1) the position relative to X-ray positional
constraints, (2) the significance of the X-ray detection, (3) spectral classifi cation, (4) implied Lx/L opt relative to others in the class and (5) probability
identification was very probable and a UB” that the optical evidence supported the identification but the X-ray data were not conclusive in constraining the position3.
1.5
T h e C la sse s o f X -r a y S o u r c e
The number of identified X-ray sources increased rapidly with the higher po sitional accuracy of the the modulation collimator and imaging experiments flown on HEAO-1 and subsequent missions. By 1983, 20 years after the discov ery of X-rays from outside the solar system, only ~ 95 galactic and ~ 100 ex- tragalactic sources had been optically identified (Bradt and McClintock 1983; Piccinotti et al. 1982). However, by 1988 with the identification of the HEAO- 1 sources from this program and the serendipitous objects resulting from the
Einstein and EXO SAT missions (§3.2), ~ 1000 galactic and ~ 800 extragalac-
tic sources had been optically identified4 *.
The division of X-ray sources into galactic and extragalactic seems a natural one. Extragalactic sources are generally much more luminous than galactic objects and while we might expect to observe some galactic phenomena in nearby galaxies, on the whole, we expect to detect different types of objects. Taking a physical approach, we find that X-rays, which are photons in the energy range 0.1 — 200 keV, are produced either thermally or non-thermally and that these mechanisms are observed in both galactic and extragalactic sources. Thermal X-rays are produced at temperatures > 106 K and indicate the presence of hot gas. Non-thermal X-rays are thought to be produced by the release of gravitational potential energy (in the accretion process) or by the synchrotron radiation process, and are the most likely source of luminosity in the majority of identified X-ray sources.
3A third “C” classification for possible identifications was also used but none of the objects considered in this thesis fell into that category.
3
1.5.1
T h e G a la ctic Sources
Galactic X-ray sources may be separated into four broad classes: isolated stars, binary systems, supernova remnants (SNR) and the hot interstellar medium (e.g., Bradt and McClintock 1983). Of these, only objects from the first two classes contributed to the HEAO-1 MC detections since they are point sources. Diffuse sources such as SNR are better detected by imaging experiments.
Isolated Stars Observations of soft X-rays with the Einstein Observatory
have shown that all stars emit X-rays at some level (Vaiana et al. 1981). Thermal X-rays from relatively close normal stars with active chromo spheres or coronae account for many of the galactic detections by HEAO- 1. Also, soft emission has been detected from the surfaces of White Dwarfs.
B inary System s The source of X-rays detected from accreting binary sys tems is thought to be the accretion of gas from a “normal” companion onto either the surface or an accretion disk of the accreting (primary) star. The systems with the most massive (> 20 M©) companion stars are the high mass X-ray binaries (HMXB) in which mass from an early type star accretes onto a neutron star. The two stars are in close prox imity with rotation periods commonly days - weeks and material flows continuously either through the Roche Lobe’s inner Lagrangian Point or via a substantial stellar wind. The optical light output is dominated by the early type companion in these systems. The strongest evidence for galactic black hole candidates have come from the observation of the low mass X-ray binary (LMXB) X-ray nova A0620—00 (McClintock and Remillard 1986) and the HMXB systems Cyg X-l (Bolton 1975), LMC X-3 (Cowley et al. 1983) and LMC X-l (Huchings et al. 1983).
Be star binary systems are neutron stars with lower mass (< 20 Af©) companions in less tight orbits with periods of weeks - years (e.g., Corbet 1986). The transient nature of the X-ray emission observed from Be stars
Neutron stars in binary orbit with low mass (< 2 M0 ) stars are classified
as LMXB. The companion stars are older and the space distribution is correspondingly different from the HMXB and Be systems, the latter being confined mainly to the galactic plane and the former to the galactic bulge.
The final class of accreting binary sources are Cataclysmic Variables (CV) in which a low mass (< 1 M0 ) red dwarf loses mass to an accreting white dwarf. The systems are tightly bound with orbital periods in the range hours - days. CVs are divided into two subgroups: magnetic and non-magnetic (white dwarf), with different accretion mechanisms operating in each case. In non-magnetic cases material falls onto an accretion disk whilst in magnetic CVs magnetic confinement of material at the polar caps of the white dwarf results in the emission of a hard thermal bremsstrahlung component (e.g., Livio and Shaviv 1983; Mason 1985).
Normal stars were generally not detected in the hard (2 — 10 keV) range of HEAO-1 unless they exhibited an exceptional amount of coronal activity. The RS Canum Venaticorum (RSCVn) binary systems contain late-type primary stars (G-K sub-dwarfs) which emit X-rays through enhanced coronal activity (Walter, Charles and Bowyer 1980; Walter and Bowyer 1981). Other related X-ray emitting objects include the W UMa and BY Dra binaries, FK Comae stars and dMe stars.
Supernova R em nants The X-ray emission from supernova remnants arises from thermal emission from very hot gas (T = 106 — 107 K). Imaging of SNR revealed that in most cases the X-ray morphology was closely related to the radio morphology, including the shell-like structure seen in the Kepler, Tycho and Cass A SNR (e.g., see Danziger and Gorenstein 1983). Abundance observations made at the X-ray wavelengths have placed constraints on the type and mass of the progenitor star (e.g.,
Canizares and Winkler 1981).
H ot Interstellar M edium The hot ISM was unknown before X-ray obser vations at soft (0.10 — 0.028 keV) energies (Marshall and Clarke 1984). In addition there is an isotropic, hard X-ray background — the origin of
10
TABLE 1
Galactic X -ray Sources
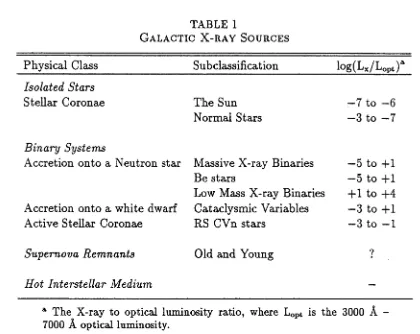
Physical Class Subclassification log(Lx/L opt)a
Isolated S ta rs
Stellar Coronae The Sun —7 to —6
Normal Stars —3 to —7
B in a r y S y ste m s
Accretion onto a Neutron star Massive X-ray Binaries —5 to +1
Be stars —5 to -(-1
Low Mass X-ray Binaries + 1 to +4 Accretion onto a white dwarf Cataclysmic Variables —3 to -(-1
Active Stellar Coronae RS CVn stars —3 to —1
S u p ern o va R e m n a n ts Old and Young ?
H o t In te rste lla r M ed iu m —
a The X-ray to optical luminosity ratio, where Lopt is the 3000 A -
7000 A optical luminosity.
In Table 1 we summarize the classification of galactic X-ray sources. In addition to the physical description of the source we list the ratio of the X-
ray to optical luminosity Lx/L opt, a distance independent measure of the X-ray efficiency. Lx is the 2 — 10 keV luminosity and Lopt is the optical luminosity
integrated between 3000
A
and 7000A.
1.5.2
T h e E x tra g a la ctic Sources
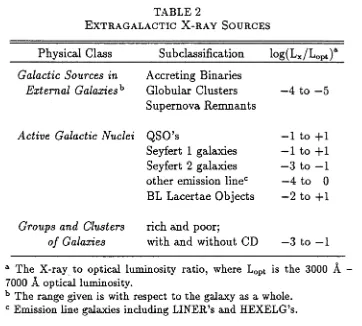
[image:28.554.76.496.119.453.2]TABLE 2
Extragalactic X -ray Sources
Physical Class Subclassification l o g ( W L opt)a
Galactic Sources in A ccreting Binaries
External Galaxies'0 G lobular C lusters —4 to —5 Supernova R em nants
Active Galactic Nuclei Q SO ’s — 1 to -(-1 Seyfert 1 galaxies — 1 to T l Seyfert 2 galaxies —3 to —1 o ther emission linec —4 to 0 BL Lacertae O bjects —2 to -pi
Groups and Clusters rich and poor;
of Galaxies w ith and w ithout CD —3 to —1
a The X-ray to optical luminosity ratio, where Lopt is the 3000 Ä - 7000 Ä optical luminosity.
b The range given is with respect to the galaxy as a whole. c Emission line galaxies including LINER’s and HEXELG’s.
T h e hot, ionized, diffuse in traclu ster gas associated w ith groups and clusters of galaxies is produced by th e therm al brem sstrahlung m echanism at energies E < 10 keV. T h e presence of th e gas was unknow n before X -ray observations (Form an and Jones 1982) and has resulted in th e discovery of cooling flows (Fabian, N ulsen and Canizares 1984).
[image:29.554.112.474.134.460.2]12
1 .6
R e fe r e n c e s
Beichman, C. A. 1987, Ann. Rev. Astron. Ap., 25, 521. Bennett, A. S. 1962, M. N. R. A. S., 125, 75.
Bertaux, J. L, Blamont, J. E., and Festou, M. C. 1973, Astron. Astrophys.,
25, 415.
Boldt, E. 1987, Phys Rept., 146, 215. Bolton, C. T. 1975, Ap. J., 200, 269.
Bradt, H. V., and McClintock, J. E. 1983, Ann. Rev. Astron. Ap., 21, 13.
Brissenden, R. J. V., Tuohy, I. R., Remillard, R. A., Buckley, D. A. H., Bick- nell, G. V., Bradt, H. V., and Schwartz, D. A. 1987, Proc. Astr. Soc. Aust.,
7, 212.
Brissenden, R. J. V., Tuohy, I. R., Remillard, R. A., Bradt, H. V., and Schwartz, D. A. 1989a, Ap. J., submitted (Paper III).
Brissenden, R. J. V., Remillard, R. A., Tuohy, I. R., Schwartz, D. A., and Hertz, P. L. 1990, Ap. J., to appear in the February 20 issue.
Brissenden, R. J. V., Tuohy, I. R., Bicknell, G. V., Remillard, R. A, and Schwartz, D. A. 1989c, IAU Symposium 134, Active Galactic Nuclei, D. E. Osterbrock and J. S. Miller (eds). p. 199.
Canizares, C. R., and Winkler, P. F. 1981, Ap. J. (Lett.), 246, L33.
Carleton, N. P., Elvis, M., Fabbiano, G., Willnew, S. P., Lawrence, A. and Ward, M. 1987, Ap. J., 318, 595.
Corbet, R. H. D. 1986, Evolution of Galactic X-ray Binaries, eds. J. Truem- per et al. (Dordrecht: Reidel), p. 63.
Cowley, A. P, Crampton, D., Huchings, J. B., Remillard, R. A., and Penfold, J. E. 1983, Ap. J., 272, 118.
Danziger, J., and Gorenstein, P. (eds.). 1983, Supernova Remnants and Their
X-ray Emission, (Dordrecht: Reidel).
Giacconi, R., Gursky, H., Paolini, F. R., and Rossi, B. B. 1962, Phys. Rev. Letters, 9, 439.
Huchings, J. B., Crampton, D., and Cowley, A. P. 1983, Ap. J. (Lett.), 275, L43.
Jordan, C., and Linsky, J. L. 1987, in Exploring the Universe with the IUE Satellite, ed. Kondo, Y., (Dordrecht: D. Reidel), p. 259.
Levine, A. M., et al. 1984, Ap. J. Suppl., 54, 581.
Livio, M., and Shaviv, G. (eds.). 1983, Cataclysmic Variables and Related
Objects, (Dordrecht: Reidel).
Malkan, M. A. 1983, Ap. J ., 268, 582.
Marshall, F. E., Boldt, E. A., Holt, S. S., Mushotzky, R. F., Pravdo, S. H., Rothschild, R. E., and Serlemitsos, P. J. 1979, Ap. J. Suppl., 40, 657.
Marshall, F. E., and Clarke, G. W. 1984, Ap. J ., 287, 633.
Mason, K. 0 . 1985, Space Sei. Rev., 40, 99.
McClintock, J. E., and Remillard, R. A. 1986, Ap. J., 308, 110.
Neugebauer, G., et al. 1984, Ap. J. (Lett.), 278, LI.
Nugent, J. J., et al. 1983, Ap. J. Suppl., 51, 1.
Piccinotti, G., Mushotzky, R. F., Boldt, E. A., Holt, S. S., Marshall, F. E., Serlemitsos, P. J., and Shafer, R. A. 1982, Ap. J., 253, 485.
Remillard, R. A. 1985, Ph.D. Thesis, Massachusetts Institute of Technology.
Remillard, R. A., Bradt, H. V., Buckley, D. A. H., Roberts, W., Schwartz, D. A., Tuohy, I. R., and Wood, K. 1986, Ap. J., 301, 742 (Paper I).
Remillard, R. A., Schwartz, D. A., and Brissenden, R. J. V. 1988, A Decade of UV Astronomy with IUE, Proc. Celebratory Symposium, GSFC, Greenbelt,
USA, 12-15 April 1988, ESA SP-281, Vol. 2 (June 1988), p. 273.
Remillard, R. A., et al. 1989a, Ap. J., submitted (Paper II).
Remillard, R. A., Tuohy, I. R., Brissenden, R. J. V., Buckley, D. A. H., Schwartz, D. A., Feigelson, E. D., and Tapia, S. 1989b, Ap. J., 345, 140.
Soifer, B. T., Houck, J. R., and Neugebauer, G. 1987, Ann. Rev. Astron. Ap.,
14
Unger, S. W., Lawrence, A., Wilson, A. S., Elvis, M. and Wright, A. E. 1987,
M. N. R. A. 5., 228, 521.
Vaiana, G. S., 1981, Ap. J., 245, 163.
Wall, J. V., Shimmins, A. J., and Merkelijn, J. K. 1971, Aust. J. Phys. Ap. Supply 19, 68.
Walter, F. M., Charles, P. A., and Bowyer, S. 1980, Ap. J. (Lett.), 225, LI 19.
Walter, F. M., and Bowyer, S. 1981, Ap. J., 245, 671.
2.
T h i r t e e n N e w X - r a y S e le c te d A G N
F r o m t h e H E A O -1 A ll-s k y S u r v e y
This chapter is a paper submitted to the Astrophysical Journal de scribing the identification of thirteen AGN as optical counterparts to previously unidentified HEAO-1 X-ray sources. All the AGN reported in the chapter are included in the sample studied in this thesis. We present the work here to demonstrate the mechanics of the identification process as a precursor to the multifrequency observations and analysis contained in Chapters 4-7.
2.1
A b s t r a c t
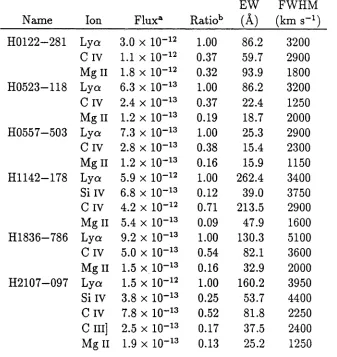
We report the discovery of thirteen new AGN detected by the Modulation Collimator experiment onboard the HEAO-1 satellite during its all-sky survey in 1977-78. The AGN (8 Seyfert 1 galaxies and 5 QSOs) have redshifts in the range 0.018 < z < 0.143 and V magnitudes 14.3 < V < 18.0. One of the Seyfert 1 galaxies lies within 3° of the galactic plane and is consequently highly reddened with V ~ 19. The AGN possess X-ray luminosities (2-10 keV) in the range 40.0 < log(Lx) < 43.5 erg s-1 and a mean optical to X-ray spectral index of ßox = 1.06 ± 0.16. A wide variety of emission line behaviour is exhibited by the AGN with the equivalent width and full-width at half maximum of \lß in the range 31 < EW < 185 Ä and 1400 < FWHM < 14600 km s-1 respectively. Emission line ratios for selected lines are presented. Radio observations indicate that only one of the AGN (a QSO) has substantial radio emission with a flux density of 70 ± 3 mJy at 8.4 GHz and an inverted spectrum with index a = —0.48 (/„ oc v~a). Four of the seven AGN observed with the VLA were detected.
16
2.2
I n tr o d u c ti o n
The Large Area Sky Survey (LASS) instrument carried by the first High Energy
Astronomy Observatory (HEAO-1) detected 842 X-ray sources above a flux
limit of 0.22 /iJy at 5.2 keV (5.2 x 10⁻¹² ergcm _2s_1 in the 2 — 10 keV energy band assuming a Crab-like spectrum; Wood et al. 1984). The LASS detections constitute the most sensitive all-sky X-ray survey available and identifying the optical counterparts of these sources is thus of great importance. However, many of the fainter (< 10 //Jy) sources remain unidentified because of the poor constraints placed on their celestial positions by the LASS and other HEAO-1 instruments. We use data from the Modulation Collimator (MC) experiment (Gursky et al. 1978), LASS and other X-ray telescopes when available (e.g.
Einstein, EXOSAT) to reduce the search area for optical counterparts, and
apply UV-excess techniques to select candidate optical counterparts.
X-ray surveys have proved a rich source for Active Galactic Nuclei (AGN: Seyfert 1 galaxies, QSOs and BL Lacertae objects) with many hun dreds being identified with sources detected serendipitously by the Einstein
Observatory (Medium Sensitivity Survey - MSS, Maccacaro et al. 1982; Ex
tended MSS - EMSS; Gioia et al. 1988) and EXOSAT (Giommi et al. 1988). However, these surveys covered only a small portion of the sky (3% for the EMSS), were carried out at low energy (0.3 — 3.5 keV for MSS and EMSS, 0.05 — 2 keV for EXOSAT) and due to their greater sensitivity, led to the iden tification of faint AGN. The HEAO-1 sources were detected in the 2 — 10 keV band and suffer virtually no extinction at high (|6| > 20°) galactic latitude. They have typically 10 — 100 times the X-ray flux of Einstein sources and have correspondingly higher fluxes at other wavelengths, making them amongst the
brightest examples of their class and more amenable to detailed study.
In this, the third paper reporting the discovery of new AGN from the program, we present basic observational parameters of 8 Seyfert 1 (Sy 1) galaxies and 5 QSOs, bringing the total to 35 new AGN (Remillard et al. 1986, hereafter Paper I; Remillard et al. 1989a, hereafter Paper II). The discovery of five BL Lacertae objects has been reported separately (Remillard et al. 1989b, Brissenden et al. 1990). The results of a multiband study of the 35 AGN will be presented by Brissenden (1989). In addition to X-ray diagrams, optical spectra, selected line ratios and some optical and infrared photometry, we present radio measurements of the AGN and make comparisons with the work of Unger et al. Two of the AGN (H0419—477 and H2044—032) have been reported previously by Brissenden et al. (1987) but without optical spectra or X-ray data. Throughout the paper1 we assume Ho = 50 km s-1 Mpc-1 and
qo = 0.
2.3
X -ray P o sitio n s and Id en tifica tio n s
The MC experiment (Gursky et al. 1978; Schwartz et al. 1978) was described in some detail in Chapter 1 (§1.3). Briefly, the instrument consisted of two banks of proportional counters (MCI and MC2) each covered by grids of parallel wires rotated 20° relative to each other, one set more finely spaced than the other. As the instrument scanned over the source, the wires modulated the detected X-ray signal producing a set of allowed positions (MCI and MC2 bands), the intersection of which resulted in a set of small (< 1' x 4') parallelograms or error “diamonds”. The positional constraint of the diamonds was at the 90% confidence level and the X-ray source was expected to lie within one of them. The MC was sensitive to photons in the energy range 1 — 13 keV and counts
were sorted into three energy channels.
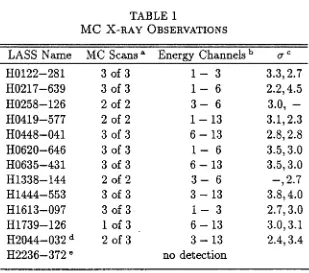
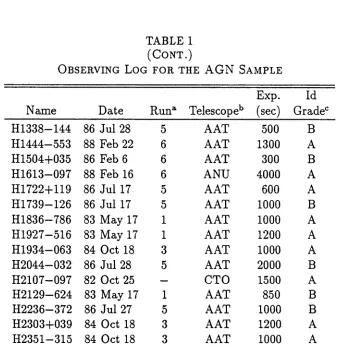
In Table 1 we present the results of the analysis of the MC data for
the AGN. The LASS name is given together with the number of celestial scans that contributed to the detections (MC scans), the energy channels common to the detections of both collimators and the source strength expressed as the
18
number of standard deviations (<r) above the background level for both MCI and MC2.
The MC diamonds combined with the results of other X-ray ex periments, principally the HEAO LASS (Wood et al. 1984), served to reduce the search area for each object to typically 0.05 degrees2. The probability of discovering bright members of common X-ray classes by chance in such an area is slight, and we discount the possibility of spurious identifications as remote.
2.4
O p tic a l I d e n tif ic a tio n a n d O b s e rv a tio n s
2.4.1
C a n d id a te S electio n
A detailed discussion of the candidate selection technique is given in Paper I which we summarize here.
A number of UV-excess objects were selected from each X-ray field based on their positions relative to the MC multiple diamonds and the posi tional constraints of other experiments, principally HEAO LASS. A U- and 13- double exposed Schmidt plate centered on each LASS error box was overlayed with the MC diamond pattern and scanned to search for UV excess objects lying within or very close to diamonds. In general between 3 and 5 candidate objects were selected in this manner in preparation for spectroscopic observa tions. H1444—553 was an exception to this procedure, having been noticed as an optically extended object within an MC diamond for a source at low galactic latitude.
2.4.2
S p e ctr o sc o p ic O b servation
LASS Name MC Scans a Energy Channels b crc
H0122—281 3 of 3 1 - 3 3.3,2.7
H0217—639 3 of 3 1 - 6 2.2,4.5
H0258—126 2 of 2 3 - 6 3.0,
-H0419—577 2 of 2 1 - 13 3.1,2.3
H0448—041 3 of 3 6 - 1 3 2.8,2.8
H0620—646 3 of 3 1 - 6 3.5,3.0
H0635—431 3 of 3 6 - 1 3 3.5,3.0
H1338—144 2 of 2 3 - 6 - , 2 . 7
H1444—553 3 of 3 3 - 1 3 3.8,4.0
H1613—097 3 of 3 1 - 3 2.7,3.0
H1739—126 1 of 3 6 - 1 3 3.0,3.1
H2044—032 d 2 of 3 3 - 1 3 2.4,3.4
H2236—3 7 2 e no detection
a The number of celestial scans th at contributed to the Mod ulation Collimator detections.
b The energy channels common to both collimator’s detec tions (keV).
c The apparent strength of the source detected by MCI and MC2, expressed as the number of standard deviations above the background noise level.
[image:37.554.139.448.172.445.2]20
and Faint Object Red Spectrograph (FORS) with resolutions of 3
Ä
and20 A
FWHM respectively. A dichroic mirror placed in the beam path split the beam at approximately 5500A
allowing simultaneous blue (3400A
- 5500A)
and red (5500A
- 10000A)
spectral coverage.The newly commissioned Double Beam Spectrograph (DBS) was used with the ANU 2.3 m telescope to obtain spectra (3600
A
- 8000A)
with 3A
FWHM resolution. A dichroic mirror split the beam at 5500A
sending light into red and blue arms, through separate gratings and onto red and blue detectors. Each detector consisted of two intensified CCDs separated by ~ 5 pixels which introduced two small gaps in the spectrum at 4800A
and 7200A.
The observing procedure for both telescopes was standard. Ex posures of comparison arcs were used for wavelength calibration, several flux standards (Stone 1977, Oke 1974) were observed each night to allow correc tion for instrumental response and observations of smooth spectrum standards were used to remove telluric absorption bands in the red spectra.
The spectral and X-ray data were considered together for each po tential optical counterpart and a grade assigned to reflect the certainty of the identification. An ‘A’ grade indicates very high probability and a ‘B’ indicates high probability.
2.4.3
P h o to m e tr y
Infrared (JHK) photometric observations were made of eight of the AGN dur
ing two runs (1987 May and 1987 October) with the Infrared Photometer System (IRPS) on the ANU 2.3 m telescope operated in a chopping mode. Standard stars were observed (McGregor 1988) and standard reduction tech niques used to obtain colours on the MSO system (Jones and Hyland 1982, Elias et al. 1983). All the observations were made through a 10 arcsecond aperture under dark conditions and with seeing of less than 3 arcseconds.
observed and used in a standard reduction to obtain colours and magnitudes. The infrared and optical photometry are included in the individual notes on each object in section IV.
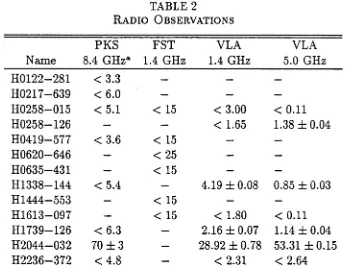
2 .4 .4 R a d io O b s e r v a tio n s
As a standard part of the follow-up observations, all AGN are checked for radio emission. We have used the Very Large Array2 (VLA), the Parkes 64 m radio telescope and the Fleurs Synthesis Telescope3 (FST; Jones et al. 1984, Bunton et al. 1985) to search for continuum emission. In general, each object was observed with either Parkes (8.4 GHz) or the FST (1415 MHz) and if possible the VLA (1465 MHz and 4885 MHz). The FST 1465 MHz and VLA 1465 MHz measurements are taken to be the same continuum point in the following discussion and are both referred to as 1.4 GHz data.
VLA observations were made at both 1.4 and 4.9 GHz with the C-array in the ‘snapshot’ mode during 1988 May. The typical synthesized
r
beam sizes were 12" x 23" and 4" x 7" respectively with a mean background rms noise of 0.65 and 0.18 mJy for integration times of ~ 10 minutes at both frequencies. The map reduction was made using AIPS4 at the VLA. FST observations were made at 1.4 GHz during 1987 February - 1988 March with a synthesized beam size of 20" x 30" and integration times of ~ 6 — 8 hours with the full 6 dish array. Maps were reduced using the FCP reduction program at the Electrical Engineering Department of the University of Sydney. Radio flux density measurements at 8.4 GHz were made at Parkes during 1987 March and 1988 March, using a dual “Noddy” feed with half power beam width 2.7 arcminutes and typical integration times of 5 minutes.
The same procedure was used for both the VLA and FST obser vations to determine if a source was detected. Each map was examined for emission at the position of the optical counterpart. A detection was defined
2The VLA is maintained by the National Radio Astronomy Observatory which is operated by Associated Universities, Inc., under contract with the National Science Foundation.
3Operated until mid-1988 by the Electrical Engineering Department of the University of Sydney with Australian Research Council Funding.
22
TABLE 2
Radio Observations
Nam e
PK S 8.4 GHza
FST 1.4 GHz
VLA 1.4 GHz
VLA 5.0 GHz
H0122—281 < 3.3 — — —
H0217—639 < 6.0 — — —
H0258—015 < 5.1 < 15 < 3.00 < 0.11
H0258—126 — — < 1.65 1.38 ± 0 .0 4
H0419—577 < 3.6 < 15 — —
H0620—646 — < 25 — —
H 0635-431 — < 15 — —
H1338—144 < 5.4 — 4.19 ± 0 .0 8 0.85 ± 0.03
H1444—553 — < 15 — —
H1613—097 — < 15 < 1.80 < 0.11
H1739—126 < 6.3 — 2.16 ± 0 .0 7 1.14 ± 0 .0 4
H2044—032 70 ± 3 — 28.92 ± 0.78 53.31 ± 0 .1 5
H2236—372 < 4.8 — < 2.31 < 2.64
a All units are mJy, the errors quoted are ±1 a and upper limits are 3 cr. A dash indicates no observation.
as being emission g reater th a n 3 cr above th e rms noise in the background at a position coincident w ith th e optical position and w ithin th e uncertainties of b o th m easurem ents. W here no source was detected a 3 <r upper limit was tak en as th ree tim es the background rms. All sources th a t were detected were unresolved. For Parkes observations, emission g reater th a n 3 a above the rm s noise of a series of rep eated integrations was considered a detection; otherw ise 3 cr u p p er lim its were calculated.
[image:40.554.118.472.138.410.2]2 .5
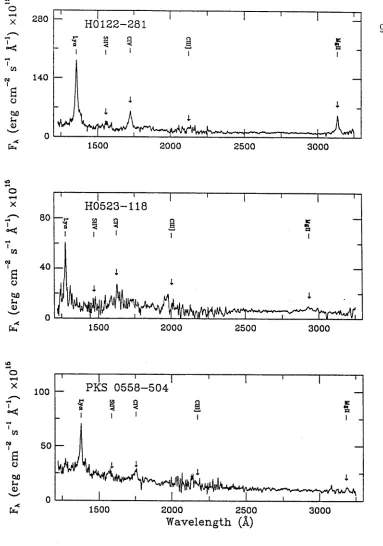
R e s u l t s
In Figure 1 we show the X-ray error constraints on the sky for the majority of AGN presented here. The maps for H0122—281, H2044—032 and H2236—372 are omitted and additional maps for the fields H0448—041, H0828—706 and H1032—142 (not considered here) are included. The maps show the intersec tion of two sets of positional bands from the HEAO-A3 experiment (multiple diamonds), the error boxes of HEAO-1 LASS ( “U P ), UHURU (“4U” ; Forman
et ai 1978) and EXOS AT (“GPS” ). The position of th6 AGN in each map is
marked with a cross.
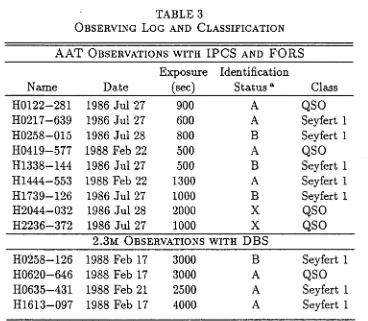
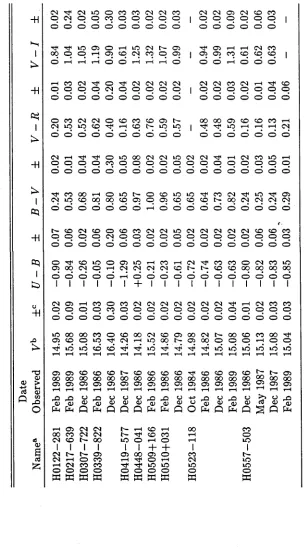
Table 3 lists the names, observing dates, exposure times, identifi cation gradings and classifications for the 13 AGN, 9 observed with the AAT and 4 with the ANU 2.3 m telescope. The celestial positions (accuracy ~ 1"), redshift, V magnitude, absolute V magnitude, X-ray luminosity, optical-X- ray and radio-optical spectral indices for each object are tabulated in Table 4. The celestial coordinates of H1338—144, H1739—126 and H2044—032 are VLA positions and have correspondingly higher accuracy (~ 0.5").
In Paper I we made the distinction between Seyfert 1 galaxies and QSOs based on the presence of an extended image on a photographic plate. Several of the AGN presented here have properties that make classification based on this scheme inappropriate. The division between the two “classes” is arbitrary since the characteristics of Seyfert 1 galaxies are so similar to those of QSOs, and they may be simply considered as low luminosity examples of the latter. We choose to define a QSO as has having an absolute V magnitude brighter than —22.5 and redshift greater than 0.1, but stress that these criteria
are arbitrary.
For the AGN without optical photometry, the V magnitudes in Ta ble 4 are calculated by convolving the spectrum with the standard filter. We estimate an uncertainty of ±0.3 magnitude which is therefore the uncertainty in the absolute magnitude, Mv. The X-ray luminosity and optical-X-ray spec
tral index (ßox) are calculated as in Paper I. The radio-optical spectral index
(ßro) connects the radio continuum at 1.4 GHz to the optical continuum at
D
e
c
.(
d
e
g
)
D
e
c
.(
d
e
g
)
D
e
c
.(
d
e
g
)
Fig. 1.— X-ray Maps for the AGN
Each map shows the X-ray detections for the field and the AGN marked with a cross. The X-ray data are from HEAO-1 A1 (“1H”), HEAO-1 A3 (multiple diamonds), Uhuru
D
e
c
.(
d
e
g
)
D
e
c
.(
d
e
g
)
D
e
c
.( \
159.5 158.5 157.5
222.5 222 221.5 221 220.5
- 1 0
- 10.5
R.A.(deg) R.A.(deg)
26
TABLE 3
Observing Log and Classification
A A T Observations with IP C S and F O R S
N am e D ate
Exposure (sec)
Identification
S tatu s a Class
H0122—281 1986 Ju l 27 900 A QSO
H0217—639 1986 Ju l 27 600 A Seyfert 1
H0258—015 1986 Ju l 28 800 B Seyfert 1
H0419—577 1988 Feb 22 500 A QSO
H 13 3 8 -1 4 4 1986 Ju l 27 500 B Seyfert 1
H1444—553 1988 Feb 22 1300 A Seyfert 1
H1739—126 1986 Ju l 27 1000 B Seyfert 1
H2044—032 1986 Ju l 28 2000 X QSO
H2236—372 1986 Ju l 27 1000 X QSO
2 . 3m Observations with D B S
H0258—126 1988 Feb 17 3000 B Seyfert 1
H0620—646 1988 Feb 17 3000 A QSO
H0635—431 1988 Feb 21 2500 A Seyfert 1
H1613—097 1988 Feb 17 4000 A Seyfert 1
[image:44.554.112.480.234.555.2]