This is a repository copy of
The strain energy density to estimate lifetime of notched
components subjected to variable amplitude fatigue loading
.
White Rose Research Online URL for this paper:
http://eprints.whiterose.ac.uk/142316/
Version: Published Version
Article:
Hu, Z., Berto, F. and Susmel, L. orcid.org/0000-0001-7753-9176 (2019) The strain energy
density to estimate lifetime of notched components subjected to variable amplitude fatigue
loading. Frattura ed Integrità Strutturale, 13 (47). pp. 383-393. ISSN 1971-8993
https://doi.org/10.3221/IGF-ESIS.47.28
[email protected] https://eprints.whiterose.ac.uk/ Reuse
This article is distributed under the terms of the Creative Commons Attribution (CC BY) licence. This licence allows you to distribute, remix, tweak, and build upon the work, even commercially, as long as you credit the authors for the original work. More information and the full terms of the licence here:
https://creativecommons.org/licenses/
Takedown
If you consider content in White Rose Research Online to be in breach of UK law, please notify us by
Z. Hu et alii, Frattura ed Integrità Strutturale, 47 (2019) 383-393; DOI: 10.3221/IGF-ESIS.47.28
383
The Strain energy density to estimate lifetime of notched
components subjected to variable amplitude fatigue loading
Zheng Hu
Science and Technology on Vehicle Transmission Laboratory, China North Vehicle Research Institute, Beijing, China, 100072 [email protected]
Filippo Berto
Norwegian University of Science and Technology, NO-7491 Trondheim, Norway [email protected], http://orcid.org/0000-0001-9676-9970
Luca Susmel
Department of Civil and Structural Engineering, the University of Sheffield, Sheffield S1 3JD, UK [email protected], https://orcid.org/0000-0001-7753-9176
ABSTRACT. In the present paper, the approach based on the strain energy density (SED) averaged over a structural volume is reformulated to estimate the lifetime of notched components subjected to variable amplitude (VA) uniaxial fatigue loading. The accuracy and reliability of the proposed reformulation of the SED approach was checked against a large number of data taken from the literature and generated, under two different load spectra, by testing specimens of carbon steel C40 containing notches of different sharpness. Such a validation exercise allowed us to demonstrate that the extension of the SED approach as proposed in the present paper is capable of accurately estimating fatigue damage in notched components subjected to in-service VA fatigue loading.
KEYWORDS. Strain energy density; Notch; Variable amplitude loading.
Citation: Hu Z, Berto F, Susmel L, The Strain energy density to estimate lifetime of notched components subjected to variable amplitude fatigue loading, Frattura ed Integrità Strutturale, 47 (2019) 383-393.
Received: 15.11.2018
Accepted: 04.12.2018
Published: 01.01.2019
Copyright: © 2019 This is an open access article under the terms of the CC-BY 4.0, which permits unrestricted use, distribution, and reproduction in any medium, provided the original author and source are credited.
INTRODUCTION
ost components contain material defects or geometric discontinuities. Examination of the state of the art demonstrate that the effect of stress concentrators on the fatigue strength of engineering materials has been investigated by considering mainly constant amplitude (CA) fatigue situations. However, most components experience variable amplitude (VA) fatigue load histories which make the characteristics of the critical local stress/strain states more complex, with this affecting markedly fatigue strength.
Z. Hu et alii, Frattura ed Integrità Strutturale, 47 (2019) 383-393; DOI: 10.3221/IGF-ESIS.47.28
384
In order to predict in-service lifetime of notched components under VA loading, it is important to make use of specific methods suitable for taking into account the way fatigue damage accumulates itself. Palmgren [1] and Miner [2] first formulated this concept in a mathematical form as:
f ,
( i / i)
D n N (1)
where D denotes the cumulative damage sum, and ni and Nf,i are the applied cycles and the total number of cycles to
failure under the ith constant amplitude stress level, respectively. When engineering metallic materials are damaged by VA load histories, failure is supposed to occur as soon as the critical value of cumulative damage sum Dcr is equal to unity.
However, experimental evidence under VA loading condition indicates that in situations of practical interest Dcr varies in
the range 0.02-5 [3, 4]. Clearly, this fact can produce a remarkable discrepancy between estimated and actual lifetime, with this calculation resulting in non-conservative predictions.
(a)
[image:3.595.171.440.247.656.2](b)
Figure 1: (a) Geometries of the tested notched samples (dimensions in millimetres). (b) Fatigue results generated under CA uniaxial fatigue loading [3].
Z. Hu et alii, Frattura ed Integrità Strutturale, 47 (2019) 383-393; DOI: 10.3221/IGF-ESIS.47.28
385
is based both on a precise definition of the control volume and on the fact that the critical energy does not depend on the notch sharpness. The control radius R0 of the volume is a material property, which involves the plain specimen’s fatigue
limit and the threshold stress intensity factor range [10]. The approach was successfully used under both static and CA fatigue loading conditions to assess the strength of notched components subjected to uniaxial [12-14] as well as to multiaxial loading [15-19].
Even if a lot of theoretical and experimental work has been carried out to check the accuracy and reliability of the SED approach, surprisingly, so far no systematic attempt has been made to extend the use of this powerful method to those situations involving VA fatigue loading. Accordingly, the ultimate goal of the research work summarized in the present paper was to reformulate the SED approach to make it suitable for assessing fatigue lifetime of notched components subjected to VA uniaxial fatigue load histories, with this being done by using a suitable cycle counting method (i.e., the Rain-Flow method [20]) as well as a suitable cumulative damage model (i.e., Palmgren and Miner’s rule [1, 2]).
EXPERIMENT DETAILS
n a recent work, Susmel and Taylor [3] tested under uniaxial VA fatigue loading circumferentially notched specimens made of a medium-carbon steel C40 and containing three different geometrical features. The geometry of the tested specimens is reported in Fig. 1a along with details of the notches that were characterized by three different values of the notch tip radius and opening angle. Static tensile tests were performed in order to evaluate the mechanical properties according to the ASTM standard procedure. The yield stress, tensile stress and Young’s modulus of the investigated materials were 672 MPa, 852 MPa and 209000 MPa, respectively. The net stress concentration factor, Kt, was calculated by
solving standard linear-elastic Finite Element (FE) models where the mesh density in the notch region was gradually increased until convergence occurred. This standard numerical procedure returned a Kt value under tension equal to 4.42,
2.2 and 1.66 for the specimens with a root radius of 0.225, 1.2 and 3 mm, respectively.
Both CA and VA fatigue tests were carried out in axial load control under a nominal load ratio, R= min/ max, equal to -1 at
a frequency of 4 Hz. All the CA fatigue results are summarised in the Wöhler diagrams of Fig. 1b in terms of nominal stress amplitude evaluated onto the net cross-sectional area of the specimens. Fig. 1b shows the fatigue data generated by testing both the un-notched specimens and the V-notched samples with root radius equal to 0.225 mm (Kt = 4.42). The
statistical analyses have been performed assuming a log-normal distribution of the number of cycles to failure for each stress amplitude. All data obtained from specimens characterized by a fatigue life between 104 and 2106 have been taken
into account in the statistical analyses. It is worth observing here that the scatter bands plotted in the chart of Fig. 1b were calculated for each stress level by assuming a confidence level equal to 95%. The results from the statistical re-analysis are summarised in Tab. 1 in terms of: nominal stress amplitudes( A for the plain specimens and An for the notched samples)
for a probability of survival PS =50% at a reference number of cycles to failure, NA, equal to 106; inverse slope, k, of the
Wöhler curves and the scatter index T that provides the width of the scatter band between the curves with a probability of survival of 10% and 90% respectively (with a confidence level equal to 95%).
Specimen Type rn(mm) dg(mm) dn(mm) (°) k A, An*(MPa) T Kt
Plain - 12 6 - 9.4 292.8 1.211 1.0
Sharp 0.225 12 9.15 35 4.2 97.8 1.361 4.42
Table 1:Summary of the experimental results generated under fully-reversed CA loading [3].
As to the performed VA tests, the specimens were tested under the two different random spectra (Fig. 2) having sequence length, ntot = ni, equal to 1000 cycles. All the random spectra were repeated until failure of the specimens occurred. In
particular, the Concave Upwards Spectrum (CUS) was derived from a conventional Rayleigh distribution, whereas the Concave Downwards Spectrum (CDS) was defined so that we could have few cycles with high stress ranges combined with a relatively large number of cycles with low stress ranges [21]. The aim of two different spectra of tests was to determine the effect of spectrum shape on the fatigue lifetime of the notched material being investigated and to determinate the fatigue lifetime under random block loading.
All the results generated by Susmel and Taylor [3] are summarized in Tabs. 2-4, where the performed tests are described in terms of adopted spectrum, maximum force, Fa,max, maximum amplitude in the spectrum of the axial, a,max, load ratio, R,
and experimental value of the number of cycles to failure, Nf. For comparison, Tab. 5 shows the fatigue results generated
by testing plain samples under the two load spectra. Tab. 5 also reports the corresponding experimental values of the critical damage sum, Dcr,exp, calculated by using experimental CA plain Wöhler curve.
Z. Hu et alii, Frattura ed Integrità Strutturale, 47 (2019) 383-393; DOI: 10.3221/IGF-ESIS.47.28
386
[image:5.595.53.545.69.485.2](a) (b)
Figure 2: Adopted load spectra (a) CUS and (b) CDS [3].
Code Spectrum Fa,max(kN) a,max(MPa) R Nf(Cycles)
[image:5.595.162.426.276.481.2]S2_VA CUS 34.2 520.1 -1 20975 S3_VA CUS 34.2 520.1 -1 21568 S4_VA CUS 18.4 279.8 -1 170155 S6_VA CUS 18.4 279.8 -1 182155 S7_VA CUS 25.6 389.3 -1 66703 S9_VA CUS 25.6 389.3 -1 61594 S10_VA CDS 65.8 1000.7 -1 8620 S12_VA CDS 49.3 749.7 -1 45620 S13_VA CUS 14.4 219.0 -1 391420 S14_VA CDS 65.8 1000.7 -1 7620 S15_VA CDS 49.3 749.7 -1 42620 S16_VA CDS 35.4 538.4 -1 179620 S17_VA CUS 14.4 219.0 -1 339763 S19_VA CDS 28.4 431.9 -1 367620 S20_VA CDS 35.4 538.4 -1 172620 S21_VA CDS 28.4 431.9 -1 376620
Table 2: Summary of the experimental results generated by testing the notched specimens with root radius equal to 0.225 mm under VA fatigue loading [3].
Code Spectrum Fa,max(kN) a,max(MPa) R Nf(Cycles)
I1_VA CUS 35.5 520.4 -1 37568 I2_VA CUS 29.5 432.4 -1 84463 I3_VA CUS 23.5 344.5 -1 170581 I4_VA CUS 35.5 520.4 -1 34044 I5_VA CUS 29.5 432.4 -1 83663 I6_VA CUS 23.5 344.5 -1 253927 I7_VA CDS 65.4 958.6 -1 10620 I8_VA CDS 48.5 710.9 -1 78620 I9_VA CDS 65.4 958.6 -1 11905 I10_VA CUS 20.5 300.5 -1 715859 I11_VA CDS 31.0 454.4 -1 732620 I12_VA CDS 31.0 454.4 -1 531620 I13_VA CDS 37.0 542.4 -1 285277 I14_VA CUS 20.5 300.5 -1 588009 I15_VA CDS 48.5 710.9 -1 76620 I16_VA CDS 37.0 542.4 -1 330620
[image:5.595.159.433.516.722.2]Z. Hu et alii, Frattura ed Integrità Strutturale, 47 (2019) 383-393; DOI: 10.3221/IGF-ESIS.47.28
387
Code Spectrum Fa,max(kN) a,max(MPa) R Nf(Cycles)
B1_VA CUS 42.0 631.8 -1 18736 B2_VA CUS 42.0 631.8 -1 15715 B3_VA CUS 33.0 496.4 -1 65733
B4_VA CUS 24.0 361.0 -1 274715
[image:6.595.119.539.86.299.2]B5_VA CUS 27.5 413.7 -1 118044 B6_VA CUS 24.0 361.0 -1 300763 B7_VA CUS 33.0 496.4 -1 63450 B8_VA CUS 27.5 413.7 -1 138975 B9_VA CDS 65.0 977.8 -1 13620 B10_VA CDS 49.0 737.1 -1 85397 B11_VA CDS 39.0 586.7 -1 352620 B12_VA CDS 39.0 586.7 -1 300216 B13_VA CDS 65.0 977.8 -1 12620 B14_VA CDS 33.5 503.9 -1 665620 B15_VA CDS 33.5 503.9 -1 749620 B16_VA CDS 49.0 737.1 -1 78392
Table 4: Summary of the experimental results generated by testing the notched specimens with root radius equal to 3 mm under VA fatigue loading [3].
Spectrum a-max(MPa) R Nf(Cycles) Dexp
CUS 728.6 -1 14763 0.59 CUS 728.6 -1 13525 0.54 CUS 594.2 -1 49450 0.29 CUS 512.8 -1 264594 0.38 CUS 512.8 -1 219086 0.32 CDS 891.3 -1 32620 1.31 CDS 735.6 -1 136620 0.91 CDS 618.9 -1 356620 0.47 CDS 891.3 -1 23620 0.95 CDS 618.9 -1 380085 0.50 Average Value= 0.63
Table 5: Summary of the experimental results generated by testing the plain samples under fully-reversed VA loading and experimental values of the critical damage sum, Dcr [3].
THE SED TO ESTIMATE LIFETIME OF NOTCHED COMPONENTS UNDER CA FATIGUE LOADING
n recent years, the strain energy density (SED) has been widely used to estimate the fatigue lifetime of notched components subjected to CA fatigue loading [10, 12, 13, 22, 23].
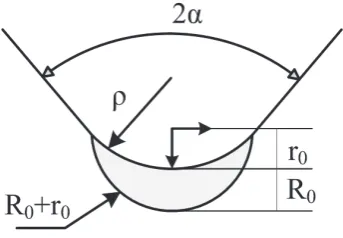
The averaged SED approach states that failure occurs when the mean value of the strain energy density averaged over a control volume surrounding the notch tip is equal to a critical energy value. For rounded V-notches, the control volume is as depicted in Fig. 3, where its radius R0 does not depend on the notch geometry. In more detail, R0 is the depth
of the crescent shape as measured along the notch bisector line. The outer radius of the control volume equals R0+r0,
where r0 is defined as a function of both the notch opening angle 2 and the notch root radius , according to the
following relationship:
0
2 2 2
r
(2)
Dealing with the fatigue assessment of notched components, the control radius, R0, can be defined by imposing the
equality, with reference to the fatigue limit condition [24], between the averaged SED relevant to the plain specimens and that obtained from V-notched specimens with known geometry, i.e.:
Z. Hu et alii, Frattura ed Integrità Strutturale, 47 (2019) 383-393; DOI: 10.3221/IGF-ESIS.47.28 388 2 A,p notch 0 plain
0 ( )
2 W
W R
E
(3)
whereA,pis the fatigue strength of the plain sample at NA cycles and E is the elastic modulus. By varying the control
radius R0 around the notch tip in an FE model under the nominal stress A,n, the corresponding values of strain energy
density Wnotch averaged over the control volume can be determined. Then the numerical valueWnotch(R0)as a
function of the control radius R0 is generated by a fitting equation. Finally, the control radius R0 of the critical volume can
[image:7.595.234.406.246.365.2]be calculated since it is equal to the strain density energy of the plain sample, W0plain. Due to the absence of experiment data related to stress intensity factor, the control radius can be easily evaluated by the procedure above.
Figure 3: Definition of the control volume for specimens weakened by rounded V-notch.
The averaged SED can also easily and quickly be calculated from FE analyses by summing the energy contributions
Welement,i for all the finite elements within the control volume V, i.e.:
element , V i w W W c V (4)
Eq. (4) defines the so-called direct approach to evaluate the SED parameter. In order to consider the influence of the nominal load ratio R, the weighting parameter cw has to be adopted by using the following expressions [25, 26]:
2
2
2
2
1
for - 0
(1 )
( ) 1 for 0
1
for 0 1
(1 )
w
R
R R
c R R
R R R (5)
Additionally, it is important to know that refined mesh in the control volume around the notch tip is not necessary to determine the value of the SED, because this parameter can be determined via the nodal displacements, without involving their derivatives. This means that the adopted FE meshes can be very coarse inside the control volume having radius R0
when accurately evaluating the value of the local SED [27].
Z. Hu et alii, Frattura ed Integrità Strutturale, 47 (2019) 383-393; DOI: 10.3221/IGF-ESIS.47.28
389
be obtained from the post-processing results by applying the value of nominal stress in the FE models. The relationship of the SED, W , and the fatigue life, Nf, can be written as:
f
B
W A N
(6)
where A and B are material constants. Keeping constant the material and the nominal load ratio, the fatigue life can be assessed by using Eq. (6) for any geometrical configuration of the notch.
THE SED TO ESTIMATE LIFETIME OF NOTCHED COMPONENTS UNDER VA FATIGUE LOADING
n the presence of VA load histories, the value of the SED will change as the amplitudes of the applied load spectrum vary. This clearly implies that, to correctly extend the use of the SED to those situations involving VA loadings, the procedure of the SED has to be redefined coherently according to the specific features of the assessed load spectrum.
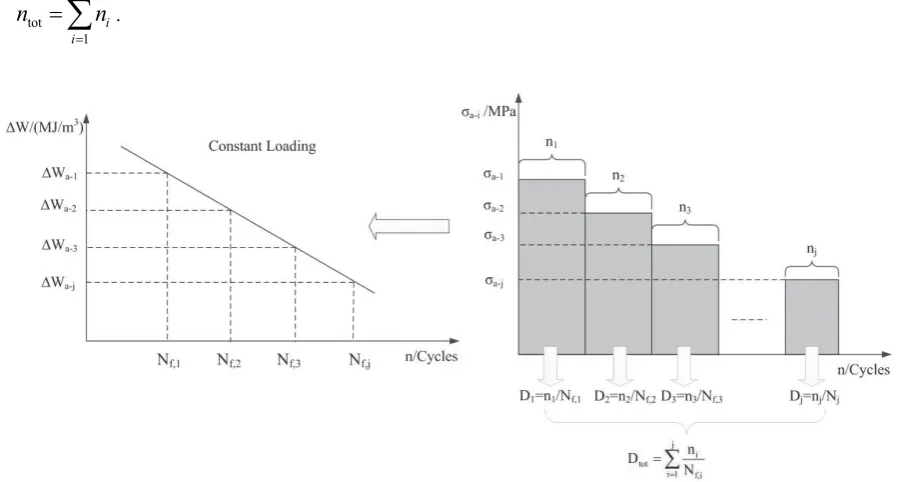
When the notched sample is subjected to the VA fatigue loading, the VA load spectrum can be counted by the Rain-Flow method [20]. Such a spectrum is formed by j different stress levels that are characterized by a nominal stress amplitude equal to
a-ias shown in Fig. 4. The corresponding number of cycles is equal to ni(i=1,2,…,j), where:tot 1
j i i
n n
[image:8.595.70.520.351.592.2]
.Figure 4: Estimation of the fatigue lifetime under VA loading by SED.
The different stress levels forming the above load spectrum can be treated as an independent CA loading, which can be applied in the FE model to obtain the value of the SED. Then, the corresponding number of cycles to failure Nf,i can
directly be determined according to the relation of SED versus the fatigue life Nf obtained by Eq. (6). As formalized
by Palmgren and Miner [1,2], the fatigue damage content associated with any stress level can be calculated as follows:
f,
i i
i n D
N
(7)
The resulting total damage is equal to:
W
Z. Hu et alii, Frattura ed Integrità Strutturale, 47 (2019) 383-393; DOI: 10.3221/IGF-ESIS.47.28
390
j
tot
i 1 f,
i
i n D
N
(8)Finally, the number of cycles to failure,Nf,e, can be estimated from the predicted number of blocks to failure, Nb,e, i.e.:
cr
b,e f,e tot b,e
tot
D
N N n N
D
(9)
where Dcris the critical value of the damage sum.
VALIDATION BY EXPERIMENTAL DATA
he data used to validate the proposed extension of the SED approach are those generated by Susmel and Taylor by testing the notched samples of C40 under both the Concave upwards Spectrum (CUS) and Concave Downwards Spectrum (CDS) [3]. As to the strain energy density analysis, the cylindrical samples were modelled by using axisymmetric bi-dimensional model with coarse meshes inside the volume.
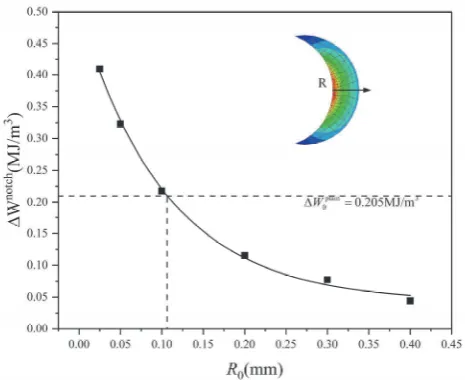
By applying the net nominal stress An at 106 cycles to the FE model, the numerical values ofWnotchas a function of the
critical radius R0 were obtained as shown in Fig. 5. It is observed that the value of the critical radius R0 is about 0.11 mm
[image:9.595.179.412.386.576.2]when the value of the SED for the V-notched specimen equals to that of plain specimen, W0plain.
Figure 5: Numerical values ofWnotchas a function of the critical radius R0.
The value of the SED averaged over the control volume was also calculated numerically by using the FE method. As shown in Fig. 4, a set of stress levels are acquired after calculating the load spectrum by Rain-Flow method. Then, the values of the SED of notched specimens with the sharpest radius are evaluated by applied above stress levels in the FE
model. According to Eq. (6), the relationship of the SED
W
versus fatigue life Nf under CA fatigue loading is-0.5266 f
=242.4
W N (10)
where the constants in Eq. (10) are determined by a best fit to a series of calculated data.
As to the critical value of the damage sum, Dcr, initially the hypothesis was formed that it could be taken equal to its
Z. Hu et alii, Frattura ed Integrità Strutturale, 47 (2019) 383-393; DOI: 10.3221/IGF-ESIS.47.28
391
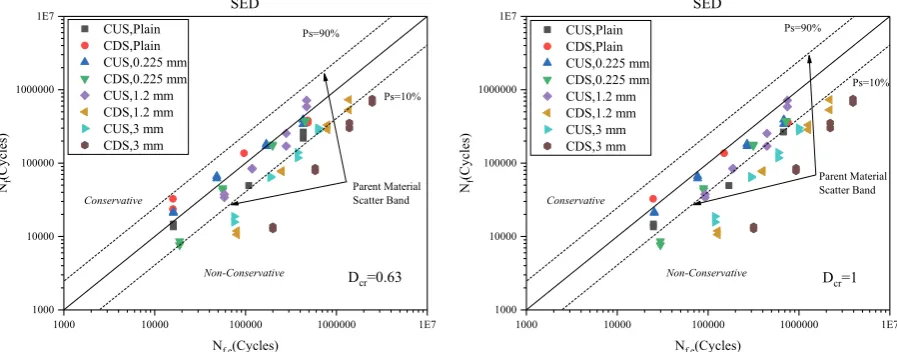
root radius are summarized in the experimental, Nf, vs. estimated, Nf,e, fatigue lifetime diagrams reported in Fig. 6a. The
[image:10.595.71.520.206.382.2]predictions with small notch radius made using the SED are seen to fall always within the parent material scatter band. For the medium notch radius, the predicted results mostly fall within the patent material scatter band. The predictions with large notch radius nearly fall outside of the parent material scatter band, and on the non-conservative side. In this case, the accuracy of the predicted results is higher as the notch becomes sharper. As shown in Fig. 6a, the novel formalization of the SED is seen to be capable of accurately assessing the fatigue lifetime of notched specimens under VA loading by adopting simple Palmgren-Miner rule. Using this approach can reduce the time and costs associated with the design process.
Figure 6: The accuracy of SED in estimating the fatigue lifetime of the notched samples under two critical value of the damage sum,
Dcr. (a)Dcr=0.63. (b)Dcr=1.
The same analysis as above was performed also by taking, as suggested by the classical theory by Palmgren and Miner, a critical value for the damage sum equal to unity. The diagram reported in Fig. 6b shows that for the damage sum equal to unity, the level of non-conservatism of increases, resulting in poor accurate estimates. The predictions with small notch radius have the highest accurate estimates, but on the non-conservative side. Other predictions with medium and large notch radius mostly fall outside of the parent material scatter band and on the non-conservative side. It is also interesting to note that the estimated results under CUS are higher accuracy than the results under CDS, which shows that the loading shape has obvious effect on the fatigue behaviour. In the CDS, the cycles of low stress levels take up the majority of the sequence length, which would make the prediction a little inaccurate.
According to the experimental evidence (Tab. 5), the critical value Dcr of plain specimens varied as the shape of the load
spectrum change. Dcr under the CUS spectrum is lower than the value of critical damage sum under the CDS spectrum.
Such a high variability shows that the critical value of critical damage sum strongly affects the accuracy of predicted fatigue lifetime. So far, the only way to correctly obtained Dcr is by running enough experiments. Though many damage sum
theories have also been developed [29-35], unfortunately, none of them enjoys universal acceptance due to the complexity of the problem, such as nonlinear damage, load sequence and small amplitude stress below fatigue limit. Consequently, the Palmgren-Miner rule is still dominantly used in design, in spite of its major shortcomings. More efforts on the cumulative damage are needed in order to provide design engineers with a general and reliable fatigue damage analysis and life prediction approach.
CONCLUSIONS
n the present work, the fatigue criterion based on the strain energy density (SED) has been applied to re-analyse some experimental results reported in the recent literature. The specimens being considered were characterized by three notch tip radius and tested under uniaxial loading. The relationship of the averaged SED and the number of cycles to failure was calculated by considering the sharper specimens. According to above the relationship and the Rain-Flow method, the novel formalization of the SED proposed was seen to be accurate in estimating fatigue lifetime of
1000 10000 100000 1000000 1E7 1000 10000 100000 1000000 1E7 Non-Conservative CUS,Plain CDS,Plain CUS,0.225 mm CDS,0.225 mm CUS,1.2 mm CDS,1.2 mm CUS,3 mm CDS,3 mm Nf (Cyc le s)
Nf,e(Cycles) Ps=90ș
Ps=10ș
Parent Material Scatter Band Conservative
Dcr=0.63 SED
1000 10000 100000 1000000 1E7 1000 10000 100000 1000000 1E7 CUS,Plain CDS,Plain CUS,0.225 mm CDS,0.225 mm CUS,1.2 mm CDS,1.2 mm CUS,3 mm CDS,3 mm Nf (Cyc le s)
Nf,e(Cycles) Non-Conservative
Ps=90ș
Ps=10ș
Dcr=1 SED
Conservative
Parent Material Scatter Band
Z. Hu et alii, Frattura ed Integrità Strutturale, 47 (2019) 383-393; DOI: 10.3221/IGF-ESIS.47.28
392
notched components damaged by VA uniaxial fatigue loading. It has also been observed that the critical value of damage sum has obvious effects on the accuracy of estimated fatigue life.
ACKNOWLEDGEMENTS
he authors would like to acknowledge the support by the Innovation Program (237099000000170004) and the State Key Laboratory Program (614221305020617) and also by the China Scholarship Council (Grant No. 201705290009).
REFERENCES
[1] Palmgren A. (1924). Durability of ball bearings, ZVDI, 68(14), pp. 339-341.
[2] Miner M. (1945). Cumulative Damage in Fatigue, J. Appl. Mech., 12, pp. A159-A164.
[3] Susmel L., Taylor D. (2011). The Theory of Critical Distances to estimate lifetime of notched components subjected to variable amplitude uniaxial fatigue loading, Int. J. Fatigue., 33(7), pp. 900-911.
[4] Susmel L, Taylor D. (2012). A critical distance/plane method to estimate finite life of notched components under variable amplitude uniaxial/multiaxial fatigue loading, Int. J. Fatigue., 38, pp. 7-24.
[5] Neuber H. (1958). Theory of notch stresses: principles for exact calculation of strength with reference to structural form and material, 2nd ed.. Berlin: Springer Verlag.
[6] Molski K., Glinka G. (1981). A method of elastic-plastic stress and strain calculation at a notch root, Mater. Sci. Eng., 50(1), pp. 93-100.
[7] Ellyin F., Kujawski D. (1989). Generalization of notch analysis and its extension to cyclic loading, Eng. Fract. Mech., 32(5), pp. 819-826.
[8] Lazzarin P., Zambardi R. (2001). A finite-volume-energy based approach to predict the static and fatigue behavior of components with sharp V-shaped notches, Int. J. Fracture., 112(3), pp. 275-298.
[9] Taylor D. (1999). Geometrical effects in fatigue: a unifying theoretical model, Int. J. Fatigue., 21(5), pp. 413-420. [10]Lazzarin P., Berto F. (2005). Some Expressions for the Strain Energy in a Finite Volume Surrounding the Root of
Blunt V-notches, Int. J. Fracture., 135(1-4), pp. 161-185.
[11]Lazzarin P., Berto F. (2008). Control volumes and strain energy density under small and large scale yielding due to tension and torsion loading, Fatigue. Fract. Eng. M., 31(1), pp. 95-107.
[12]Berto F., Lazzarin P. (2013). Fatigue strength of Al7075 notched plates based on the local SED averaged over a control volume, Sci. China. Phys. Mech., 57(1), pp. 30-38.
[13]Berto F., Gallo P., Lazzarin P. (2014). High temperature fatigue tests of un-notched and notched specimens made of 40CrMoV13.9 steel, Mater. Design., 63, pp. 609-619.
[14]Negru R., erban D., Mar avina L., Magda A. (2016). Lifetime prediction in medium-cycle fatigue regime of notched specimens, Theor. Appl. Fract. Mec, 84, pp. 140-148.
[15]Berto F., Lazzarin P., Yates J.R. (2011). Multiaxial fatigue of V-notched steel specimens: a non-conventional application of the local energy method, Fatigue. Fract. Eng. M., 34(11), pp. 921-943.
[16]Berto F., Lazzarin P. (2011). Fatigue strength of structural components under multi-axial loading in terms of local energy density averaged on a control volume, Int. J. Fatigue., 33(8), pp. 1055-1065.
[17]Berto F., Campagnolo A., Lazzarin P. (2015). Fatigue strength of severely notched specimens made of Ti–6Al–4V under multiaxial loading, Fatigue. Fract. Eng. M., 38(5), pp. 503-517.
[18]Berto F., Gagani A., Aversa R., Petrescu R.V.V., Apicella A., Petrescu F.I.T. (2016). Multiaxial fatigue strength to notched specimens made of 40CrMoV13. 9, Am. J. Eng. Appl. Sci., 9(4), pp. 1269-1291.
[19]Berto F., Lazzarin P., Yates J. (2011). Multiaxial fatigue of V notched steel specimens: a non conventional application of the local energy method, Fatigue. Fract. Eng. M., 34(11), pp. 921-943.
[20]Matsuishi M., Endo T. (1968). Fatigue of metals subjected to varying stress, Japan Society of Mechanical Engineers, Fukuoka, Japan, 68(2), pp. 37-40.
[21]Gurney T.R. (2006). Cumulative damage of welded joints, Woodhead Publishing.
[22]Lazzarin P., Campagnolo A., Berto F. (2014). A comparison among some recent energy- and stress-based criteria for the fracture assessment of sharp V-notched components under Mode I loading, Theor. Appl. Fract. Mec, 71, pp. 21-30.
Z. Hu et alii, Frattura ed Integrità Strutturale, 47 (2019) 383-393; DOI: 10.3221/IGF-ESIS.47.28
393
[23]Berto F., Lazzarin P. (2014). Recent developments in brittle and quasi-brittle failure assessment of engineering materials by means of local approaches, Materials Science and Engineering: R: Reports, 75, pp. 1-48.
[24]Razavi S., Ferro P., Berto F., Torgersen J. (2018). Fatigue strength of blunt V-notched specimens produced by selective laser melting of Ti-6Al-4V, Theor. Appl. Fract. Mec, 97, pp. 376-384.
[25]Lazzarin P., Livieri P., Berto F., Zappalorto M. (2008). Local strain energy density and fatigue strength of welded joints under uniaxial and multiaxial loading, Eng. Fract. Mech., 75(7), pp. 1875-1889.
[26]Lazzarin P., Sonsino C., Zambardi R. (2004). A notch stress intensity approach to assess the multiaxial fatigue strength of welded tube to flange joints subjected to combined loadings, Fatigue. Fract. Eng. M., 27(2), pp. 127-140. [27]Lazzarin P., Berto F., Zappalorto M. (2010). Rapid calculations of notch stress intensity factors based on averaged
strain energy density from coarse meshes: Theoretical bases and applications, Int. J. Fatigue., 32(10), pp. 1559-1567. [28]Berto F. (2016). Fatigue and fracture assessment of notched components by means of the Strain Energy Density, Eng.
Fract. Mech., 167, pp. 176-187.
[29]Manson S., Halford G.R. (1981). Practical implementation of the double linear damage rule and damage curve approach for treating cumulative fatigue damage, Int. J. Fracture., 17(2), pp. 169-192.
[30]Halford G.R. (1997). Cumulative fatigue damage modeling—crack nucleation and early growth, Int. J. Fatigue., 19(93), pp. 253-260.
[31]Fatemi A., Yang L. (1998). Cumulative fatigue damage and life prediction theories: a survey of the state of the art for homogeneous materials, Int. J. Fatigue., 20(1), pp. 9-34.
[32]Socie D. (1987). Multiaxial fatigue damage models, J. Eng. Mater. Technol., 109(4), pp. 293-298.
[33]Łagoda T. (2001). Energy models for fatigue life estimation under uniaxial random loading. Part I: The model elaboration, Int. J. Fatigue., 23(6), pp. 467-480.
[34]Bui-Quoc T. (1982). Cumulative damage with interaction effect due to fatigue under torsion loading, Exp. Mech., 22(5), pp. 180-187.
![Figure 1: (a) Geometries of the tested notched samples (dimensions in millimetres). (b) Fatigue results generated under CA uniaxial fatigue loading [3]](https://thumb-us.123doks.com/thumbv2/123dok_us/1856426.142380/3.595.171.440.247.656/figure-geometries-notched-dimensions-millimetres-fatigue-generated-uniaxial.webp)
![Figure 2: Adopted load spectra (a) CUS and (b) CDS [3].](https://thumb-us.123doks.com/thumbv2/123dok_us/1856426.142380/5.595.159.433.516.722/figure-adopted-load-spectra-cus-and-b-cds.webp)
![Table 4: Summary of the experimental results generated by testing the notched specimens with root radius equal to 3 mm under VA fatigue loading [3]](https://thumb-us.123doks.com/thumbv2/123dok_us/1856426.142380/6.595.119.539.86.299/summary-experimental-results-generated-testing-notched-specimens-fatigue.webp)