Int. J. Electrochem. Sci., 10 (2015) 10272 - 10291
International Journal of
ELECTROCHEMICAL
SCIENCE
www.electrochemsci.org
Investigating Electrochemical Properties and Interfacial
Processes of Manganese Oxides/Graphene Hybrids as
High-Performance Supercapacitor Electrodes
S. Gupta1,*, M. vanMeveren1, and J. Jasinski2 1
Department of Physics and Astronomy, Western Kentucky University, 1906 College Heights Blvd. Bowling Green, KY 42101-3576, USA
2
Department of Chemical Engineering andConn Center for Renewable Energy, University of Louisville, KY 40292, USA
*
E-mail: [email protected]
Received: 5 August 2015 / Accepted: 7 September 2015 / Published: 4 November 2015
In this work, we report on the development of novel materials using a combination of known materials with diverse functionality for energy storage applications. We prepared graphene-inorganic ‘hybrids’ coupled with electrochemically synthesized manganese oxides on graphene oxide and reduced graphene oxide platforms such that each component play a unique and critical function for high-performance. A range of complementary characterization tools reveal the surface morphology, local (lattice dynamical) and average structure, and local charge transfer due to adsorbed manganese oxides highlighting the surface structure and interfaces of hybrids. The electrochemical performance of the graphene-based hybrids as asymmetric supercapacitors is evaluated by cyclic voltammetry and impedance techniques exhibiting nearly rectangular cyclic voltammograms superimposed with redox peaks from manganese oxides with an average specific capacitance of > 550 Fg-1 and it was charged / discharged within seconds or < 1 minute. We also determined the electric-double layer or interfacial capacitance, charge transfer resistance and low frequency capacitance. The results demonstrate that this facile approach affords chemical adsorption thus expected to have synergistic coupling between the pseudocapacitive / supercapacitive components and displaying stable high-performance behavior attributed to reasonable density of tailored interfaces. Scanning electrochemical microscopy allowed mapping enhanced electrochemical activity/(re)activity of surface ion adsorption at solid/liquid interface.
1. INTRODUCTION
An intense research activity on alternative energy sources is stimulated by continuously increasing global demand on electrical energy. The electrochemical energy-storage devices (EESDs) including supercapacitors and batteries represent some of the most efficient and environmentally benignity technologies [1, 2]. Supercapacitors play a vital role as efficient energy storage and conversion devices due to their coexisting larger power and energy density which fills the gap between traditional capacitors and batteries. As a result, the development of advanced electrodes of novel functional materials with higher performance becomes indispensable. The breakthroughs happen when advanced materials or combinations of known materials with multi-dimensionality and functionality are created.
exact electronic structure of GO and rGO is limited due to lack of detailed knowledge on bonding configuration, random location of the residual oxygen, number density and type of defects generated during oxygen evolution, nature of hybridization states of C-C and C=O bonds and spatial distribution, it does not prevent their development with other materials forming hybrids with facile surface structure and creating tailored interfaces for electrochemical energy storage applications presented in this work. It owes to the proliferation of portable consumer electronics, where much effort has been devoted to lightweight, flexible and wearable electronics (i.e. wearable displays, artificial electronic skin, and distributed sensors) to meet the growing demands of modern digital society on the electrical energy storage systems [31, 32].
While typical supercapacitors electrodes are based on a gamut of nanocarbons (e.g. activated carbon, porous carbon, carbon nanotubes, graphene and related materials) as active material [33,34,35,36,37,38] occasionally they are limited by themselves as high-performance systems in terms of energy density. Likewise, pseudocapacitive (alternatively, redox- or electroactive) materials include metal oxides, metal hydrides, metal hydroxides and conducting polymers are explored that are limited in power density. It is noteworthy that in practical supercapacitor electrodes, the two energy storage mechanisms often work rather concomitantly. To address these issues, graphene-based hybrid composites are considered in an effort to overcome the charge-storage limitations and poor cycling behavior, where loading of electroactive materials allow substantial higher storage capacities than those of bare graphene. For the hybrid composites, graphene act as support for the growth of redox-active nanostructures facilitating uniform deposition and optimum loading that in turn hinder re-stacking (or agglomeration) by lowering the van der Waals forces among the graphene layers and helps in shuttling electrons involved in redox reactions during electrochemical processes thus enhancing the performance in terms of specific charge storage capacity and charge-discharge cyclability. Metal oxides (MeOx) are attractive since they offer higher specific capacitance, wide operational potential window (required for Faradaic redox reactions) and stability through multiple charging-discharging cycling. Among several redox-active materials (Me = Ru, Ti, Mn, Co, V, Fe, Ni, Mo etc.) [39,40] recent research has evidenced that manganese oxide polymorphs (i.e. MnO2 and Mn3O4) appear to promising with advantages of cost effective, scalable synthesis and simple processing, environmental benignity (harmful only by excessive inhalation), rich electrochemical properties such as rapid charging-discharging with various oxidation states (Mn2+/Mn3+/Mn4+) [41]. Mn3O4 is a mixed-valence oxide which adopts a tetragonally distorted spinel structure at room temperature and pressure [42]. The other polymorph MnO2 possesses rutile crystal structure with three-coordinate oxide and octahedral metal centers [43]. Graphene-based hybrid materials expand the scope of graphene applications as synergistic effects can result from the interactions (covalent, electrostatic or weaker physisorption and proximity) [44, 45] between graphene and MeOx supported onto graphene creating tailored interfaces [46, 47, 48, 49, 50].
electrochemical deposition of manganese oxide nanostructures on graphene derivatives as support to form hybrid supercapacitors affording stronger chemical attachment. They are expected to have coupling between the pseudocapacitive transition metal oxides and supercapacitive graphenes with additional electrolyte transport paths for electron transfer and proton / cation diffusion showing enhanced electrochemical performance due to the interconnected tunnel crystal phase and reasonable areal density of tailored interfaces. These hybrid supercapacitors are investigated in terms of electrochemical and electrochemical microscopy properties to establish microscopic structure-property-function correlations highlighting the surface structure and interfacial process.
2. EXPERIMENTAL
2.1 Materials and Methods 2.1.1 Synthesis
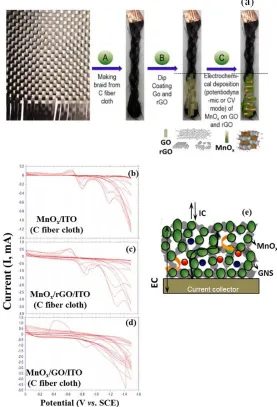
We prepared architectures using electrochemical approach depicted in Fig. 1 and the fabrications details are described as follows. To fabricate thin films of GO, rGO and hybrids, GO was synthesized from natural graphite by the modified Hummers method followed by chemical reduction using hydrazine monohydrate giving rise to rGO [51, 52, 53]. We made suspensions / dispersions of 10 mL each of typical concentration of 0.085 mg/mL in Milli-pure (Milli-Q) water and sonicated for 1 hr at room temperature. After the preparation of colloidal suspensions of individual GO and rGO nanoplatelets, the GO and rGO was deposited by spray-coating for 5 and 10 coats on carbon fiber cloth and ITO coated class substrates of thickness 1 mm and surface area of 1 cm2 (2 cm x 0.5 cm). After the deposition of GO and rGO, a thin film of MnOx (possibly MnO2) was deposited using potentiodynamic cyclic voltammetry; CV between potential window of1.6 V and 0 V in 0.05 M (CH3COO)2 Mn.4H2O solution dissolved in 0.1 M Na2SO4 aqueous electrolyte in a typical three-electrode electrochemical cell with Ag/AgCl as a reference electrode (KCl saturated), Pt-wire as a counter electrode and the pre-prepared GO (and rGO)/C fiber cloth (and ITO) as a working electrode. The mass loading of MnO2 is controlled by adjusting the total charge passed through the electrode and number of cycles during deposition process and selected to 100 μg cm-2. All CV growth experiments were performed at a scan rate of 50 mV/s using a potenitostat/galvanostat electrochemical workstation (CH Instruments Inc. Model 920D) [see Fig. 1].
2.2 Characterization
[image:5.596.161.438.163.570.2]
ranging 5°70°. Samples were run at a scan rate of 0.04°/second and 0.02°/second, if initial measurement contained unacceptably noisy data. Samples for transmission electron microscopy (TEM) and selected-area electron diffraction (SAED) were prepared by placing one or two drops from as-deposited samples on commercial lacey carbon Cu grids (Ted Pella Inc. CA) and allowing it to air dry.
Figure 1. Schematic of(a) electrochemically synthesized manganese oxide nanostructures on braided carbon fiber cloth and cyclic voltammograms 10 cycles between 0 and 1.6V at scan rate of 50 mV/s in 0.5 M Na2SO4 aqueous electrolyte and 0.05 M Mn(OAc)2 precursor (b) by itself, MnOx in 10 cycles (c) on 10 coats of rGO and (d) on 10 coats of GO, all deposited on carbon fiber cloth and/or ITO coated glass substrates. (e) A cartoon of rational design of high-energy high-power hybrid supercapacitor electrodes improving the ionic current (IC) and electronic current (EC) within the electrode via growing MnOx nanostructured and interconnected graphene nanosheets (GNS) including GO and rGO network with high surface area and higher electronic conductivity.
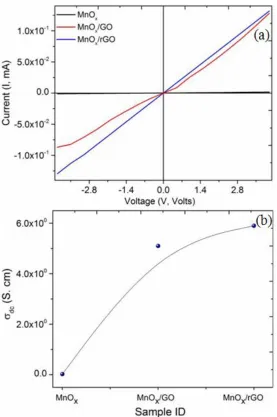
patterns were acquired using a JEOL 1400Plusinstrument. For SAED, we used 0.20 m aperture with a small spot size and spread beam to increase the electron coherence length at the sample. The SAED ring pattern was transformed in intensity versus interplanar spacing profile using Digital Micrograph (v.3.0) software. The Raman spectra were recorded using a micro-Raman spectrometer (Model InVia Renishaw plc, UK) equipped with excitation laser of wavelength 632.8 nm (or energy EL = 1.92 eV) and power of maximum 18 mW (~46 mW incident at the sample), with edge filters cutting at ~100 cm-1. The scattered light from the sample is collected in backscattering geometry, transmitted by a beam splitter and detected by CCD camera. An objective lens of 50x was used providing spot size of 23 m. Extreme care was taken to avoid sample damage or laser induced thermal degradation. The reflected light is filtered using an edge filter to remove the laser excitation and sent to a spectrometer. Raman shift was ranged from 200 cm-1 to 3200 cm-1 for Co containing hybrids and for GO and rGO it was kept between 1150-3200 cm-1 with spectral resolution of 1 cm-1. The acquisition time per pixel was a few minutes to slightly less than an hour. The data was analyzed using Jandel Scientific Peakfit software and WiRE4 software in-built fitting, both based on Marquardt-Levenberg method. Raman spectra determined the lattice vibration characteristics at various areas of interest on the nanostructure and hybrid coating surfaces. Allowing more detail and a greater understanding of the interaction between graphene-related materials and manganese oxides, we also measured room temperature electrical properties (i.e. IV). We made electrical contacts with colloidal silver paste and attached a Cu wire for connection with Keithley 2400 source meter (Keithley, OH). We measure two point contact resistance and determined room temperature electrical conductivity (dc) of all of the samples studied. The electrical conductivity for these hybrid films has been measured ranging 0.05-1 S/cm. The surface composition of the samples (at. %) was also determined by XPS (x-ray photoelectron spectroscopy) and the data was acquired using a VG Micro Tech ESCA 2000 X-ray photoelectron spectrometer and EDS. For the XPS measurements, the dispersion solutions were deposited onto silicon substrates to form hybrid thin films, respectively (not shown). A asymmetric three-electrode cell configuration was employed for electrochemical measurements in potentiodynamic cyclic voltammetry (CV), galvanostatic charging-discharging cycling, amperometric and ac impedance spectroscopy (ac EIS) modes, where a saturated Ag/AgCl (3M KCl) electrode and Pt wire of 3 mm diameter were used as the reference and counter electrode, respectively. Hybrid films of MnO2/GO (and rGO) on ITO coated glass slides and carbon fiber cloth were used as the working electrodes. Cyclic voltammetry (CV) was performed in 1M Na2SO4 aqueous electrolyte within the potential range of 0.8 V and +1.0 V as a function of scan rate, v = 5, 10, 20, 50, 80, 100 and 500 mV/s. Galvanostatic charge-discharge cycling was conducted at constant current densities of 1–10 mA cm-2 between 0–1 V. The applied ac amplitude for EIS measurements was 10 mV root mean square in a frequency range of 0.01 Hz to 100 kHz at +0.2 and +0.4 V. Cyclic voltammetry gravimetric specific capacitance (Cs) was calculated from dividing the capacitive charge (Q), obtained using half the integrated area of the CV curve, by the film mass (m) and the width of the operating potential window (V) using equation (1): Cs
Q / m.ΔV F.g-1
. Chronopotentiometry discharge specific capacitance Cs values were calculated by using charge-discharge current (I), potential change with discharge time (dV/dt) and the mass of the deposited film according to the equation (2): Cs = I dt / m.ΔV F.g-1. The SECM measurements are
we used a Pt microelectrode (~58 m) as the probe working electrode (tip) and a redox mediator, 10 mM K3Fe(CN)6 (potassium ferricyanide; Fe(CN)63-) in support electrolyte 1M KCl, for detecting kinetic differences. K3Fe(CN)6 has a standard potential E0 = 0.21 V versus Ag/AgCl, thus the Pt tip electrode will be held at a potential of Et = 0.2 V versus Ag/AgCl to ensure complete diffusion-limited oxidation of the Fe(II), species originally present in solution, to Fe(III). The supercapacitor electrodes were biased at VS = +0.5 V versus Ag/AgCl to ensure complete reduction of the species generated at the micro-tip. The tip was scanned over the working electrode surface area 600 m x 600
m at a constant tip-substrate separation of 40 μm to generate a feedback image with an approximate resolution of the radius of the tip (∼ 5 μm).
3. RESULTS AND DISCUSSION
3.1 Structure and Morphology
Figure 2. SEM images of (a) bare carbon fiber cloth, GO, rGO, electrochemically synthesized MnOx, MnOx/rGO and MnOx/GO hybrids revealing fiber strands, flower-like morphology of MnOx, graphene nanosheets and nanowalls coated with MnOx. (b) TEM images taken with 100 kV along with SAED patterns with an aperture size of 200 nm for representative samples of MnOx/rGO and MnOx/GO exhibiting surface morphology at nanoscale exhibiting surface modulations and corrugations. (c) The corresponding diffraction ring intensity pattern versus interplanar spacing (dhkil) is also provided. Scale bars for TEM and SAED images are 10 and 5 nm, respectively.
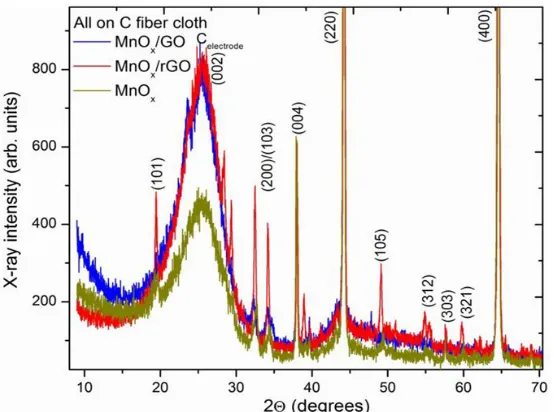
the interlayer galleries of hydrophilic GO sheets. On the other hand, rGO contains very broad reflection peak at 2 = 24.5o correspond to d = 0.36 nm, indicating restacking of graphene platelets or sheets to form a multilayer graphene. Besides the deposited particles of MnO2 are of sufficient larger grain size to have crystalline structure with various diffraction peaks indexed to (002), (311) and (440) reflections characteristic of pyrolusite MnO2 crystal structure. The crystallite size is obtained from XRD analysis using Debye-Scherrer equation following the relation: Lhkl = Kλ/hkl coshkl, where Lhkl is the crystallite size in nm, λ is the wavelength of Cu K, hkl is the full-width at half-maximum and K
is the shape constant and it is equal to 0.94.
Figure 3. XRD diffractograms for electrochemically synthesized MnOx, MnOx/rGO and MnOx/GO (front and back side of samples) hybrids showing characteristic peaks. The peaks are marked with rectangular box and their (hkl) index. All of the diffractograms are taken in -2 geometry with Cu K X-ray source (λ = 1.5405 Å).
The diffraction peaks of hybrids are broad and of low intensity while preserving phases of the constituents implication of forming truly composites. The peak at 2 = 36.14o is used to determine the lattice spacing (dhkl) and particle size of hybrids which are averaged 90 and 110 nm for GO- and rGO-based hybrids, respectively.
[image:9.596.160.437.226.432.2]
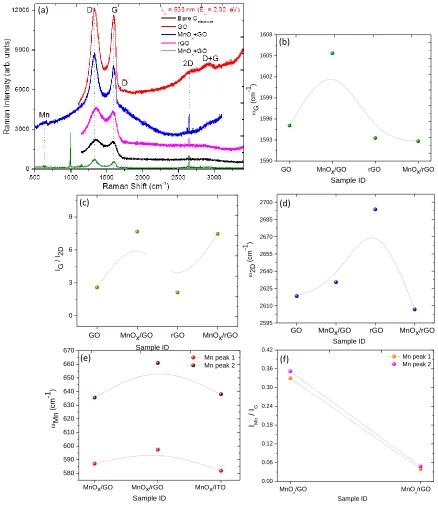
Figure 4. (a) Representative micro-Raman spectra excited at 633 nm wavelength (EL =1.92 eV) showing characteristic peaks for bare carbon fiber cloth, GO, rGO, electrochemically synthesized MnOx, MnOx/rGO and MnOx/GO hybrids within 300–3200 cm-1 spectral window showing characteristic peaks associated with Mn, D, G and 2D, and D+G bands. Raman spectral analysis in terms of (b) G band position (G), (c) intensity ratio of G to 2D band (IG/I2D), (d) 2D band position (2D), (e) bands associated with Mn (Mn) and (f) intensity ratio of Mn to G band (IMn/IG).
The band D’ indicates the disorder and it is associated with finite-size graphite crystals and graphene edges. In brief, the strong D and D′ bands suggest presence of nanocrystalline structure,
2595 2610 2625 2640 2655 2670 2685 2700
GO MnOx/GO rGO MnOx/rGO
2D ( cm -1 ) Sample ID 1590 1593 1596 1599 1602 1605 1608 G ( cm -1 ) Sample ID
GO MnOx/GO rGO MnOx/rGO
0.00 0.06 0.12 0.18 0.24 0.30 0.36 0.42
Mn peak 1 Mn peak 2
MnOx/GO MnOx/rGO
IMn / I G Sample ID 0 3 6 9
GO MnOx/GO rGO MnOx/rGO
I G / I 2D Sample ID (a) (b) (c) (d) 580 590 600 610 620 630 640 650 660 670
Mn peak 1 Mn peak 2
MnOx/GO MnOx/rGO MnOx/ITO
[image:10.596.88.526.82.591.2]
graphene edges and defects including distortion, vacancies and micro-strain to graphitic lattices, which are all prevalent in disorder graphene [58, 59, 60, 61]. It is worthy to mention that the presence of defects and active edges in the graphitic lattices are kind of prerequisites for supporting the nucleation and growth of the assembled electroactive or redox nanoparticles and subsequently their electrochemical performance. On the other hand, rGO spectra indicates removal of C=O (carboxylic), C–O (epoxy) and C–O (alkoxy) groups, partial elimination of hydroxyl groups along with simultaneous restoration of carbon-carbon bonding. The remnants of hydroxyl groups are reported to be related to water molecules intercalated in-between graphene layers, which do not affect the hydrophobicity of graphene and usually improve electrical conductivity. Commonly, the integrated intensity ratio of D to G band (ID/IG) serve as a convenient measurement of the amount of defects and the size of the sp2 C cluster or nanodomains that tends to increase during reduction of GO. Following Strohmeier and Hercules [62] and Kapteijn et al. [63] MnO2 is Raman active, whereas Gosztola and Weaver [64] and Bernard et al.[65] reported well-defined spectra of this transition metal oxide. In our Raman spectra, MnO2 has main features recognized at ~ 585 cm-1 and ~ 640 cm-1. The band at ~ 580 cm-1 observed is attributed to Mn-O lattice vibrations in MnO2, which is in good agreement with the bulk tetragonal MnO2 phase [66, 43]. All of these spectra reflect the formation of MnO2/GO and MnO2/rGO hybrid films. For symmetry considerations, the band at ~ 650 cm-1 is assigned as E1g mode and it is attributed to the stretching mode of Mn–O bond in MnO6 octahedra shared by corners and/or edges in its crystal structure [67, 68]. Moreover, Raman scattering in MnO2 arises from a collective vibration mode of the MnO6 octahedron. The peaks at lower wavenumber correspond to the deformation modes of the metal–oxygen chain of Mn–O–Mn in the MnO2 octahedral lattice sites. Since the manganese atom is about five times heavier than the oxygen atoms, the vibrations of the Mn–O groups are supposed to involve mainly the oxygen atoms.
Raman spectra are analyzed in terms of G (D), 2D (2D), Mn (Mn) band position, the intensity ratio of D to G (ID/IG), G to 2D (IG/I2D) and Mn to G (IMn/IG) presented in Figs. 4b-4f. While for GO-based hybrids, the G band ranged between 15951602 cm-1, the change in rGO-based material is minimal at 15931595 cm-1, which is within the spectral resolution (Fig. 4b). On the other hand, the 2D band changes rather strongly with manganese oxides on GO (26202625 cm-1) and rGO (26902610 cm-1) supports (Fig. 4d). The intensity ratio of G and 2D bands (IG/I2D) show strong dependence with MnO2 on GO (38) and rGO (28) supports (Fig. 4c). The variation of Mn peaks is marginally higher for rGO hybrid (589 cm-1 and 660 cm-1) as compared with GO hybrid (585 cm-1 and 635 cm-1) as compared with MnOx (584 cm-1 and 633 cm-1) by themselves (Fig. 4e). For IMn/IG ratio, it is 0.35 for MnO2/GO and 0.06 for MnO2/rGO hybrids for both the MnO2 related bands (Fig. 4f).
Figure 5. (a) Current versus voltage (I-V) plots for electrochemically synthesized MnOx, MnOx/GO and MnOx/GO hybrids and (b) corresponding variation in room temperature dc electrical conductivity (dc).
3.2 Electrochemical Supercapacitive Behavior
[image:12.596.159.436.71.488.2]
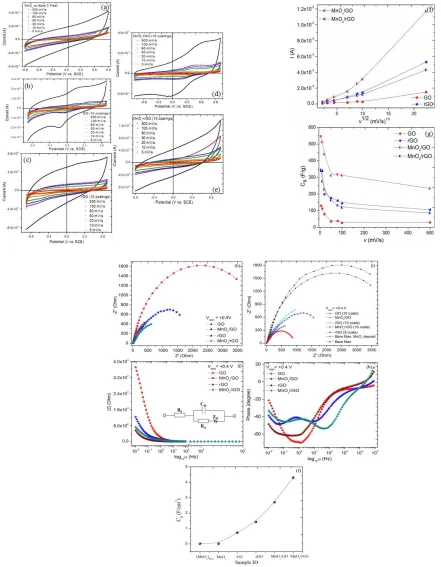
The magnitude of the current observed is governed by the Randles- Ševćik equation for a reversible transfer process: Irev = 0.446FAC (FDv / RT)0.5 or alternatively, for the case of fully
irreversible electron transfer process: Iirrev = 0.496 (n')0.5nFAC (FDv / RT )0.5, where A is the
geometric area of the electrode (cm2), is the transfer coefficient (usually presumed to be 0.5), F is Faraday Constant (C mol−1), D is diffusion coefficient (cm2/s), C is concentration (mol/cm3), v is scan rate (V/s), R and T are usual constants, n is the total number of electrons transferred in the electrochemical process and n’ is the number of electrons transferred before the rate determining step. While GO shows almost linear behavior indicative of diffusion-limited phenomena, the curves for rGO, MnOx/GO and MnOx/rGO started to show non-linear behavior reflective of heterogeneous diffusion behavior. Figure 6g presents the variation in the specific capacitance with scan rate for GO, rGO, MnOx/GO and MnOx/rGO electrodes. As observed, all electrodes show gradual decrease in Cs with increasing scan rate. The highest Cs values for MnOx/GO, MnOx/GO, rGO, GO and MnOx electrodes at a scan rate of 10 mV s-1, are 560, 350, 150 and 70 Fg-1, respectively. Hence, the presence of underlying GO and rGO films provides more electrochemical (re)active sites for the redox reaction of manganese dioxide.
To understand the reasons behind the unique capacitive performance of hybrid electrodes compared to constituent MnO2 electrode, a comparative electrochemical impedance spectroscopy (EIS) data were also collected to quantify the electronic and ionic conductivity behavior and diffusive behavior of the MnO2-based films besides determining the electric-double layer capacitance (Cdl), charge transfer resistance (Rct) and low frequency (Clf) capacitance. Nyquist plots of as-prepared hybrid MnOx/GO and MnOx/rGO and GO, rGO and MnOx electrodes were measured in 1M Na2SO4 electrolyte over the frequency range from 10 mHz to 100 kHz as shown in Fig. 6h-6i. The Nyquist plots of these electrodes are closer to an ideal supercapacitor, which have a straight line in the low- frequency region and a small arc in the high-frequency region. In principle, the highest frequency intercept at the real component of impedance (Z') at the beginning of the arc represents the equivalent series resistance (ESR) [69], which consists of various contributions including the ionic resistance of the electrolyte (Rs), intrinsic resistance of the active material, intrinsic resistance of current collector and contact resistance at the interface between active material and current collector. The power density of supercapacitors depends strongly on the ESR [70]. The arc in the high-frequency region corresponds to the Rct caused by the charge transfer process (e.g. Faradaic reactions) and electric double layer charging on the electrode surface and its magnitude is derived from arc diameter [71]. The line at low-frequency region is a result of ion diffusion transport from the electrolyte to the electrode surface [52]. The trend in increasing slope exhibits the capacitive nature related to the film charging mechanism, typical characteristic for porous framework electrodes.
2.81, 3.01, 0.83 and 0.52 Ω, respectively, reflecting the enhancement in the electronic and ionic conductivities of MnO2 with the presence of GO and rGO nanosheets. Finally, the slope of the Nyquist plots in the low-frequency region tends to increase with the presence of underlying GO and rGO films as compared with its absence, reflecting a decrease in the Warburg resistance (W) or fast electrolyte ion diffusion into the hybrid composites. The Fig. 6l shows area low frequency capacitance variation derived following Clf = 1/2fZ”. Finally, the energy density (E = 1/2 CsV2/m) and power density (P = V2/4mRS) values of MnO2/GO and MnO2/GO electrodes estimated from Cs at chargingdischarging current density of 1 mA cm-2 are 115 W kg-1 (105 W kg-1) and 1104 Wh kg-1 (1017 Wh kg-1), respectively. In brief, the improvement in the capacitive performance of MnO2 film is determined with the presence of underlying GO and rGO sheets creating more active sites and tailored interfaces with MnO2, facilitating the access of electrolyte ions and makes electron transport between GO (and rGO) and MnO2 easier as confirmed by the results obtained from EIS data.
3.3 Scanning Electrochemical Microscopy
Electrochemistry is an interfacial technique dominated by surface and interfacial dynamics and reactivity processes occurring at solid/liquid interface. Optimizing energy storage and detailed mechanistic understanding at electrode/electrolyte interface are critical for their advancement. Recent studies showed that the graphene surface favor charge transfer surface adsorption sites including structural defects, imperfections and heterogeneity disrupting sp2 C conjugation speculating that the larger defects sites concentration, interfaces and/or edge sites are relatively more reactive than those of pristine or clean surfaces [72]. Therefore, it is conceivable to investigate the nature of physical-chemical processes over hybrid electrodes surface. While CV characterizes the effective electrode areas comparable to geometric areas, SECM allows electrochemical currents to be mapped across electrode surface correlating with the structure in-situ and probe charge (ionic and electronic current; IC and EC) transport in contrast to other scanning probe microscopy techniques [73 ,74]. Among several operation modes, the visualization of the electrochemical activity is performed in feedback mode taking advantage of positive feedback over conductive/electrochemically active areas versus negative feedback over insulating/non-conductive/ relatively electrochemically inactive areas of the surface [74]. By detecting redox reactions occurring in small region in close proximity to electrode surface, SECM is used to obtain chemical reactivity images, local quantitative information of reaction rates (Fig. 7) and determine adsorption sites areal density (Fig. 7).
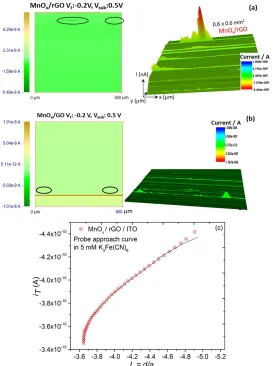
Figure 7c provides probe approach curves for hybrids with normalized distance, L = d/a, where d is substrate (electrode)-tip distance and a, the radius of the tip. The tip electrode current (iT) reaches asymptotic behavior with steady-state current following: iT,∞ = 4nFCDa, where n is the number of
insulating region and diffusion to the electrode is inhibited as a result of physical obstruction as the tip approaches the substrate, creating a "negative" feedback loop thus decreasing the tip current (iT < iT,∞) [74,75]. Thus the total tip current is given by: iT = nFDC a2 /d + 4nFDCa , where the symbols have
[image:16.596.161.434.191.557.2]usual meaning. The first term is reminiscent of extent of concavity (or convexity) of probe approach curves plotted in Fig. 7c as solid curves and the second term helped to determine D that ranged between 1 x 10-83 x 10-6 m2 s-1 in the order (MnOx/GO) > (MnOx/rGO).
Figure 7. The scanning electrochemical microscopy (SECM) of representative (a)MnOx/rGO and (b) MnOx/GO hybrid samples displaying probe current distribution in 2D and 3D with occasional higher/lower current “highly reactive” electrochemical sites along with (c) probe approach curve for MnOx/rGO indicative of semiconductive/insulating behavior at the solid/liquid interface in redox mediator 10 mM K3Fe(CN)6 (potassium ferricyanide; Fe(CN)63-) in support electrolyte 1M KCl at tip voltage of Vt = 0.2 V and substrate voltage Vs = 0.5 V. A color bar is shown for quantitative values of the current.
recorded over the polarized electrode surface (collection). The higher and lower surface current is characteristic of metal/insulating/semiconducting behavior at the solid/liquid (or electrode/electrolyte) interface. It is apparent from the probe current distribution that both the samples yielded occasional relatively higher values of probe current reinforcing the role played by both GO and rGO platelets along with MnOx nanoparticles in providing more (re)active sites.
4. CONCLUSION
We have demonstrated the successful preparation of graphene/manganese dioxide hybrid electrodes via potentiodynamic cycling deposition of semi-crystalline MnOx film on pre-deposited graphene derivatives coated on carbon fiber cloth and ITO as substrates from aqueous solution of GO and rGO colloidal dispersions. Raman spectroscopy and other complementary structural analytical techniques confirmed that the electrochemical process enables the formation of MnO2 on overlapped and stacked platelets of GO and rGO nanosheets having sufficient electrochemically active sites. The hybrids and constituent electrodes performance was characterized as asymmetric supercapacitors. It was found that the presence of underlying GO and rGO films loaded with optimized MnO2 nano-aggregates increased the specific capacitance of the films with Cs of 560 Fg-1 (and 350 Fg-1) and Rct of 0.52 Ω (and 0.83 Ω) for MnO2/GO (and MnO2/rGO) electrodes. These MnO2/GO and MnO2/rGO hybrid electrodes exhibited power density of 1017 W kg-1 and 1104 W kg-1 and corresponding energy density of 115 Wh kg-1 and 105 Wh kg-1, respectively. The large specific surface area and marginally defective nature of graphene derivatives in conjunction with an efficient utilization of MnO2 nanoparticles facilitated rapid ion transport and electrochemical cyclic stability. In addition, the SECM allowed to visualize hybrid surfaces electrochemically reactive adsorption sites and to investigate electrode/electrolyte interfaces determining diffusion constant.
ACKNOWLEDGEMENTS
The author (S.G.) gratefully acknowledges financial support in parts from WKU Research Foundation for start-up funds and NSF EPSCoR Track RII Award (EPS-0814194 and 3048108525-l4046). The authors (S.G. and M.vM.) also acknowledge the WKU Research Foundation for awarding an internal Research grant. We thank Carson Price and Dr. J. Andersland for help in some of the TEM measurements.
References
1. R. Kötz, M. Carlen, Electrochimica Acta, 45 (2000) 2483.
2. L.-Q. Mai, F. Yang, Y.-L. Zhao, X. Xu, L. Xu, Y.-Z. Luo, Nature Communication, 2 (2011) 381. 3. A.K. Geim, K.S. Novoselov, Nature Materials, 6 (2007) 183.
4. S. Gupta, E. Heintzman, J. Jasinski, Journal of Electronics Materials, 43 (2014) 3458 and references therein.
5. Y. Zhang, Y.-W. Tan, H. L. Stormer, P. Kim, Nature, 438 (2005) 201. 6. C. Lee, X. D. Wei, J. W. Kysar, J. Hone, Science, 321 (2008) 385.
7. M. D. Stoller, S. Park, Y. Zhu, J. An, R. S. Ruoff, Nano Letters, 8 (2008) 3498. 8. C. Liu, Z. Yu, D. Neff, A. Zhamu, B. Z. Jang, Nano Lett. 10 (2010) 4863. 9. Hou, Y. Shao, M. Ellis, B. R. Moore, B. Yi, PCCP 13 (2011) 15384.
10. K. P. Loh, Q. L. Bao, P. K. Ang, J. X. Yang, Journal of Materials Chemistry, 20 (2010) 2277. 11. K. P. Loh, Q. Bao, G. Eda, M. Chowalla, Nature Chemistry 2 (2014) 1015 and references therein. 12. G. Eda, M. Chowalla, Advanced Materials 22 (2010) 2392 and references therein.
13. A. J. Du, Z. H. Zhu, S. C. Smith, Journal of the American Chemical Society, 132 (2010) 2876. 14. Q. Zhang, E. Uchaker, S. L. Candelaria, C. Guozhong, Chemical Society Review, 42 (2013) 3127
(2013).
15. B. E. Conway, Electrochemical Supercapacitors: Scientific Fundamentals and Technological Applications, Kluwer Academic, Plenum Publishers, New York (1999).
16. L. Nyholm, G. Nyström, A. Mihranya, M. Strømme, Advanced Materials, 23 (2011) 3751. 17. J. T.-Wei Wang, J. M. Ball, E. M. Barea, A. Abate, J. A. A.-Webber, J. Huang, M. Saliba, I.
M.-Sero, J. Bisquert, H. J. Snaith, R. J. Nicholas, Nano Letters, 14 (2014) 724. 18. M. Liu, R. Zhang, W. Chen, Chemical Review, 114 (2014) 5117.
19. B. Luo, S. M. Liu, L. J. Zhi, Small, 8 (2012) 630.
20. S. Gupta, A. Irihamye, AIP Advances, 5 (2015) 037106 and references therein.
21. P. Blake, P. D. Brimicombe, R. R. Nair, T. J. Booth, D. Jiang, F. Schedin, L. A. Ponomarenko, S. V. Morozov, H. F. Gleeson, E. W. Hill, A. K. Geim, K. S. Novoselov, Nano Letters, 8 (2008) 1704.
22. I. V. Pavlidis, T. Vorhaben, D. Gournis, G. K. Papadopoulos, U. T. Bornscheuer, H. Stamatis, Journal of Nanoparticle Research, 14 (2012) 842.
23. D. A. Dikin, S. Stankovich, E. J. Zimney, R. D. Piner, G. H. B. Dommett, G. Evmenenko, S. T. Nguyen, and R. S. Ruoff, Nature, 448 (2007) 457.
24. J. T. Robinson, M. Zalalutdinov, J. W. Baldwin, F. K. Perkins, E. S. Snow, Z. Wei, P. E. Sheeshan, B. H. Houston, Nano Letters, 8 (2008) 3441.
25. J. T. Robinson, F. K. Perkins, E. S. Snow, Z. Wei, P. E. Sheeshan, Nano Letters, 8 (2008) 3137. 26. X. Zuo, S. He, D. Li, C. Peng, Q. Huang, S. Song, C. Fan, Langmuir, 26 (2010) 1936.
27. C. Jafta, F. Nkosi, L. Roux, M. Mathe, M. Kebede, K. Makgopa, Y. Song, D. Tong, M. Oyama, N. Manyala, S. Chen, K. Ozoemena, Electrochimica Acta, 110 (2013) 228.
28. A. H. C. Neto, F. Guinea, N. M. R. Peres, K. S. Novoselov, and A. K. Geim, Reviews of Modern Physics, 81 (2009) 109.
29. J. Xia, Q. Kuang, S. Yang, F. Xia, S. Wang, L. Guo, Scientific Reports 3 (2013) 2300 and references therein.
30. L. Wang, Y. Li, Z. Han, L. Chen, B. Qian, X. Jiang, J. Pinto, G. Yang, Journal of Materials Chemistry A, 1 (2013) 8385.
31. J. A. Roger, Y. G. Huang, Proceedings of the National Academy of Sciences USA, 106 (2009) 10875.
32. D. H. Kim, N. Lu, R. Ma, Y. S. Kim, R.H. Kim, S. Wang, J. Wu, S. M. Won, H. Tao, A. Islam et al. Science, 333 (2011) 838.
34. E. Frackowiak, F. Béguin, Carbon, 39 (2001) 937.
35. C. Peng, S. Zhang, D. Jewell, G. Z. Chen, Proceedings of National Sciences, 18 (2008) 177. 36. W. Sugimoto, K. Yokoshima, Y. Murakami, Y. Takasu, Electrochimica Acta, 52 (2006) 1742. 37. P. Simon, Y. Gogotsi, Nature Materials, 7 (2008) 845.
38. M. Mecklenburg, A. Schuchardt, Y. K. Mishra, S. Kaps, R. Adelung, A. Lotnyk, L. Kienle, K. Schulte, Advanced Materials, 24 (2012) 3486.
39. Y. Sun, X. Hu, W. Luo, Y. Huang, ACS Nano, 5 (2011) 7100.
40. Y. Liang, Y. Li, H. Wang, H. Dai, Journal of the American Chemical Society, 135 (2013) 2013. 41. J. Zhang, J. Jiang, X. S. Zhao, Journal of Physical Chemistry C, 115 (2011) 6448.
42. G. Aminoff, Zeitschrift für Kristallographie, 64 (1927) 475.
43. J. Attenburrow, A.F.B. Cameron, J.H. Chapman, R.M. Evans, B.A. Hems, A.B.A. Jansen, T. Walker, Journal of Chemical Society, 1094 (1952).
44. T. Nakajima, A. Mabuchi, R. Hagiwara, Carbon, 26 (1988) 357.
45. W. Scholz, H. P. Z. Boehm, Zeitschrift für anorganische und allgemeine Chemie, 369 (1969) 327. 46. J. Coraux, L. Marty, N. Bendiab, V. Bouchiat, Accounts of Chemical Research, 46 (2013) 2193. 47. Z. Xu, Z. Li, C. M. B. Holt, X. Tan, H. Wang, B. S. Amirkhiz, T. Stephenson, D. Mitlin, Journal
of Physical Chemical Letters, 3 (2012) 2928.
48. S Gupta, M. van Meveren, J. Jasinski, Journal of Electronics Materials, 44 (2015) 62 and references therein.
49. F. Xiao, Y. Xu, International Journal of Electrochemical Science, 7 (2012) 7440.
50. S.-M. Chen, R. Ramachandran, V. Mani, R. Saraswathi, International Journal of Electrochemical Science, 9 (2014) 4072.
51. W Hummers, R. J. Offeman, American Chemical Society, 80 (1958) 1339.
52. S. Park, J. An, R. J. Potts, A. Velamakanni, S. Murali, R. S. Ruoff, Carbon, 49 (2011) 3019. 53. D. C. Marcano, D. V. Kosynkin, J. M. Berlin, A. Sintskii, Z. Sun, A. Slesarev, L. B. Alemany, W.
Lu, J. M. Tour, ACS Nano, 4 (2010) 4806.
54. S. Greenwald, Acta Crystallographica, 6 (1953) 396.
55. W. L. Smith and A.D. Hobson, Acta Crystallographica, B29 (1953) 362.
56. K. Kobayashi, M. Tanimura, H. Nakai, A. Yoshimura, H. Yoshimura, K. Kojima, M. Tachibana, Journal of Applied Physics, 101 (2007) 94306.
57. M.S. Dresselhaus, G. Dresselhaus, R. Saito, A. Jorio, Physics Reports, 409 (2005) 47.
58. Y. Wu, P. Qiao, T. Chong, Z. Shen, Advanced Materials, 14 (2002) 64; Y. Wu, B. Yang, B. Zong, H. Sun, Z. Shen, Y. Feng, Journal of Materials Chemistry, 14 (2004) 469.
59. K. Shiji, M. Hiramatsu, A. Enomoto, M. Nakamura, H. Amano, M. Hori, Diamond and Related Materials, 14 (2005) 831.
60. S. Mori, T. Ueno, M. Suzuki, Diamond and Related Materials, 20 (2011) 1129.
61. L. G. Cançado, K. Takai, T. Enoki, M. Endo, Y.A. Kim, H. Mizusaki, A. Jorio, L.N. Coelho, R. Magalhaes-Paniago, M.A. Pimenta, Applied Physics Letters, 88 (2006) 163106.
62. B. R. Strohmeier, D. M. Hercules, Journal of Physical Chemistry, 88 (1988) 4923.
63. F. Kapteijn, A. D. Van Langeveld, J. A. Moulijn, A. Andreini, M. A. Vuurman, A. M. Turek, J-M. Jehng, I. E. Wachs, Journal of Catalysis, 150 (1994) 94.
64. D. Gosztola, M. J. Weaver, Journal of Electroanalytical Chemistry Interfacial Electrochemistry, 271 (1989) 141.
65. M. -C. Bernard, A. H.-Le Go, V. B. Thi, S. C.de Torresi, Journal of Electrochemical Society, 140 (1993) 3065.
66. C. Julien, M. Massot, R. Baddour-Hadjean, S. Franger, S. Bach, J. P. Pereira-Ramos, Solid State Ionics,159 (2003) 345.
67. I. Rusakova, T. O. Ely, C. Hofmann, D. P.-Centurion, C. S. Levin, N. J. Halas, A. Luttge, K. H. Whitmire, Chemistry of Materials, 19 (2007) 1369 (2649u).
69. Q. Lu, Y. Zhou, Journal of Power Sources, 196 (2011) 4088.
70. A. Celzard, F. Collas, J.F. Marêché, G. Furdin, I. Rey, Journal of Power Sources, 108 (2002) 153. 71. T. Tüken, B. Yazıcı, M. Erbil, Progress in Organic Coatings, 50 (2004) 115.
72. C. Tan, J. R. López, J.J. Parks, N.L. Ritzert, D. C. Ralph, H.D. Abruňa, ACS Nano, 6 (2012) 3070. 73. Y. Wang, K. Kececi, J. Velmurugan, M. V. Mirkin, Chemical Sciences, 4 (2013) 3606 and
references therein.
74. R.L. Mcreery, Chemical Reviews, 108 (2008) 2646.
75. F. Montilla, M. A. Cotarelo, E. Morallon, Journal of Materials Chemistry, 19 (2009) 305.