IUCr
J
ISSN 2052-2525CRYO
j
EM
Received 4 September 2017 Accepted 26 January 2018
Edited by S. Subramaniam, National Cancer Institute, USA
‡ These authors contributed equally.
Keywords:cryo-electron microscopy; cryo-EM; membrane proteins; electron-transport chain; malaria; cytochromebc1.
PDB references: cryo-EM structure of apo cytochromebc1, 6fo2 (EMDB-4288); cryo-EM
structure of cytochromebc1complex with
GSK932121, 6fo0 (EMDB-4286); cryo-EM structure of cytochromebc1complex with
SCR0911, 6fo6 (EMDB-4292); X-ray structure of bovine cytochromebc1complex with SCR0911,
5okd
Supporting information:this article has supporting information at www.iucrj.org
X-ray and cryo-EM structures of inhibitor-bound
cytochrome
bc
1complexes for structure-based drug
discovery
Kangsa Amporndanai,a‡ Rachel M. Johnson,b,c,d‡ Paul M. O’Neill,eColin W. G. Fishwick,c,dAlexander H. Jamson,b,cShaun Rawson,b,cStephen P. Muench,b,c* S. Samar Hasnaina* and Svetlana V. Antonyuka*
a
Molecular Biophysics Group, Institute of Integrative Biology, Faculty of Health and Life Sciences, University of Liverpool, Liverpool L69 7ZB, England,bSchool of Biomedical Sciences, Faculty of Biological Sciences, University of Leeds,
Leeds LS2 9JT, England,cAstbury Centre for Structural and Molecular Biology, University of Leeds, Leeds LS2 9JT,
England,dSchool of Chemistry, University of Leeds, Leeds LS2 9JT, England, andeDepartment of Chemistry, University of
Liverpool, Liverpool L69 7ZD, England. *Correspondence e-mail: [email protected], [email protected], [email protected]
Cytochromebc1, a dimeric multi-subunit electron-transport protein embedded
in the inner mitochondrial membrane, is a major drug target for the treatment and prevention of malaria and toxoplasmosis. Structural studies of cytochrome
bc1 from mammalian homologues co-crystallized with lead compounds have
underpinned structure-based drug design to develop compounds with higher potency and selectivity. However, owing to the limited amount of cytochrome
bc1 that may be available from parasites, all efforts have been focused on
homologous cytochrome bc1 complexes from mammalian species, which has
resulted in the failure of some drug candidates owing to toxicity in the host. Crystallographic studies of the native parasite proteins are not feasible owing to limited availability of the proteins. Here, it is demonstrated that cytochromebc1
is highly amenable to single-particle cryo-EM (which uses significantly less protein) by solving the apo and two inhibitor-bound structures to 4.1 A˚ resolution, revealing clear inhibitor density at the binding site. Therefore, cryo-EM is proposed as a viable alternative method for structure-based drug discovery using both host and parasite enzymes.
1. Introduction
Cytochrome bc1 (bc1) is an established drug target against
apicomplexan parasites, for examplePlasmodium falciparum
(Nixon et al., 2013) and Toxoplasma gondii (Doggett et al., 2012), which are the causative agents of malaria and toxo-plasmosis, respectively. According to data from the World Health Organization, the malaria infection rate has declined by 41% since the turn of the century, but 212 million cases still occurred globally in 2015 (World Health Organization, 2016).
T. gondiiis involved in ten million cases of foodborne illness annually. Moreover,T. gondiicauses congenital toxoplasmosis in190 000 infants per year following congenital transmission (Torgerson & Mastroiacovo, 2013). bc1, which exists as a
2004), ten subunits in yeast (Hunteet al., 2000) and 11 subunits in vertebrates (Xiaet al., 1997; Zhanget al., 1998). However, all bc1 complexes have a catalytic core containing three
essential subunits: cytochrome b, cytochrome c1 and the
Rieske iron–sulfur protein (Yang & Trumpower, 1986).bc1is
the central component of the mitochondrial electron-transfer chain which is responsible for the electron flow from ubiquinol to cytochrome c. This occursvia the oxidation of ubiquinol and the reduction of ubiquinone in a process called the Q cycle (Mitchell, 1976). The Q cycle takes place in the Qi and Qo
binding pockets within cytochromeb(Erecin´skaet al., 1972). Ubiquinol is oxidized to ubiquinone in the oxidative (Qo) site,
with two protons released into the intermembrane space, while ubiquinone binds to the reductive (Qi) site, where it is
reduced to ubiquinol and takes two protons from the matrix (Mitchell, 1976). This process allows proton translocation from the matrix space to the intermembrane space, thus increasing the electrochemical gradient across the membrane. The first bc1 structure from bovine mitochondria was
determined by X-ray crystallography at 3.0 A˚ resolution in 1997 (Xiaet al., 1997). Since then, numerous crystal structures of bc1 from various species have been reported, some with
improved resolution, for example bovine (2.1 A˚ ; Huanget al., 2005), chicken (2.7 A˚ ; Haoet al., 2012), yeast (1.9 A˚ ; Solmaz & Hunte, 2008) andRhodobacter(2.4 A˚ ; Esseret al., 2008), thus providing a more detailed understanding of the enzyme mechanism and structure–function relationship.
In apicomplexan parasites, oxidized ubiquinone from bc1
is used by dihydroorotate dehydrogenase (DHODH) to generate orotate, which is an essential intermediate in pyri-midine biosynthesis (Painteret al., 2007). Therefore, inhibition of bc1 leads to a collapse in pyrimidine production, causing
parasite death (Srivastava & Vaidya, 1999). Atovaquone is an analogue of ubiquinone that shows the ability to act as a competitive inhibitor at the Qosite of cytochromebc1(Fry &
Pudney, 1992). It has been widely used in combination with proguanil (known as Malarone) for the treatment of uncom-plicated malaria and its prevention (Shanks et al., 1998), and atovaquone can also be used to treat toxoplasmosis (Pearson
et al., 1999). Point mutations within the Qo site have been
found in atovaquone-resistant strains of malaria (Srivastavaet al., 1999) and toxoplasmosis (McFaddenet al., 2000) parasites, and structural analysis confirmed that these mutations signif-icantly reduce the antiparasite activity of atovaquone by preventing it from binding to the Qopocket (Birthet al., 2014).
Owing to the emergence of drug-resistant malaria, new compounds with improved potency and pharmacokinetic properties are urgently required for the eradication of malaria. Based on atovaquone, a number of lead compounds, such as 4(1H)-pyridones (Bueno et al., 2012) and 4(1H)-quinolones (Biaginiet al., 2012), have been designed to target the Qosite
of apicomplexan parasites (Supplementary Fig. S1). GSK932121 is a 4(1H)-pyridone lead compound that has been found to be highly active against atovaquone-resistant
P. falciparum(Buenoet al., 2012), but failed in a first human trial because of acute cardiotoxicity (Jime´nez-Dı´az et al., 2009). The root of this issue was exposed by the crystal
structure, which showed the unexpected binding of GSK932121 to the Qi site of bovinebc1 (Capperet al., 2015).
2-Pyridyl-quinolones have been developed for antimalarial activity, with a mechanism of dual inhibition of NADH:ubiquinone oxidoreductase (PfNDH2) and bc1 (Pidathala et al., 2012;
Biagini et al., 2012). One quinolone, SCR0911, has been reported to have improved solubility and metabolic stability, with nanomolar activity against P. falciparum (Charoen-sutthivarakulet al., 2015).
Structure-based drug-design (SBDD) programmes are reliant upon high-resolution structures of the target protein being solved (Renaud et al., 2016; Anderson, 2003). When complexed with their natural substrate or an inhibitor mole-cule, they can provide essential information for the design of new compounds which are highly selective for their target. Previously, this has been underpinned by X-ray crystallo-graphy; however, owing to the recent advances in single-particle cryo-electron microscopy (cryo-EM), an increasing number of high-resolution structures have been determined, therefore the technique has the potential to play a role in SBDD programmes (Rawson et al., 2017). For example, a 2.3 A˚ resolution cryo-EM structure of inhibitor-bound human p97 ATPase identified an allosteric inhibition mechanism that enables a structural basis for cancer drug design (Banerjeeet al., 2016). Cryo-EM is particularly useful for more challenging targets such as large macromolecular complexes, viruses and membrane proteins, as illustrated by the Fab–RV-B14 complex (2.26 A˚ resolution; Dong et al., 2017) and the membrane protein TRPV1 (2.9 A˚ resolution; Gaoet al., 2016). Membrane proteins remain challenging to study using X-ray crystallo-graphy as they face hurdles in overexpression, the quantity of highly purified protein produced and the quality of the crystals obtained (Carpenteret al., 2008). By requiring less sample for structural characterization (micrograms instead of milli-grams), cryo-EM can overcome these issues (Rawson et al., 2016). Moreover, the structure of the mammalian mitochon-drial respirasome supercomplex has recently been determined to an overall resolution of 4.0 A˚ , which highlights how the individual components in the electron-transport chain interact with one another, which had not previously been seen using X-ray crystallography (Wu et al., 2016; Guo et al., 2017).
Here, we present a novel, co-crystal structure of SCR0911-bound bovinebc1(at 3.1 A˚ resolution) and compare it with a
previously published crystal structure of the bovine bc1–
GSK932121 complex to discuss the differences in binding of these two different families of inhibitors. Moreover, we then show how cryo-EM has the potential to obtain structures at a similar resolution at which it is possible to see strong inhibitor density. By determining the cryo-EM structures of bovine apo
bc1, bc1–GSK932121 and bc1–SCR0911 to 4.1 and 4.4 A˚
resolution, we can, for the first time, compare the information obtained by cryo-EM and X-ray crystallography. The present study demonstrates that cryo-EM could allow us to study the
bc1 complex in systems where the production of sufficient
2. Methods
2.1. Preparation ofbc1
bc1 was purified as described previously (Smith, 1967).
Briefly, bovine mitochondria were isolated from fresh bovine hearts. The mitochondrial protein was quantified by the bicinchoninic acid (BCA) assay (Smithet al., 1985) and solu-bilized in 50 mMpotassium phosphate pH 7.5, 250 mMNaCl, 0.5 mM EDTA, 0.1 mM phenylmethylsulfonyl fluoride with the addition of 1 mg dodecylmaltoside (DDM) per 1 mg of mitochondrial protein. The suspension was centrifuged at 200 000g for 1 h at 4C. The supernatant was loaded onto a
50 ml DEAE Sepharose CL6B (GE Healthcare) column pre-equilibrated in and washed with three column volumes of 50 mMpotassium phosphate pH 7.5, 250 mMNaCl, 0.5 mM
EDTA, 0.01% DDM and then eluted using a linear gradient from 250 to 500 mM NaCl. bc1 fractions were pooled and
concentrated in a centrifugal ultrafilter (100 kDa molecular-weight cutoff). The protein was loaded onto a 120 ml Sepha-cryl S300 column (GE Healthcare) equilibrated in 20 mM
K-MOPS pH 7.2, 100 mMNaCl, 0.5 mMEDTA, 0.01% DDM and eluted at a flow rate of 0.5 ml min1. bc1fractions were
pooled and concentrated to a concentration of 40 mg ml1. Increasing amounts of PEG 4000 were added stepwise to precipitate bc1. The protein started precipitating at 2% PEG
4000, and pure cytochrome bc1 fractions were obtained
between 2.5 and 4% PEG 4000. Thebc1pellet was
resolubil-ized in 25 mM potassium phosphate pH 7.5, 100 mM NaCl, 0.5 mMEDTA, 0.015% DDM and then buffer-exchanged in a centrifugal ultrafilter to remove residual PEG before being adjusted to 5mM. 50 mM inhibitor stock solution in DMSO was added to a tenfold molar excess and incubated at 4C
overnight. The specific activity of cytochromecreduction was measured at 23C as described in Supplementary Table S1.
The specific activity of the purified bovine bc1 was
10.9mmol min1nM1at 23C.
2.2. X-ray crystallography
The inhibitor-bound bc1 was mixed with 1.6% 6-O-(N
-heptylcarbamoyl)-methyl--d-glucopyranoside (HECAMEG)
and concentrated to 40 mg ml1. The protein solution was mixed with an equal volume of reservoir solution (50 mM
potassium phosphate pH 6.8, 100 mMNaCl, 3 mMNaN3, 10–
13% PEG 4000). Crystals were grown by the hanging-drop method at 4C. Bipyramidal red crystals appeared amongst
the precipitate after 2–3 d. Single crystals were harvested in nylon loops, soaked stepwise in 50% ethylene glycol and 50 mM potassium phosphate pH 6.8, 100 mM NaCl, 3 mM
NaN3, 10–13% PEG 4000 and were then flash-cooled in liquid
nitrogen. The cooled crystals were tested for diffraction at 100 K using a home X-ray source at Barkla X-ray Laboratory, University of Liverpool. The best diffracting crystals were sent to the I03 beamline at Diamond Light Source, UK. A single data set was collected with a PILATUS3 6M detector from a crystal at 100 K using a wavelength of 0.98 A˚ . Data were processed usingiMosflm(Battyeet al., 2011) and scaled using
AIMLESS (Evans & Murshudov, 2013). The structure was
solved by molecular replacement with MOLREP (Vagin & Teplyakov, 2010) using thebc1structure with PDB code 4d6u
(Capper et al., 2015) as the starting model; cofactors and ligands were removed from the starting model. Jelly-body refinement was carried out withREFMAC5 (Murshudovet al., 2011) using theProSMARToption (Nicholls et al., 2014) to assist low-resolution refinement during the first cycles of the refinement. TLS parameters for each of ten chains were introduced and refined at the final stages of the refinement to reflect the different levels of flexibility of the chains. The model was manually rebuilt inCoot(Emsley & Cowtan, 2004) between refinement cycles. In addition to protein residues and the inhibitor molecule, lipids (cardiolipin and
1,2-dimyristoyl-sn-glycero-3-phosphocholine and 1,2-dihexanoyl-sn -glycero-3-phosphoethanolamine) were added to the model, along with DDM detergent, short fragments of PEG molecules and the phosphate groups of less defined lipids. The inhibitor mole-cules were produced by usingJLigand(Lebedevet al., 2012). Data collection and refinement statistics are shown in Supplementary Table S2.
2.3. Electron microscopy
Purified bovine cytochromebc1was buffer-exchanged into
25 mMTris pH 7.5, 100 mMNaCl, 0.5 mMEDTA and 0.015% DDM or 0.01% lauryl maltose neopentyl glycol (LMNG) by several dilutions in a centrifugal ultrafilter and adjusted to a concentration of 5 mg ml1. 3ml aliquots of the sample were applied onto Quantifoil Cu R1.2/1.3 holey carbon grids, which had been discharged for 30 s using a Pelco glow-discharge unit. An FEI Vitribot was used to blot the grids for 6 s (blot force 6) at 100% humidity and 4C before plunging
them into liquid ethane. The grids were loaded into an FEI Titan Krios transmission electron microscope (Astbury Biostructure Laboratory, University of Leeds) operating at 300 kV. Data were collected on a Falcon III direct electron detector operated in integrating mode. Automated data collection was performed using theEPU software, a defocus range of1 to4mm and a magnification of 75 000, which yielded a pixel size of 1.065 A˚ for the two inhibitor-bound data sets, which were collected with slightly different dose rates:
bc1–GSK932121 had a total dose of 75 e
A˚1 over a 1.5 s exposure, whereasbc1–SCR0911 had a total dose of 85 e
A˚1 over a 2 s exposure. The apobc1data set was collected on a
Titan Krios operating at 300 kV at the Astbury Biostructure Laboratory, which was fitted with a Gatan K2 electron detector. Automated data collection was carried out using the
EPU software, a defocus range of 1 to 4mm and a magnification of 75 000, which yielded a pixel size of 1.047 A˚ . The total dose was 44 eA˚1over a 12 s exposure, which was split into 20 frames (Supplementary Table S3). The apo, GSK932121-bound and SCR0911-bound bc1 data sets
were collected over 3 d, resulting in 3256, 8840 and 7893 micrographs, respectively.
2.4. Image processing
initial drift and CTF correction was carried out using
MotionCor2 (Zheng et al., 2017) and Gctf (Zhang, 2016), respectively. For each data set, an initial subset of 2000 particles were manually picked and extracted into a 200200 pixel box. These particles underwent two-dimensional classi-fication to generate two-dimensional references to facilitate auto-picking. The total numbers of particles picked for GSK932121-bound, SCR0911-bound and apo bc1 were
466 865, 629 258 and 260 201, respectively, with the apo data set having the smallest number of particles owing to it having the fewest number of micrographs. For each data set, the particles underwent an initial round of two-dimensional clas-sification, with those classes that displayed clear secondary-structure detail being taken forward to three-dimensional classification and split into three classes. Two of the three classes generated a high-quality bc1 reconstruction with
clearly visible secondary-structure information. The particles from these two classes were recombined to form the final data sets. For the apo bc1 data set 57 571 particles were
three-dimensionally refined usingC2 symmetry to 4.4 A˚ resolution. For the SCR0911 (114 130 particles) and GSK932121 (232 910 particles) inhibitor-bound data sets, a global resolution of 4.1 A˚ was obtained for each map. Further rounds of two- and three-dimensional classification were performed on all of the data sets, including using soft masks around different regions, including the Rieske domain and the transmembrane region, but the resolution and map quality did not improve. The starting model for the reconstructions was a crystal structure low-pass filtered to 60 A˚ . These models were also indepen-dently generatedab initioin the absence of a starting model using both RELION and cryoSPARC, resulting in an in-distinguishable map from that seeded with a low-pass filtered starting model (Scheres, 2012; Punjaniet al., 2017). Existing crystal structures were rigidly fitted into the maps using
UCSF Chimera(Pettersenet al., 2004) beforeMDFF(Trabuco
et al., 2010) was used to flexibly fit the model into the map. The inhibitor-bound models underwent model relaxation in
Rosetta before being refined using PHENIX (Adams et al., 2010). The maps were then inspected manually in Coot
(Emsley & Cowtan, 2004) and the model was corrected for any errors in refinement and the placement of residues (Supple-mentary Table S3). All figures were produced using
UCSF Chimera (Pettersen et al., 2004) or PyMOL (Schro¨-dinger).
2.5. Chemistry
The synthesis of SCR0911 was carried out as described by Charoensutthivarakulet al.(2015).
3. Results
3.1. Crystal structure of inhibitor-boundbc1
The quinolone SCR0911 was co-crystallized with bovinebc1
in space groupP6522 and data were collected to 3.1 A˚
reso-lution. The resulting structure showed clear and continuous density for most of the protein. The 6.4 kDa subunit 11 could not be resolved within the structure; it may be lost during purification or be too mobile to be resolved. bc1 structures
have been reported that show subunit 11 (Xia et al., 1997; Esser et al., 2004) and these were purified using ammonium sulfate precipitation protocols (Yu et al., 1974). For the structures reported here, the protein was purified by DEAE ion-exchange chromatography followed by gel filtration (Iwataet al., 1998) with the addition of a PEG fractionation step. Subunits 1, 2, 7, cytochromeband cytochromec1(chains A, B, F, C and D, respectively) are better defined in our structure, while the Rieske protein has weaker electron density and high temperature factors (theBfactors for chains
[image:4.610.44.567.501.675.2]EandIare given in Supplementary Table S2). ChainI, which
Figure 1
Crystal structure of the Qisite of bovinebc1with the SCR0911 inhibitor bound. (a) Cartoon representation of cytochromeb(blue) and the Rieske
protein (grey). The Qoand Qisites of the cytochromebsubunit are highlighted in black boxes. HaemsbLandbHare shown as blue sticks. OmitFoFc
electron density (in green) is contoured at the 3level, showing density for the SCR0911 inhibitor. (b) SCR0911 inhibitor bound in the Qisite. Residues
and inhibitor are shown as sticks. The 2FoFcelectron-density map is contoured at the 1level, with the inhibitor density coloured green and the
protein density in purple. Hydrogen bonds between inhibitors and residues are illustrated by black dashed lines. (c) The crystal structures of the Qisite in
bc1–SCR0911 (purple) andbc1–GSK932121 (grey) have been superimposed, showing the different binding modes of the pyridone (GSK932121, grey)
corresponds to the truncated N-terminal part of the Rieske protein, lacks the first 32 amino acids and adopts a confor-mation closer to that defined in the stigmatellin- and anti-mycin-bound bc1 structure (PDB entry 1ppj; Huang et al.,
2005). No additional density is seen within the Qo site,
suggesting that the quinolone solely inhibits the Qisite (Fig.
1a). There is additional density near haembH in the Qisite
which is not accommodated by the protein, and its size and shape allows unambiguous placement of the quinolone compound SCR0911. After refinement, the compound fits well into the 2Fo Fc electron-density map (Fig. 1b), and its
temperature factors of75 A˚2are consistent with those of the surrounding residues and are slightly higher than those of the haembHatoms (65 A˚
2
). The carbonyl and amine groups of the quinolone head group are placed close to His201 and Ser35 (at distances of 3.1 and 3.2 A˚ , respectively), allowing hydrogen-bond formation. The bicyclic tail of SCR0911 is placed away from haembHtowards the hydrophobic residue
Ile39. Crystal structure alignment of SCR0911-boundbc1with
the previously determined structure of GSK932121-boundbc1
(PDB entry 4d6u; Capperet al., 2015) illustrates that both the pyridone and quinolone compounds selectively inhibit the Qi
site but adopt different binding modes (Fig. 1c). There are minor conformation changes in the Qi-site residues affected by
the inhibitors. The pyridone head of GSK932121 is flipped over, forming hydrogen bonds between the carbonyl group and Ser35 and between the 2-hydroxymethyl substituent and His201 (Fig. 1c). For SCR0911, the head group of the quino-lone forms two hydrogen bonds to the carbonyl group of His201 and the amine group of Ser35. In other bovine bc1
crystal structures, His201, Ser35 and Asp228 make strong interactions with ubiquinol (Gaoet al., 2003) and Qiinhibitors,
including antimycin (Huang et al., 2005) and ascochlorin (Berryet al., 2010). The hydrogen bonds to Ser35 and His201 contribute to the ability of SCR0911 and GSK932121 to tightly occupy the Qi site and prevent the native substrate,
ubiqui-none, binding in the active site. The different binding inter-actions of the head group result in the diaryl ether tail of GSK932121 packing in a hydrophobic cavity defined by Met190 and Met194. The bicyclic tail of SCR0911 is packed in the hydrophobic pocket formed by Gly38 and Ile39, with its trifluoromethyl group directed towards Ala232 (Fig. 1c). These different binding modes of the pyridone and quinolone inhibitors might influence the binding affinity to the bovine enzyme. GSK932121 and SCR0911 were investigated for off-target inhibition of bovine bc1 (Supplementary Table S1).
Single-point bc1 inhibition assays showed that SCR0911 has
significantly decreased binding for mammalian target than GSK932121 at 100 nM: 9% inhibition compared with 64%. The binding behaviour of SCR0911 in the bovine Qisite could
suggest a direction for the design of future lead compounds with low affinity for mammalianbc1.
Although bovine and human cytochrome b show 80% conservation, the conservation between human and
P. falciparumis only 40%. Surprisingly, the Qosite is the most
conserved region, with 65% conservation. The N-terminus of the parasite cytochromeb, which constitutes half of the Qisite,
is four residues shorter and has 39% conservation in comparison with mammalian homologues, leading to consid-erable differences in the Qibinding site (Supplementary Fig.
S2), which may offer a way to rationally optimize lead compounds to give more selective inhibitors of the parasite enzyme. In the case of GSK932121, Met190 and Met194 are replaced by Leu and Phe, respectively, in P. falciparum bc1,
which could be beneficial for the design of pyridone deriva-tives. Interestingly, Ser35, which forms a hydrogen bond to the quinolone molecule, is replaced by a bulky Phe residue that would form a steric clash with SCR0911 in the parasite enzyme if the binding modes were the same. Therefore, to bind within
P. falciparum bc1 SCR0911 must adopt a different binding
mode in the parasite enzyme to the mode observed in the bovine crystal structure. Therefore, it is challenging to work on improving the selectivity of the inhibitor without the experi-mental structure of parasitebc1.
3.2. Structures of apo and inhibitor-boundbc1from cryo-EM
We used cryo-EM to study the structure ofbc1in complex
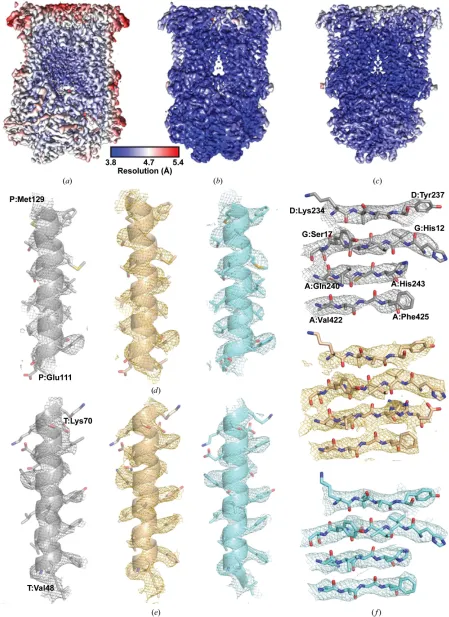
with inhibitors from two different families with a pyridone (GSK932121; Bueno et al., 2012) or quinolone (SCR0911; Charoensutthivarakul et al., 2015) core, along with the apo complex. The apo data set was resolved to a global resolution of 4.4 A˚ and the two inhibitor-bound complexes were both determined to 4.1 A˚ resolution as calculated by Fourier shell correlation (FSC = 0.143; Scheres & Chen, 2012; Supple-mentary Fig. S2). For all three maps the local resolution was calculated usingRELION(Figs. 2a, 2band 2c), showing that the core of the complex was resolved to a higher resolution than the global average (4.2 A˚ for the apobc1map and 3.8–
4.0 A˚ for the inhibitor-bound maps). Moreover, the poorest resolved region in each map was consistently the Rieske protein, which was at6 A˚ resolution in all maps. The iron– sulfur cluster within this region is responsible for bifurcated electron transfer from oxidation of ubiquinol in the Qosite to
cytochromec1in abc1catalytic cycle. Previously, it had been
reported that this domain is mobile and can exist in different conformations (Iwataet al., 1998; Gaoet al., 2003; Esseret al., 2004, 2006). The other haem groups in the cryo-EM structure ofbc1are the strongest features within the map. However, our
inability to resolve the iron–sulfur cluster, which should also be a strong feature, leads us to conclude that it is mobile and adopts different positions. Attempts to separate different conformational states of the iron–sulfur cluster using soft masks around the region were unsuccessful. This could suggest that rather than being in distinct conformations, the Rieske protein is more flexible but does not adopt multiple positions. The resolution achieved allowed the modelling of-helices and the location of haem groups and density that could be attributed to -sheets. Moreover, there is density for the larger, aliphatic/aromatic side chains in the transmembrane region that can be modelled into the map (Figs. 2d, 2eand 2f). At this resolution,de novostructure building is possible using
Figure 2
The bovinebc1structures determined by cryo-EM. Local resolution maps, coloured on the same scale, of (a) apobc1, (b)bc1–GSK932121 and (c)bc1–
available, these were docked into the corresponding cryo-EM maps as an initial starting point, as thede novobuilding ofbc1
would have been a significant undertaking. The docked crystal structures were initially subjected to flexible fitting inMDFF
to identify any large changes at the secondary-structure level, after which PHENIXwas used to refine the side-chain posi-tions (Adams et al., 2010). The maps were then visually inspected to look for any areas of poor fit and the residues were manually fitted, with the resulting structures being re-refined inPHENIX. It is important to note that as we have the phase information in the cryo-EM map, at no point in the refinement procedure was the map modified or biased by the fitted structure. Analysis of the resulting structures showed there were no significant differences between the different cryo-EM-derived structures and those solved by X-ray crys-tallography, except for the Rieske domain (described below). The Qi site in all three models has been analysed to
determine whether inhibitor density can be seen (Fig. 3). In the apo structure there is weak density for the natural substrate, ubiquinone, at the Qisite, which is consistent with
several studies that found ubiquinone bound to the Qi site
(Huang et al., 2005; Hao et al., 2012). Owing to the lower resolution of the apo map, the side chains of the neighbouring amino-acid residues could not be unambiguously modelled into the density for all residues; however, many could be placed into their approximate positions (Figs. 2 and 3). For the two inhibitor-bound structures, there is clear inhibitor density at the Qisite which does not appear at the Qosite, supporting
that these are selective Qisite inhibitors. The strongest
inhi-bitor density occurs in the bc1–SCR0911 map, where the
density for the compound is strong and comparable to that of the neighbouring side chains (Fig. 3c). The density within the Qisite suggests that SCR0911 adopts a conformation which is
consistent with the crystal structure. The quinolone head of SCR0911 is placed between residues His201 and Phe220, and
the biaryl tail further extends into the hydrophobic region of Ile39 and Ala232. In contrast, the density in the bc1–
GSK932121 map is strong for the pyridone head group but is weaker at the tail of the molecule. The density also suggests that there could be two binding poses of the compound caused by rotation around the oxygen–carbon bond (as discussed in more detail below). The Qisites of the two inhibitor-bound
cryo-EM structures have been compared, showing a strong agreement in the secondary structure of the protein. At 4.1 A˚ resolution it is difficult to detect subtle changes in the posi-tions of the amino-acid side chains which would result from inhibitor binding. However, gross changes in the side-chain position can be detected; for example, His201 shifts in position between the two maps (Fig. 5a). For SCR0911, His201 is well defined and is in a position consistent with hydrogen-bond formation with the inhibitor, whereas the density for GSK932121 suggests that there is no hydrogen-bond inter-action with His201 and the density is more poorly defined (Fig. 3). Comparisons of the Qisite of apobc1and
inhibitor-bound bovinebc1in the cryo-EM structures shows that there
is no difference in the position of the-helices which surround the active site, consistent with the observations from crystal studies that show that no gross structural changes accompany inhibitor binding.
3.3. Comparison of cryo-EM and X-ray crystallographic structures
Owing to a lack of confidence in some side-chain positions, we compared the main-chain Cpositions of the cryo-EM and crystal structures of thebc1–SCR0911 complex, which resulted
[image:7.610.53.565.506.667.2]in an r.m.s.d. of 0.5 A˚ . However, it should be noted that the structure, especially in poorly defined areas of the map, could still be biased by the original starting model used. There is very high agreement between the protein core and
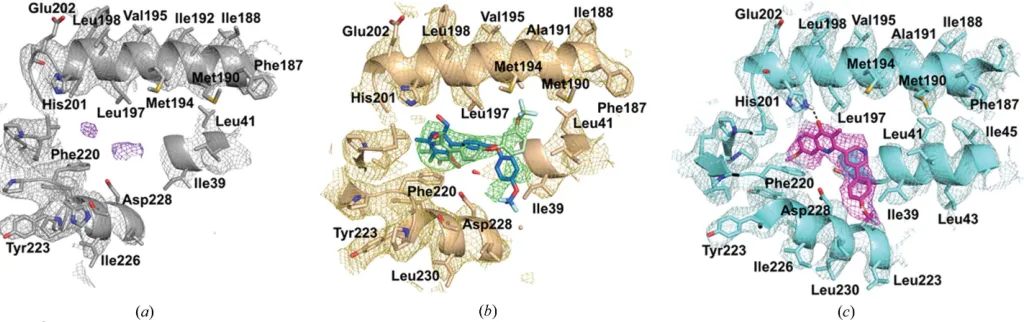
Figure 3
Analysis of the Qisite in the three different cryo-EM maps with the density contoured at 3. (a) The Qisite in the apobc1cryo-EM map shows minimal
density (purple mesh) which does not correspond to any side chains or the haembLgroup, suggesting noise within the map or that the natural substrate
ubiquinone is bound in a small number ofbc1molecules. (b) The Qisite in the cryo-EM map ofbc1–GSK932121. The inhibitor density (green) suggests
there are two modes of inhibitor binding, accompanied by rotation around the oxygen–carbon bond. The binding pose shown in green agrees with the crystal structure, with the trifluoromethyl group pointing towards Met194. There is additional density which suggests that the trifluoromethoxyphenyl group could be rotated and point towards Asp228, revealing an additional mode of binding (shown in blue). (c) The Qisite in the cryo-EM map ofbc1–
transmembrane domains. However, there are significant differences in the mobile Rieske protein in the soluble region, where the Cr.m.s.d. value is greater than 2 A˚ (Fig. 4). This observation correlates with the crystal structures of apo, natural substrate-bound and Qo inhibitor-bound bovinebc1,
which capture different conformations of the Rieske protein and suggest that the swivel motion of the Rieske protein moves the 2S cluster closer to either the Qosite or the
cyto-chrome c1 haem to allow the transfer of one electron to
cytochrome c1 and one electron to the Qi site (Esseret al.,
2006). A number of different crystal structures of bc1 have
shown a range of positions for the Rieske protein (Iwataet al., 1998; Gaoet al., 2003; Esseret al., 2004, 2006; Xiaet al., 2013; Supplementary Fig. S4). The position of this protein can be influenced by the space group in which the protein crystallizes and the corresponding crystal contacts that are made (Supplementary Fig. S4a), and the nature of the inhibitor bound in the Qosite (Supplementary Fig. S4b). In the case of
the cryo-EM structures we have removed the influence of the crystal lattice and therefore the Rieske domain is not being influenced by the crystal contacts, and we note that the domain does not adopt a large number of defined states, although its resolution is significantly lower than that of the main body of the protein, indicating a degree of flexibility (Fig. 4c). In the cleaved N-terminal part of the Rieske protein (chain I resi-dues 1–78), we can only see two -sheets assigned as the C-terminal part of the fragment in the crystal structure.
Analysis of the Qi site of bc1–SCR0911 shows that the
ligand adopts a very similar position in the cryo-EM-derived and X-ray-derived structures (Fig. 5). In both structures the ligand can form hydrogen bonds to His201 and Ser35 on the neighbouring helix. The Qi site amino acids adopt similar
positions in both structures, with an average Cr.m.s.d. value of 1.46 A˚ ; there is a clear overlap of the-helices. There are minor differences in the positions of the amino-acid side chains, such as Phe220; however, this could be owing to the difference in the resolutions of the two maps.
Examination of the Qisite in thebc1–GSK932121 cryo-EM
map suggested that the inhibitor binds in two different conformations (Fig. 5b). Both binding modes have the pyri-done head placed between haembHand His201 and have the
[image:8.610.120.490.404.695.2]diaryl tail group extending out of the hydrophobic channel away from the haem group. The difference in the binding conformations occurs at the 4-trifluoromethoxyphenyl ring of the molecule, as there is rotation around the C—O bond which results in two different binding positions (Fig. 3b). Pyridone binding pose 1 has the trifluoromethoxy group from the second aromatic ring pointing towards Met194. In comparison, the cryo-EM structure has identified pyridone binding pose 2, which shows the aromatic ring facing in the opposite direction with the trifluoromethoxy group towards Asp228. Compar-isons with the crystal structure reveal that the GSK932121 ligand adopts one binding position. As the additional binding pose was not identified using crystallography, cryo-EM could
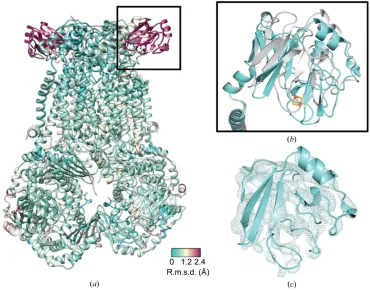
Figure 4
Global comparison between cryo-EM-derived and X-ray-derived SCR0911-bound structures. (a) The cryo-EM and X-raybc1–SCR0911 structures have
been overlaid and the crystal structure is coloured according to the calculated Cr.m.s.d. value (low coloured cyan and high coloured maroon). The main difference (r.m.s.d. of >2 A˚ ) occurs for the Rieske domain (in the black square), which is known to be mobile during the catalytic cycle. (b) An overlay of the Rieske domains in the cryo-EM-derived (cyan) and X-ray-derived (grey)bc1–SCR0911 structures. (c) The cryo-EM-derived map for thebc1–
provide unique insights into alternative modes of binding and occupancy of inhibitors.
3.4. Comparisons of isolatedbc1with the full respirasome
complex
The structure of the porcine respiratory supercomplex (I1III3IV1) has been determined at 4.0 A˚ resolution (Wuet al.,
2016). After masking of the individual complexes the global resolution of the map for the bc1structure was improved to
3.6 A˚ , which could be owing to the protein being stabilized by its interactions with the other components in the electron-transport chain. In the full complex, no density was present at either the Qior Qoinhibitor-binding sites, which suggests that
there is no natural substrate present in this map.
Our cryo-EM-derived structure of isolated bc1–SCR0911
was compared with thebc1map which was extracted from the
supercomplex cryo-EM map, with the largest differences being found in the iron–sulfur cluster (Supplementary Fig. S5). The crystal structure with the SCR0911 inhibitor bound was also compared with the full respirasome complex. Interestingly, the positions of the Rieske domains were similar when these two models were compared (Supplementary Fig. S5b). This could be a feature of the higher resolution of the two maps. More-over, electron density is present in the supercomplex for subunit 11 inbc1, which is not seen in either the X-ray or
cryo-EM structures of the isolated complexes owing to it being lost during the purification procedure (Supplementary Fig. S5c).
4. Discussion and outlook
New medicines to treat malaria and other apicomplexan diseases are urgently needed to deal with the growing burden that these diseases place on many developing countries. A promising approach to deal with this problem is through the inhibition of bc1, which has been shown to be a validated
target against both Plasmodium and Toxoplasma, but problems associated with drug resistance and toxicity must be addressed. To achieve this, highly potent inhibitors have been developed to target the Qisite. The inhibitor-binding mode
has been shown for some inhibitors by structural studies of the bovine enzyme using X-ray crystallography.
The crystal structures reported here and previously have been invaluable in providing insights into further inhibitor-design and safety-profile improvement. However, a significant limitation is the reliance upon abc1homologue which can be
extracted in the large milligram quantities required for crys-tallization, with a concentration of 40 mg ml1 often being required to obtain high-quality crystals. This prohibits the use of nativebc1of parasite origin for crystallography as it cannot
be obtained in the high quantities required for crystallization. Subsequently, alternative methods are required to solve the structure of parasite bc1 at a resolution where inhibitor
binding can be seen but where the required level of protein is significantly reduced. To this end, we provide the first single-particle cryo-EM reconstructions for bovine bc1 in its apo
form and in complex with two inhibitors to show proof of principle. The resolution of the cryo-EM map shows side-chain density for bulky amino-acid residues but, without the crystal structure to act as a guide. However, it would have been a challenge to build the whole structurede novo. Despite this, we can unambiguously identify the inhibitor-binding site in the cryo-EM maps, and using chemical constraints such as the presence of hydrogen bonds and/orin silico docking it is possible to gain insights into the mode of binding. Moreover, obtaining cryo-EM structures allows the protein to be solved in its native state in the absence of any possible artefacts owing to crystal contacts.
[image:9.610.51.563.71.227.2]An advantage of X-ray crystallography over cryo-EM is the resolution which is routinely achieved (often <2.5 A˚ ), but the timescale from purified protein through crystallization to structure determination remains unpredictable. This is even
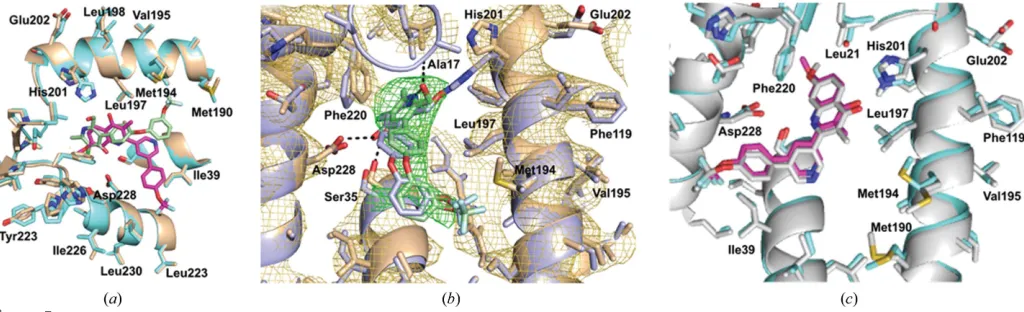
Figure 5
Comparisons of the Qisite. (a) The cryo-EM structures ofbc1–SCR0911 (cyan) andbc1–GSK932121 (gold) overlaid. The SCR0911 inhibitor is coloured
green and the GSK932121 inhibitor magenta. The overlay of the two structures shows there is no difference in the secondary-structure positions in the two maps and only minor differences in the positions of the amino-acid residues. The largest difference occurs for His201, which forms a hydrogen bond to SCR0911 but not GSK932121. (b) An overlay of the Qisite ofbc1–GSK932121 in the cryo-EM (gold) and X-ray (purple) models. The density in gold
corresponds to the EM map, which shows a difference in the position of His201 compared with the X-ray structure. (c) An overlay of the Qisite ofbc1–
more challenging for membrane proteins, with crystallization remaining one of the most unpredictable steps and often being a bottleneck for many projects. For systems such asbc1 that
have been established in a laboratory, crystals can be grown within5 d after protein purification ready for data collection at an advanced synchrotron crystallographic beamline, with data collection, processing and initial model fitting taking place in a single day. The current example demonstrates that cryo-EM can be conducted in a similar timeframe but without the uncertainty of obtaining diffraction-quality crystals or requiring a large amount of purified protein. After obtaining a purified bovinebc1sample, the time taken from preparation of
the cryo-grids to obtaining a three-dimensional reconstruction of the sample was less than 10 d. This timescale includes72 h of data collection and a week of data processing, including the initial motion-correction and classification steps. Although the crystallization step is removed, it is important to note that grid preparation and optimization is not without its own chal-lenges. Given the rapid development in cryo-EM, particularly in detector technology and image-processing speeds, as well as the greater number of centres with high-quality microscopes, this timescale is expected to become even shorter, making the rapid screening of complex systems via cryo-EM a viable alternative.
For systems where large quantities of purified protein can be obtained, X-ray crystallography is likely to remain the gold-standard approach for SBDD. For instance, in this study bovinebc1was purified and the resulting crystals diffracted to 3.1 A˚ resolution, which allowed the mode of inhibitor binding to be established. However, by producing more selective inhibitors, which no longer have high affinity for the model system used for structural studies, alternative approa-ches may be required. No structural data for thebc1complex
from P. falciparum are available, thus hindering the current SBDD programmes, which are based upon mammalian homology models. Crystallography is not a viable route owing to the large quantities of protein that are required and the uncertainty that is imposed by crystallization. Based on the current study, we propose that cryo-EM is a viable route for studying large membrane-protein complexes from both the host and, by analogy, the parasite, and their interactions with bound inhibitors.
Acknowledgements
The authors would like to thank Diamond Light Source for beamtime (proposal MX11740) and the staff of the I03 beamline that contributed to the crystallographic results. We thank the support staff at Astbury Biostructure Laboratory for their kind help, particularly Rebecca Thompson.
Funding information
The electron microscopy was performed in the Astbury Biostructure Laboratory funded by the University of Leeds and the Wellcome Trust (108466/Z/15/Z). KA thanks the University of Liverpool and Mahidol University, Thailand for financial support under the Mahidol–Liverpool PhD
Scholarship. RMJ thanks the Wellcome Trust for PhD studentship support (109158/B/15/Z).
References
Adams, P. D.et al.(2010).Acta Cryst.D66, 213–221. Anderson, A. C. (2003).Chem. Biol.10, 787–797. Banerjee, S.et al.(2016).Science,351, 871–875.
Battye, T. G. G., Kontogiannis, L., Johnson, O., Powell, H. R. & Leslie, A. G. W. (2011).Acta Cryst.D67, 271–281.
Berry, E. A., Huang, L.-S., Lee, D.-W., Daldal, F., Nagai, K. & Minagawa, N. (2010).Biochim. Biophys. Acta,1797, 360–370. Berry, E. A., Huang, L.-S., Saechao, L. K., Pon, N. G.,
Valkova-Valchanova, M. & Daldal, F. (2004).Photosynth. Res.81, 251–275. Biagini, G. A.et al.(2012).Proc. Natl Acad. Sci. USA,109, 8298–8303. Birth, D., Kao, W.-C. & Hunte, C. (2014).Nat. Commun.5, 4029. Bueno, J. M., Herreros, E., Angulo-Barturen, I., Ferrer, S., Fiandor,
J. M., Gamo, F. J., Gargallo-Viola, D. & Derimanov, G. (2012).
Future Med. Chem.4, 2311–2323.
Capper, M. J., O’Neill, P. M., Fisher, N., Strange, R. W., Moss, D., Ward, S. A., Berry, N. G., Lawrenson, A. S., Hasnain, S. S., Biagini, G. & Antonyuk, S. V. (2015).Proc. Natl Acad. Sci. USA,112, 755– 760.
Carpenter, E. P., Beis, K., Cameron, A. D. & Iwata, S. (2008).Curr. Opin. Struct. Biol.18, 581–586.
Charoensutthivarakul, S., Hong, W. D., Leung, S. C., Gibbons, P. D., Bedingfield, P. T. P., Nixon, G. L., Lawrenson, A. S., Berry, N. G., Ward, S. A., Biagini, G. A. & O’Neill, P. M. (2015).Med. Chem. Commun.6, 1252–1259.
Doggett, J. S., Nilsen, A., Forquer, I., Wegmann, K. W., Jones-Brando, L., Yolken, R. H., Bordo´n, C., Charman, S. A., Katneni, K., Schultz, T., Burrows, J. N., Hinrichs, D. J., Meunier, B., Carruthers, V. B. & Riscoe, M. K. (2012).Proc. Natl Acad. Sci. USA,109, 15936–15941. Dong, Y., Liu, Y., Jiang, W., Smith, T. J., Xu, Z. & Rossmann, M. G.
(2017).Proc. Natl Acad. Sci. USA,114, 8017–8022. Emsley, P. & Cowtan, K. (2004).Acta Cryst.D60, 2126–2132. Erecin´ska, M., Chance, B., Wilson, D. F. & Dutton, P. L. (1972).Proc.
Natl Acad. Sci. USA,69, 50–54.
Esser, L., Elberry, M., Zhou, F., Yu, C.-A., Yu, L. & Xia, D. (2008).J. Biol. Chem.283, 2846–2857.
Esser, L., Gong, X., Yang, S., Yu, L., Yu, C.-A. & Xia, D. (2006).Proc. Natl Acad. Sci. USA,103, 13045–13050.
Esser, L., Quinn, B., Li, Y. F., Zhang, M., Elberry, M., Yu, L., Yu, C.-A. & Xia, D. (2004).J. Mol. Biol.341, 281–302.
Evans, P. R. & Murshudov, G. N. (2013).Acta Cryst.D69, 1204–1214. Fry, M. & Pudney, M. (1992).Biochem. Pharmacol.43, 1545–1553. Gao, Y., Cao, E., Julius, D. & Cheng, Y. (2016).Nature (London),534,
347–351.
Gao, X., Wen, X., Esser, L., Quinn, B., Yu, L., Yu, C.-A. & Xia, D. (2003).Biochemistry,42, 9067–9080.
Guo, R., Zong, S., Wu, M., Gu, J. & Yang, M. (2017).Cell,170, 1247– 1257.e12.
Hao, G.-F., Wang, F., Li, H., Zhu, X.-L., Yang, W.-C., Huang, L.-S., Wu, J.-W., Berry, E. A. & Yang, G.-F. (2012).J. Am. Chem. Soc.134, 11168–11176.
Huang, L.-S., Cobessi, D., Tung, E. Y. & Berry, E. A. (2005).J. Mol. Biol.351, 573–597.
Hunte, C., Koepke, J., Lange, C., Rossmanith, T. & Michel, H. (2000).
Structure,8, 669–684.
Iwata, S., Lee, J. W., Okada, K., Lee, J. K., Iwata, M., Rasmussen, B., Link, T. A., Ramaswamy, S. & Jap, B. K. (1998).Science,281, 64–71. James, Z. M., Borst, A. J., Haitin, Y., Frenz, B., DiMaio, F., Zagotta, W. N. & Veesler, D. (2017).Proc. Natl Acad. Sci. USA,114, 4430– 4435.
Lebedev, A. A., Young, P., Isupov, M. N., Moroz, O. V., Vagin, A. A. & Murshudov, G. N. (2012).Acta Cryst.D68, 431–440.
McFadden, D. C., Tomavo, S., Berry, E. A. & Boothroyd, J. C. (2000).
Mol. Biochem. Parasitol.108, 1–12.
Mitchell, P. (1976).J. Theor. Biol.62, 327–367.
Murshudov, G. N., Skuba´k, P., Lebedev, A. A., Pannu, N. S., Steiner, R. A., Nicholls, R. A., Winn, M. D., Long, F. & Vagin, A. A. (2011).
Acta Cryst.D67, 355–367.
Nicholls, R. A., Fischer, M., McNicholas, S. & Murshudov, G. N. (2014).Acta Cryst.D70, 2487–2499.
Nixon, G. L., Pidathala, C., Shone, A. E., Antoine, T., Fisher, N., O’Neill, P. M., Ward, S. & Biagini, G. A. (2013).Future Med. Chem.
5, 1573–1591.
Painter, H. J., Morrisey, J. M., Mather, M. W. & Vaidya, A. B. (2007).
Nature (London),446, 88–91.
Pearson, P. A., Piracha, A. R., Sen, H. A. & Jaffe, G. J. (1999).
Ophthalmology,106, 148–153.
Pettersen, E. F., Goddard, T. D., Huang, C. C., Couch, G. S., Greenblatt, D. M., Meng, E. C. & Ferrin, T. E. (2004).J. Comput. Chem.25, 1605–1612.
Pidathala, C.et al.(2012).J. Med. Chem.55, 1831–1843.
Punjani, A., Rubinstein, J. L., Fleet, D. J. & Brubaker, M. A. (2017).
Nature Methods,14, 290–296.
Rawson, S., Davies, S., Lippiat, J. D. & Muench, S. P. (2016).Mol. Membr. Biol.33, 12–22.
Rawson, S., McPhillie, M. J., Johnson, R. M., Fishwick, C. W. G. & Muench, S. P. (2017).Acta Cryst.D73, 534–540.
Renaud, J., Chung, C., Danielson, U. H., Egner, U., Hennig, M., Hubbard, R. E. & Nar, H. (2016).Nat. Rev. Drug Discov.15, 679– 698.
Scha¨gger, H., Link, T. A., Engel, W. D. & von Jagow, G. (1986).
Methods Enzymol.126, 224–237.
Scheres, S. H. W. (2012).J. Struct. Biol.180, 519–530.
Scheres, S. H. W. & Chen, S. (2012).Nat. Methods,9, 853–854.
Shanks, G. D., Gordon, D. M., Klotz, F. W., Aleman, G. M., Oloo, A. J., Sadie, D. & Scott, T. R. (1998).Clin. Infect. Dis.27, 494–499. Smith, A. L. (1967).Methods Enzymol.10, 81–86.
Smith, P. K., Krohn, R. I., Hermanson, G. T., Mallia, A. K., Gartner, F. H., Provenzano, M. D., Fujimoto, E. K., Goeke, N. M., Olson, B. J. & Klenk, D. C. (1985).Anal. Biochem.150, 76–85.
Solmaz, S. R. N. & Hunte, C. (2008).J. Biol. Chem.283, 17542–17549. Srivastava, I. K., Morrisey, J. M., Darrouzet, E., Daldal, F. & Vaidya,
A. B. (1999).Mol. Microbiol.33, 704–711.
Srivastava, I. K. & Vaidya, A. B. (1999). Antimicrob. Agents Chemother.43, 1334–1339.
Torgerson, P. R. & Mastroiacovo, P. (2013).Bull. World Health Organ.
91, 501–508.
Trabuco, L. G., Villa, E., Schreiner, E., Harrison, C. B. & Schulten, K. (2010).Methods,49, 174–180.
Vagin, A. & Teplyakov, A. (2010).Acta Cryst.D66, 22–25.
World Health Organization (2016). World Malaria Report 2016. Geneva: World Health Organization. http://www.who.int/malaria/ publications/world-malaria-report-2016/report/en/.
Wu, M., Gu, J., Guo, R., Huang, Y. & Yang, M. (2016).Cell,167, 1598– 1609.
Xia, D., Esser, L., Tang, W. K., Zhou, F., Zhou, Y., Yu, L. & Yu, C. A. (2013).Biochim. Biophys. Acta,1827, 1278–1294.
Xia, D., Yu, C.-A., Kim, H., Xia, J.-Z., Kachurin, A. M., Zhang, L., Yu, L. & Deisenhofer, J. (1997).Science,277, 60–66.
Yang, X. & Trumpower, B. L. (1986). J. Biol. Chem. 261, 12282– 12289.
Yu, C. A., Yu, L. & King, T. E. (1974).J. Biol. Chem.249, 4905–4910. Zhang, K. (2016).J. Struct. Biol.193, 1–12.
Zhang, Z., Huang, L., Shulmeister, V. M., Chi, Y.-I., Kim, K. K., Hung, L.-W., Crofts, A. R., Berry, E. A. & Kim, S.-H. (1998). Nature (London),392, 677–684.