Int. J. Electrochem. Sci., 10 (2015) 9395 - 9407
International Journal of
ELECTROCHEMICAL
SCIENCE
www.electrochemsci.org
Effect of Heat Treatment on Corrosion Behaviour of
Magnesium Alloy Mg10Gd1Eu1Zn0.2Zr in 1wt% NaCl Solution
for Biomaterial Application
Naima Zidane1, Abdelaziz Ait Addi1, Rachid Ait Akbour1, Jamaâ Douch1, Ravandra Nath Singh2, Mohamed Hamdani1,*
1Laboratoire de Chimie Physique, Faculté des Sciences, Université Ibn Zohr, B.P. 8106 Cité Dakhla,
Agadir, Maroc.
2
Department of Chemistry, Faculty of Science, Banaras Hindu University,Varanasi 221005,India
*
E-mail: hamdani.mohamed@gmail.com
Received: 30 July 2015 / Accepted: 25 August 2015 / Published: 30 September 2015
The influence of heat treatment on the corrosion resistance of magnesium alloy Mg10Gd1Eu1Zn0.2Zr in 1wt% chloride solution has been studied by weight loss, potentiodynamic polarization, electrochemical impedance spectroscopy (EIS), X-ray diffraction and scanning electron microscopy (SEM). The study indicates that the corrosion rate of magnesium alloy is quite sensitive to the heat treatment. The Open circuit potential (OCP), the corrosion potential (Ecorr), the charge transfer
resistance (Rct), and the corrosion resistance increased while the corrosion current density (Icorr) and hence the corrosion rate decreased in the following order F, T4 and T6. The X-ray diffraction (XRD) has shown well crystallized Mg(OH)2 patterns beneath the Mg alloy immersed in chloride solution.
The morphology of the alloy after immersion in the chloride solution presents a film of corrosion products with cracks and pits which depend on undergoing heat treatment.
Keywords: Mg10Gd1Eu1Zn0.2Zr, Mg Alloy, Biomaterial Implant, Heat treatment, Polarization measurement, EIS, Corrosion rate, X-ray diffraction, Scanning electron microscopy.
1. INTRODUCTION
of the elements. Also, desorption of the implant should match the rate of healing process of the tissue [1, 2]. In this manner, the clinical function can be afforded by the implant and at the end, it may disappear when the tissue has healed sufficiently [3].
Recently, several reviews have comprehensively addressed the development of biodegradable magnesium alloys as ‘‘smart’’ implants of magnesium based alloys for orthopedic applications [4-13]. In fact, the biodegradability, the biocompatibility and the mechanical properties of these materials make them a good candidate for clinical purpose [14, 15]. Besides, their corrosion in physiological conditions allows avoiding another chirurgical intervention after bone healing. However, the corrosion of magnesium alloys, when used as implant, undergoes hydrogen gas evolution underneath the skin and pH change [15, 16]. In addition, the extensive use of Mg-based alloys is still impeded mainly due to their high corrosion rates and significant losses in mechanical properties. It is, therefore, challenging to increase the low corrosion resistance of these materials. Alloying metals are known [17] to impart high corrosion protection to magnesium by lowering its corrosion due to the formation of protective thin oxide film on its surface [17]. Also, coatings have been employed to achieve the surface protection of the surface of Mg alloys by various conventional techniques [18]. This modification of the surface forms a barrier between the material and its environment which hinders aggressive ions to reach the metallic surface and thereby protects the alloy surface from corrosion. However, despite all these efforts, the extensive use of Mg-based alloys is still hunted mainly because of their high corrosion rates and considerable losses in mechanical properties. Despite many efforts devoted to solve the technical problems, commercial implants are not yet available [19].
In past years, corrosion of magnesium alloyed with various rare earth (RE) elements was studied in various media. Birbilis et al. [20] prepared binary alloys of Mg with a RE element (Ce, La or Nd) and studied their corrosion behavior in 0.1M sodium chloride. The study revealed the deleterious effect of RE additions on the corrosion performance of magnesium. RE alloying elements improve the cathodic reaction kinetics and thereby, markedly enhance the corrosion rate. It was recently reported that cast Mg–3X alloys (X = gadolinium Gd, yttrium Y, scandium Sc) were prepared and then oxidized in pure oxygen atmosphere [2]. Chen et al [4] were studied Mg-3Gd, Mg-Y and Mg-Sc samples due to the high thermodynamic stability of their oxides leveraged corrosion protection of Mg surface as the native oxide MgO is known to be non-protective and low stability in aqueous solutions. The corrosion resistance of these 3 alloys carried out in Hanks' balanced salt solution, at 37°C, decreased in the order: Mg-3Gd< Mg-3Sc<Mg3Y. The corrosion rate of Mg−3Gd was tenfold lesser than that of Mg−3Gd−1Y and twenty times lesser than that of Mg−5Gd−1Y [4]. Li et al [21] studied Mg alloys, Mg–(1–5)Zr–(0–5)Sr (wt.%) and reported that both Zr and Sr are excellent candidates for Mg alloying elements in manufacturing biodegradable Mg alloy implants considering the biological benefits of Sr, Zr and Mg. Further, the composition of Zr/Sr less than 5% in the alloy is suitable for the implant materials. Other studies were developed on in vitro corrosion of binary Mg-1wt%X (X = Al, Ag, In, Mn, Si, Sn,Y, Zn or Zr) to find an acceptable alloying element for biomedical magnesium alloy design [22]. It has been observed that addition of rare-earth (RE) elements to magnesium improves the corrosion resistance of the alloy.
They also studied microstructure, biocorrosion behaviour and cytotoxicity of as-extruded promising high-strength biodegradable Mg–11.3Gd–2.5Zn–0.7Zr and Mg–10.2Gd–3.3Y–0.6Zr alloys, in Hanks’ solution in order to develop new biodegradable magnesium alloy [24]. The corrosion rates of both alloys were calculated according to the hydrogen volumes and found to be 0.17 and 0.55 mm/year for Mg–11.3Gd–2.5Zn–0.7Zr and Mg–10.2Gd–3.3Y–0.6Zr alloy, respectively. Mg–8Y–1Er–2Zn (wt%) alloy containing long period stacking ordered (LPSO) phase are investigated before and after corrosion in a simulated body fluid (SBF) at 37°C as potential orthopedic materials.
HORT et al [25] recently studied as-cast binary Mg−Gd alloys containing 2%−15%Gd. They observed the minimum corrosion rate with 10% Gd. This result was further confirmed by Zidane et al [26] in a similar investigation on the same Mg-alloys in 1wt% sodium chloride at 21.5°C. However, Chang et al [27] investigated the effect of Gd additions (6−12 wt%) on the corrosion behavior of Mg −Y−Zr alloy, keeping the composition of other alloying elements (Y & Zr) constant and found that 10wt% Gd addition was the worst.
Feyerabend et al. [28] evaluated the toxicity and in vitro cytotoxicity of the various rare earth elements yttrium (Y), neodymium (Nd), dysprosium (Dy), praseodymium (Pr), gadolinium (Gd), lanthanum (La), cerium (Ce), europium (Eu). The influence of biocorrosion on microstructure and mechanical properties of deformed Mg–Y–Er–Zn biomaterial containing 18R-LPSO phase was studied by Leng et al. [29]. The as-extruded Mg alloy exhibits excellent tensile properties before immersing in SBF and its corrosion rate is calculated as 0.568 mm/y. The hydrogen evolution volume per day fluctuates between 0.21 and 0.32 ml/cm2 throughout the whole immersion time. It seems that magnesium alloyed with 5 to 10 wt% provides better corrosion resistance for the alloy. Recently, some reports also start to focus on improving the corrosion resistance of Mg–Gd–X type alloys (X= Y or Zr). Liang et al. [30] investigated the effect of heat treatment on the corrosion behavior of Mg–7Gd– 3Y–0.4Zr alloy with aim at improving the corrosion resistance by change in microstructure. This paper mainly focuses on and studies alloys as-cast (F), solution-treated at 520°C for 8 h and quenched into hot water at 70°C (T4), and peak-aged (T6) in 200°C in an oil bath for 200h using immersion tests and potentiodynamic measurements in sodium chloride solution (5wt.%). The results show that the order of the corrosion rates is F > T6>T4. Mg10Gd1Mn was found to have the greatest corrosion resistance among the series (Al, Mn, Zn, Y) and was better than the Mg10Gd alloy [31]. So, one can conclude from the statement that the behaviour of Mg-RE depends on the distribution of RE in the Mg structure. A lot of research work have been carried to improve the corrosion behaviour of Mg-alloys with change in the composition [32], microstructure [25, 33], coatings [34-37] grain size and texture [38-40]. The homogeneity microstructure of the alloy induced higher corrosion resistance. The heat treatment influences the structure of the alloy which in turn influences its corrosion behaviour [41].
(F, T4 and T6) decrease in the following order: T4 > T6 > F. While Yang et al. [43] reported that the degradation rates of the heat-treated Mg–10Dy (wt.%) and Mg–10(Dy + Gd)–0.2Zr (wt.%) alloys are always in the range from 0.3 to 0.5 mm year-1,regardless of the treatment conditions. It is reported that the heat treatment of the Al–Mg–Zn–Sc–Zr alloy has a positive impact on corrosion resistance of the alloy which consequently, changes the electrochemical behaviour of the alloy [44].
In the present work, we have investigated the effect of heat treatment on the corrosion behavior of Mg10Gd1Eu1Zn0.2Zr as cast, F, T4 and T6, in 1wt% sodium chloride solution by potentiodynamic polarization, electrochemical impedance spectroscopy and scanning electron microscopy. To our best of knowledge, similar study has not been reported in literature.
2. EXPERIMENTAL PROCEDURE 2.1 Alloy and testing solutions
In the present study, the rod of Mg10Gd1Eu1Zn0.2Zr wt% alloy (graciously provided by Helmholtz-Zentrum Geesthacht, Germany) has been used as the basic material. The specimens used for the study were in form of cylindrical shape (5 mm in diameter and 4 mm thickness) and cut from heat treated Mg-alloy ingots. Three cases of simples as cast condition F, solution-treated T4 and artificially-aged, T6 heat treatments as indicated in ref [25] were investigated. For T4 treatment, the simple is annealed at temperature of 525°C for 24 hours. A water quench of the specimens followed immediately after the heat treatment. Ageing at 250 °C for 6 h was done for the treatment on T6 specimens that had also been treated for the T4 conditions [25, 45]. The Mg alloys used for this study were prepared by grinding each side with 1200 grid emery paper and degreasing the surfaces ultrasonically with ethanol, washing properly by bi-distilled water and finally drying in open air prior to corrosion testing. 1wt% (10g/L) sodium chloride (Sigma Aldrich) aqueous solution was prepared using bi-distilled water. The initial pH of the prepared solution was 6.5 ± 0.1. pH was measured using pH-meter (Knick 766 Calimatic) and the temperature was kept at 21.5 ± 0.5 °C using the DBO-meter chamber.
2.2. Weight Loss Measurements
alloy specimens.
2.3. Electrochemical Measurements
Electrochemical test was carried out at 21.5°C in quiescent 1% sodium chloride aqueous solution using the Mg-alloy, in ring form as the working electrode. The specimens were mounted in a glass tube using Araldite epoxy resin. Only one side of the specimen (0.2 cm2) was in contact with the electrolyte. The electrical contact with the remaining side of the test electrode was made using a rigid cupper wire.
Electrochemical studies were carried out in a three-electrode with single-compartment glass cell. The potential of the working electrode was measured against a saturated calomel electrode (SCE) (0.240V vs. SHE). The SCE was connected through a KCl-containing agar-agar salt bridge, the tip of which was placed as close as possible to the surface of the working electrode in order to minimize the solution resistance between the test and reference electrodes (IR drop). The aerated and unstirred electrolyte is used with the volume of 200 ml. The counter electrode consisted of a platinum plate of 6 cm2 surface area. The electrochemical study was performed using a computerized electrochemical potentiostat set Voltalab PRZ 100 (Radiometer-Analytical). The corrosion behaviour of the Mg-alloys was investigated using potentiodynamic polarization technique. The polarization curves were measured after the determination of the open circuit potential (OCP) of the test electrode. For all electrochemical investigations, the OCP was measured for at least 30 minutes. The polarization curves were recorded in aqueous sodium chloride solutions at a scan rate of 1 mV.s-1. All the specimens were held in vertical position.
The experimental procedures and conditions employed in the EIS study were similar to those described previously [46, 47].
An AC voltage amplitude of 5 mV peak-to-peak voltage excitation and a frequency range of 10-2-105 Hz were employed in the impedance measurements. Results were displayed in the form of Nyquist plots. Each experiment was repeated at least three times to check the reproducibility.
2.4. SEM and X-ray Diffraction
The morphology of the Mg-alloys was observed using a high resolution SEM (FEI QUANTA 200). The chemical compositions of the samples were monitored by X-ray diffraction (XRD) (X’Pert PRO, PANalytical CuKα = 1.5406 Å). SEM and XRD analysis were done in UTARS unit of CNRST, in Rabat.
3. RESULTS AND DISCUSSION 3.1. pH evolution of the test solution
immersion of three kinds Mg-alloys at 21.5°C. All the curves have similar shapes. This figure demonstrates that shortly after immersion, the pH of the solution firstly tends towards positive direction quickly and then it changes slowly until steady state is established around pH = 9.75, 9.74 and 9.50 for as-cast condition F, solution-treated T4 and artificially-aged and heat treated T6, respectively.
Figure 1. Evolution of the 1wt% NaCl solution pH as function of immersion time for the Mg alloys F, T4 and T6.
The corrosion of Mg-alloy undergoes Mg dissolution, magnesium hydroxide formation and hydrogen gas evolution. Mg corrosion proceeds followed by Mg dissolution (reaction 1) at the anodic and hydrogen evolution reaction (reaction 2), at the cathodic regions of the same alloy surface [48]. The increase of pH is due to the formation of OH- as one of the reaction products in reaction 2 [49-51]. Reactions 1 and 2 can be shown as follows:
Mg Mg2+ + 2e (1) 2H2O +2e H2 + 2OH- (2)
The sum effect of reactions (1) and (2) results in corrosion of magnesium and production of H2
and OH- ions.
Regarding the evolution of pH concomitant with the corrosion phenomena, it is obvious that the corrosion rate increases at the beginning and slowly thereafter. According to the report of Song and Atrens [50], the formation of Mg(OH)2 film on the magnesium surface is likely the reason of the
enhanced corrosion resistance.
0 2 4 6 8 10
6.0 6.5 7.0 7.5 8.0 8.5 9.0 9.5 10.0
pH
Immersion time (h)
[image:6.596.103.494.172.474.2][image:7.596.153.444.97.313.2]
3.2 Weight loss
Figure 2. Corrosion rate of Mg alloy F, T4 and T6 immersed in 1wt% NaCl solution for 24 h at 21.5°C
Figure 3. Open–circuit potential vs. time for F, T4 and T6 Mg alloys electrodes immersed in 1wt% NaCl solution.
Figure 2 illustrates the weight loss of the soaked Mg-alloys in 1wt% sodium chloride solution for a period of 24 hours. The corrosion resistance derived from weight loss expressed in unit of mg cm
-2
h-1 increased in the order: F<T4<T6. As we have seen previously, it is likely that the increasing of the corrosion resistance is due to the formation of homogeneous Mg(OH)2 film which protect partially the
Mg substrate.
F T4 T6
0.00 0.05 0.10 0.15 0.20 0.25 0.30 0.35 C o rr o s io n r a te ( m g /c m ². h )
0 200 400 600 800 1000 1200 1400 1600 1800 2000 -900 -850 -800 -750 -700 -650 -600 -550 -500 -450 -400 -350 -300 -250 -200 P o te n ti a l m V /S C E
Immersion time /Sec
[image:7.596.134.464.356.590.2]
3.3. Open circuit potential (Eoc)
Figure 4. Polarization curves of F, T4 and T6 Mg alloys in 1wt% NaCl solution, v= 1 mV s-1.
Figure 4 depicts the variation of open circuit potential, Eoc, of the test samples in 1wt% sodium
chloride up to half an hour. Shortly after immersion, Eoc started from a more anodic potential,
[image:8.596.119.479.93.359.2]decreased 20-30 seconds and then displayed heading towards the nobler position before reaching a stable value of the potential (see also Table 1).
Table 1.Electrochemical parameters extracted from Tafel curves Samples Eoc
(mV/SCE)
Ecorr (mV/SCE
)
Icorr (mA cm-2)
βc (V dec-1)
βa (V dec-1)
F -676 -669 0.351 -0.345 0.335
T4 -585 -602 0.253 -0.360 0.233
T6 -486 -552 0.042 -0.344 0.168
Thus, from Table 1, it appears that Eoc of the Mg-alloys is sensitive to the treatment conditions.
As shown herein, Eoc of both F and T4 Mg alloys were more negative in comparison to T6 Mg alloy.
Among tested specimens, T6 Mg alloy seems to be less sensitive to degradation behavior which is likely due to homogeneity of the material which promotes the stability to the passive layer.
-2.5 -2.0 -1.5 -1.0 -0.5 0.0 0.5
-1.4 -1.2 -1.0 -0.8 -0.6 -0.4 -0.2 0.0 0.2 0.4
L
o
g
I
(
m
A
/c
m
²)
Potential V/SCE
[image:8.596.133.507.538.687.2]
3.4. Potentiodynamic polarization
To evaluate the effect of heat treatment on tested specimens, polarization curves of three kind of alloys are shown Figure 4. The derived electrochemical parameters extracted from these curves are summarized in Table 1. It could be seen that the corrosion potential, Ecorr, values increased in the sense
F<T4<T6 while the corrosion current density, Icorr, decreased in the same direction. Values of Eoc, and
Ecorr, are practically the same in the case of samples, F and T4 but they differ by 66mV in the case of
the sample T6. Further, both Eoc (-486 mV) and Ecorr (-552 mV) values observed for T6 sample are
significantly nobler than those observed for F (Eoc= -676 mV & Ecorr = -669 mV) and T4(Eoc= -585
mV & Ecorr = -602 mV) samples. The Tafel slopes observed for the cathodic reaction on all the three
simples are nearly the same, whereas they decrease significantly for the anodic reaction, from sample F (0.335 V dec-1) to T6 (0.168 V dec-1). Figure 4 demonstrates that the anodic process, i.e. the dissolution of Mg is greatly suppressed in the case of sample T6 as the anodic polarization curve gets shifted towards the lower current density. This indicates that the passive film formed during the anodic polarization protect the T6 alloy surface fairly well. Thus, it can be concluded that the heat treatment has strong influence on the corrosion behavior of the alloy. It possibly modifies the microstructure of the alloy sample and thereby the nature of thin protective passive surface film formed on the alloy surface. The corrosion behaviour obtained from potentiodynamic polarization methods reinforces the results obtained by weight loss method.
[image:9.596.162.439.439.669.2]3.5. Electrochemical impedance spectroscopy
Figure 5. Nyquist plots of Mg alloys F, T4 and T6 electrodes after 30min immersion in 1wt% NaCl solution.
[image:10.596.119.494.230.290.2]
loop with varying arc diameters. This suggests the similarity of the corrosion mechanism with different corrosion rates. Depressed semicircle is obtained at high and medium frequencies for the three Mg alloy samples. At low frequencies, ingathering points were obtained. Taking into account the capacitive loops obtained at high and medium frequency ranges to evaluate the kinetic parameters for the corrosion of the alloys, special attention will be reserved to this part. The impedance parameters are gathered in table 2.
Table 2.Electrochemical impedance parameters extracted from Nyquist diagrams Samples Rs / Ω.cm² Rt / Ω.cm² CPE-T / S.s-1 .cm-2 CPE-P
F 110.4 15976 1.08 10 -7 0.6
T4 177.4 81844 9.11 10-7 0.73
T6 168.0 91649 8.49 10-7 0.69
Table 2 shows that the charge transfer resistance, Rt, representing the diameter of the semicircle increases in the sense F <T4<T6 (Fig. 5 and Table 2), indicating thereby that the corrosion resistance also increases in the same order. Thus, the T6-treated alloy proves to have the best corrosion resistance, which is once again in accordance with the results obtained by potentiodynamic and weight loss measurements. Therefore, the results of the EIS also show that aging treatment can improve the corrosion resistance of the Mg- alloys.
3.6. X-ray diffraction
Figure 6. XRD plots of F, T4 and T6 Mg- alloy samples (a) before and (b) after immersion in 1%wt NaCl solution for 24 h.
[image:10.596.81.495.468.628.2][image:11.596.91.533.97.665.2]
3.7. Surface analysis
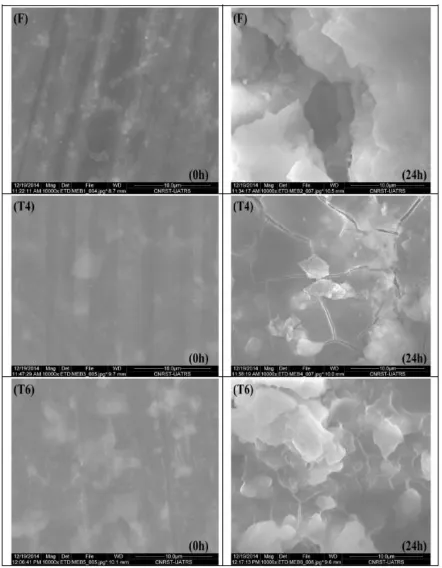
Figure 7. Scanning electron micrographs of F, T4 and T6 Mg-alloys before and after immersion test in 1%wt NaCl solution for 24h.
due to presence of the treatment effect. It is clearly seen from the SEM images that the surface of the steel after its immersion in 1%wt sodium chloride solution for 24 h presents the contrasted morphology. The surface of F Mg-alloy presents broad holes here T4 Mg-alloy presents cracks. However T6 Mg-alloy presents the deposition of the corrosion products on continuum substrate. This may explain the good resistance of this alloy compared to the other ones.
4. CONCLUSIONS
The study has shown that the heat treatment markedly influences the corrosion resistance of magnesium alloyMg10Gd1Eu1Zn0.2Zr in 1wt% sodium chloride solution. All the studies performed in the present investigation, namely the weight loss, the open-circuit potential , the electrochemical polarization and EIS measurements indicate that the corrosion resistance of the alloy increases with the heat treatment following the order: F<T4<T6. The XRD study has confirmed the formation of Mg(OH)2 on the Mg surface in contact with the aggressive medium. The presence of different
alloying elements in the surface layer of the Mg alloy seems to improve its corrosion resistance."
References
1. Z. Wen, S. Duan, C. Dai, F. Yang, F. Zhang, Int. J. Electrochem. Sci. 9 (2014) 7846 - 7864. 2. H. S. Brar, I. S. Berglund, J. B. Allen, M. V. Manuel, Mater. Sci. Eng. C, 40 (2014) 407–417. 3. M.P. Staiger, A.M Pietak, J. Huadmai, G. Dias, Biomaterials, 27 (2006) 1728–34.
4. Y. Chen, Z. Xu, C. Smith, J. Sankar, Acta Biomaterialia 10 (2014) 4561–4573. 5. Ding, C. Wen, P. Hodgson, Y. Li, J. Mater. Chem. B 2 (20141) 912–33.
6. N. Li, Y.F. Zheng, J. Mater. Sci. Technol. 29 (2013) 489–502.
7. G.E.J. Poinern, S. Brundavanam, D. Fawcett, Am. J. Biomed. Eng. 2 (2012) 218–40. 8. D. Persaud-Sharma, A. Mc Goron, J. Biomimetics Biomater. Tissue Eng. 12(2011) 25–39. 9. X-N. Gu, Y-F. Zheng, Front Mater Sci. 4 (2010) 111–5.
10.F. Witte, Acta Biomaterialia 6 (2010) 1680-92.
11.G. Mani, M.D. Feldman, D. Patel, C.M. Agrawal, Biomaterials 28 (2007) 1689–710.
12.A. H. M. Sanchez, B. J.C. Luthringer, F. Feyerabend, R. Willumeit, Acta Biomaterialia 13 (2015) 16 –31.
13.R.K. Singh Raman, S. Jafari, S. E. Harandi, J. Eng. Frac. Mech.137 (2014) 97-108.
14.H. Waizy, J.M. Seitz, J. Reifenrath, A. Weizbauer, F.W. Bach, A. Meyer-Lindenberg, B. Denkena, H. Windhagen, J. Mater. Sci. 48( 2013) 39–50.
15.Y. Xin, T. Hu, P. Chu, Acta Biomaterials 7 (2011) 1452-9. 16.S. Virtanen, Mater. Sci. Eng. B 176 (2011) 1600–8.
17.L. Liu, R. Xu, G. Song, Surf. Coat.Technol. 205 (2010) 332–337. 18.H. Altun, H. Sinici, Mater. Characterization 59 (2008) 266–270. 19.J. Kubasek, D. Vojtech, Nonferrous Met. Soc. 23 (2013) 1215−1225.
20.N. Birbilis, M.A. Easton, A.D. Sudholz, S.M. Zhu, M.A. Gibson, Corr. Sci. 51( 2009) 683–689. 21.Y. Li, C. Wen, D. Mushahary, R. Sravanthi, N. Harishankar, G. Pande, P. Hodgson, Acta
Biomaterialia 8 (2012) 3177–3188.
24.X. Zhang, Y. Wu, Y. Xue, Z. Wang, L. Yang, Mater. Letters 86 (2012) 42-45.
25.N.Hort, Y. Huanga, D. Fechner, M. Störmer, C. Blawert, F. Witte, C. Vogt, H. Drücker, R. Willumeit, K.U. Kainer, F. Feyerabend, Acta Biomater. 6 (2010) 1714–1725.
26.N. Zidane, Y. Ait albrimi, A. Ait addi, J. Douch, A. Nahlé, M. Hamdani, Anti Corr. Meth. Mater., submitted
27.J. Chang, X. Guo, S. He, P. Fu, L. Peng, W. Ding, Corr. Sci. 50 (2008) 166−177.
28.F. Feyerabend, J. Fischer, J. Holtz, F. Witte, R. Willumeit, H. Drücker, C. Vogt, N. Hort, Acta Biomaterialia 6 (2010) 1834–1842.
29.Z. Leng, J. Zhang, T. Yin, L. Zhang, X. Guo, Q. Peng, M. Zhang, R. Wu, J. Mech. Behav. Biomed. Mater. 28 (2013) 332-339.
30.S. Liang, D. Guan, X. Tan, Mater. Design 32 (2011) 1194–1199.
31.M.R.S. Campos, N. Scharnagl, C. Blawert K. U. Kainer, Mater. Sci. Forum 765 (2013) 673-677. 32.N.T. Kirkland, J. Lespagnol, N. Birblis, M.P. Staiger, Corros. Sci. 52 (2010) 287–291.
33.B. Smola, I. Stulikova, F. von Buch, B.L. Mordike Mater. Sci. Eng. A 324 (2002) 113– 117. 34.Z. Yao, L. Li, Z. Jiang, Appl. Surf. Sci. 25 (2009) 6724–6728.
35.H.M. Wong, K.W.K. Yeung, K.O. Lam, V. Tam, P.K. Chu, K.D.K. Luk, K.M.C. Cheung, Biomaterials 31( 2010) 2084–209
36.S. Hiromoto, A. Yamamoto, Electrochim. Acta 54 (2009) 7085–7093.
37.F.Witte, J. Fischer, J. Nellesen, C. Vogt, J. Vogt, T. Donath, F. Beckmann, Acta Biomater. 6 (2010) 1792–1799.
38.Liu C, Xin Y, Tang G, Chu PK. Mater. Sci. Eng. A 456 (2007) 350–7. 39.Y.Wang, G. Liu, Z. Fan, Scripta. Mater. 54 (2006) 903–8.
40.R. Zeng, J. Zhang, W-J. Huang,W. Dietzel, K.U.Kainer, C. Blawert, K.E. Wei, Trans Nonferrous Met. Soc. 16 (2006) 763–71.
41.F. Lu, A. Ma, J. Jiang, Y. Guo, D. Yang, D. Song, J. Chen, Corr. Sci. 94( 2015) 171–178. 42.J-W Chang, P-H Fu, X-W Guo, L-M Peng,W-J Ding, Corr. Sci. 49 (2007) 2612–2627. 43.[43] L. Yang, Y. Huang, F. Feyerabend, R. Willumeit, C. Mendis, K.U. Kainer, N. Hort, Acta
Biomaterialia 9 ( 2013) 8499–8508.
44.C. Li, Q. Pan, Y. Shi, Y. Wang, B. Li, Materials and Design 55 (2014) 551–559. 45.ASTM B296.10.1520/B0296-03R08.
46.E. Laouini, J. Douch, M. Hamdani, Y. Berghoute, M.H. Mendonça,M.I.S. Pereira, R.N.Singh, J. Appl. Electrochem. 41 (2011) 731-740.
47.E. Laouini, M. Hamdani , M.I.S. Pereira, Y. Berghoute, J. Douch, M.H. Mendonça,R.N. Singh, Int. J. Electrochem. Sci. 4 (2009) 1074-1084.
48.R. Ambat, N.N. Aung And W. Zhou, J. App. Electrochem. 30 (2000) 865-874. 49.H.H. Uhlig and R. Winston, New York, J. Wiley and Sons, chapter 20, 1985. 50.G. L. Song and A. Atrens, Adv. Eng. Mater.1(1999) 11-33
51.Z. Shi, J. X. Jia, A. Atrens Corr. Sci. 60(2012) 296–308.