City, University of London Institutional Repository
Citation
:
Keißner, A. & Brücker, C. (2012). Directional fluid transport along artificial ciliary
surfaces with base-layer actuation of counter-rotating orbital beating patterns. Soft Matter,
8(19), pp. 5342-5349. doi: 10.1039/c2sm25287b
This is the accepted version of the paper.
This version of the publication may differ from the final published
version.
Permanent repository link:
http://openaccess.city.ac.uk/12947/
Link to published version
:
http://dx.doi.org/10.1039/c2sm25287b
Copyright and reuse:
City Research Online aims to make research
outputs of City, University of London available to a wider audience.
Copyright and Moral Rights remain with the author(s) and/or copyright
holders. URLs from City Research Online may be freely distributed and
linked to.
City Research Online:
http://openaccess.city.ac.uk/
[email protected]
Directional fluid transport along artificial ciliary surfaces with base-layer
actuation of counter-rotating orbital beating patterns
Armin Keißner
*
aand Christoph Br
€
ucker
bReceived 8th February 2012, Accepted 14th March 2012
DOI: 10.1039/c2sm25287b
The generation of metachronal waves of beating cilia is a complex mechanism when reproduced in laboratory experiments. In addition, local manipulation of cilia in larger arrays becomes non-trivial when the beating patterns are not unidirectional. Herein, a more complex pattern of beating cilia is studied, where the cilia perform an orbital tip motion and rows of these cilia are counter-rotating in a traveling wave-like actuation. Interest in this type of potential fluid transport results from technical applications where localized streaks of directional flow need to be produced and the speed and direction of the fluid transport is open to be manipulated. A simple solution is found to generate the
corresponding traveling wave and beating patterns using a base-layer actuation of a membrane covered with artificial cilia. A device is built where such a wave is generated mechanically using a ball chain positioned below the membrane. When the ball chain is moved, the elevation leads to an orbital beating pattern of the tips of the cilia on top of the membrane. This beating shows characteristics of non-symmetric motion in terms of fast and slow motion phases in the orbital cycle. When the ball chain is positioned centered between parallel rows of the cilia and moved parallel to the rows, a well-defined directional fluid transport is generated in the gap. Micro-PIV revealed that successive traveling waves generate a steady streaming transport along the rows of the cilia as a combination of the fluid squeezing and streaming components. Changing the direction and speed of the ball chain is possible and allows the localized fluid transport in speed and direction to be altered. 2D Arrays of piston-like actuators in the form of a grid of balls may give further full control of position and direction of transport pathways along the ciliary surface.
1
Introduction
In the last years, many biomedical analyses and chemical syntheses have been developed with the need of very small flow rates and mixing at low Reynolds numbers. The processes should work on small scales of microns. Nature has solved these prob-lems in various ways; one way is the use of cilia. These cilia have different functions from sensor to actuator. Brennen and Winet1 gave a good overview about the different functions of cilia. In our focus of interest are cilia that provide a fluid transport. Their function within this context is quite versatile, some transport mucus or dirt,e.g.the cilia in the human trachea, others create large scale propulsion flow much larger than the individual size of the cilia,e.g.the self-propulsion induced by bacteria with their ciliary carpets.2A single cilium has a negligible influence on the global fluid flow when it is acting alone. However, when arrayed
in a bundle and by performing metachronal waves, cilia can produce a global flow.1 The common understanding of this transport mechanism under low Reynolds number conditions is that the cilia need to generate a non-symmetric beating pattern, either in motion path or in speed of motion. A prominent example is the Opalina cilia which beats with a fast effective stroke. In the recovery phase, the cilium is bent towards the wall and moves with a small velocity until it reaches the initial posi-tion and straight shape again. As a consequence of this moposi-tion, a directed fluid transport is initialized locally. When beating in synchronized motion, these individual beating patterns generate a global flow. In numerical simulations it is possible to examine the fluid structure interaction of the cilia motion and prove the resulting transport velocity. Dauptainet al.3show, that a row of flap like cilia generates a flow by performing a metachronal wave. The maximum velocities are induced at the tips of the cilia and the magnitude depends on the beating frequency. The experi-mental generation of such actuated cilia movement with each cilia being activated individually is however complex and allows in most cases only a unidirectional traveling direction. On the other hand, activation can be induced more globally by magnetic forces on magnetic cilia. One approach is the use of super-paramagnetic particles which are coupled somehow with the cilia
aTU Bergakademie Freiberg, Institute for Mechanics and Fluid Dynamics,
Lampadiustraße 4, 09599 Freiberg, Germany. E-mail: Armin.Keissner@ imfd.tu-freiberg.de; Fax: +49 3731 393455; Tel: +49 3731 394018
bTU Bergakademie Freiberg, Institute for Mechanics and Fluid Dynamics,
Lampadiustraße 4, 09599 Freiberg, Germany. E-mail: Christoph. [email protected]; Fax: +49 3731 393455; Tel: +49 3731 393833
Cite this:
Soft Matter
, 2012,
8
, 5342
and actuated by magnetic forces.4 Hussong et al.5 used flaps which were dyed with magnetic particles. By actuation of these flaps, they could measure a net flow induced by the cilia move-ment. However, the short range of the resulting magnetic forces requires placement of the actuator close to the tips of the cilia, it is also possible to induce a flow when the cilia are driven by a base-layer activation which is imposed mechanically in a more global way. An asymmetric motion pattern of the cilia is very important for fluid manipulation on small scales.6Other actua-tion mechanisms as well as mechanical ones were realized, too. Evans et al.7 presented a method to manufacture high aspect ratio magnetic cilia on the nano-scale. They made arrays of magnetic cilia with diameters of 125 nm and length of 22.5mm. By applying magnetic forces the cilia could be actuated in larger bundles to bend homogeneously in one direction or to rotate their bending direction. Artificial cilia are also important for mixing or stirring of different fluids on the micron-scale. Espe-cially for medical diagnostics and molecular medicine a rapid and complete mixing of two or more fluids is essential. Numerical simulation helps to design such micro-mixers for any actuation either when it is achieved by chemical forces, inertia effects or piezoelectric effects of electromagnetic forces. A computational fluid–structure model is given by Khatavkaret al.8for flap-like cilia. They discussed different cilia arrangements with different phase shifts between the single cilium motions in relation to the mixing performance. Two cilia positioned on the same wall next to each other or on facing walls generate optimum mixing effi-ciency when their motion has a phase lag of p/2. Lee et al.9
discussed the effect of an array of vibrating cilia on the fluid. They simulated and measured the flow which is induced by vibrating cilia. The simulations take the added mass effects into account. The dependency of the cilia spacing to the vortices they induce is shown. They achieved a good agreement between the simulations and the experiments. The mixing performance of different cilia configuration is shown and some hints for the dimensioning of micro-mixing devices are given. Br€ucker and Keißner10described a set-up which is similar to the outer hair cells of the human inner ear. On a thin membrane artificial cilia are arrayed in a V-shape. This membrane is forced to move in an oscillating motion using a piston below the membrane. The resulting cilia motion induces a net transport and efficient mixing of the fluid. In this paper, we extend our studies on ciliary fluid transport using orbital beating cilia. By using a membrane covered with artificial cilia and a moving ball chain below, we generate a traveling wave type motion of the cilia with an orbital beating pattern. The interaction between the beating artificial cilia and the fluid is analyzed usingmPIV (micro particle image velocimetry) measurements.
2
Experimental setup
2.1 Manufacturing of the arrays of artificial cilia
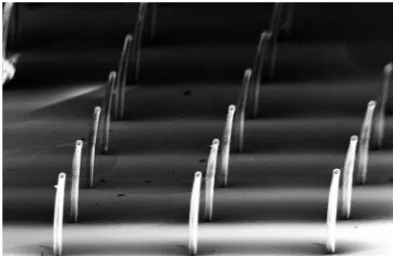
The artificial cilia were made of PDMS (polydimethylsiloxane) and have the shape of cylindrical micro-pillars similar to the structures we used in our earlier studies for sensory applica-tions.11For the application herein as artificial cilia, we produced micro-pillars with a length of 1000mm and a diameter of 100mm. In addition, smaller structures were applied Fig. 1, however the
larger ones fit better to the mechanical conditions of the actu-ating mechanism discussed later. These artificial cilia are arranged in an array of 10 by 10 with a spacing of 500 mm (Fig. 1). They are embedded on a thin membrane with a thickness of about 100mm. Thus, the micro-pillars react strongly on small deformations of the base-layer membrane. The arrays were manufactured by casting PDMS into a negative mold, made of a silicon wafer. A chemical deep etching process was used to generate cylindrical holes in the wafer with a diameter of 100mm and a pitch of 500 mm. To avoid gas bubbles in the PDMS, a degassing was applied during the curing of the PDMS at a temperature of 70C. Finally, the layer is removed from the wafer by peel-off, thus a thin membrane is produced which is covered with an array of micro-pillars. The result of this proce-dure is illustrated in Fig. 1.
2.2 Generation of orbital beating patterns and traveling wave
The orbital beating pattern of the artificial cilia is created by using a ball chain as a base-layer actuator (Fig. 2). The balls along the chain have a diameter of 1.5 mm and a pitch of 2.1 mm and they are arranged with the centerline positioned in the middle between two rows of the cilia array (Fig. 2). By slightly pressing the balls from below against the bottom of the membrane small elevations are generated. Thus, the cilia which are on the upside of the membrane were deflected away from the middle of the elevations. When moving the chain in the direction of the rows a counter-rotating motion of the tips of the artificial cilia is achieved, see Fig. 2b. Due to the elevations the cilia have a slight constant deflection away from the ball chain (Fig. 2c). The artificial cilia along the left-hand side of the moving balls are moving opposite to the cilia along the right-hand side. Since the balls are spaced in a regular manner, a traveling wave of such counter-rotating beating patterns is achieved. Hence, the gap between the opposite rows of cilia tips next to the centerline of the chain follows a quasi-harmonic function.
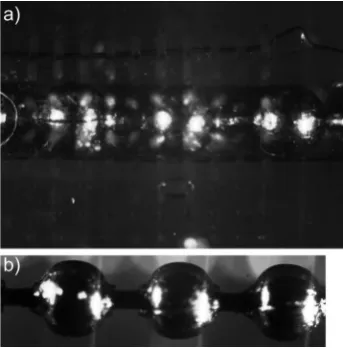
In the photo of the top view (Fig. 2b) two reflection points per ball are visible below the membrane. This is a result of the illu-mination conditions applied to take the photo. In Fig. 3 the ball chain is displayed alone to get a better understanding of its contours. Again, the picture shows the reflection points on the spheres’ surfaces.
Fig. 1 REM image of a typical micro-pillar array as produced and used for our studies. The picture shows micro-pillars with a diameter of 30mm and a height of 500mm which is the smallest structure we used as artificial cilia.
[image:3.595.330.528.546.674.2]2.3 Flow chamber and measurement method
The membrane with the artificial cilia is placed within a flow chamber as one of the boundary walls (bottom boundary wall) with the artificial cilia pointing up. The top boundary is a Perspex plate with a distance of 2 mm to the bottom. The side walls are
far away from the array, relative to the array size. Hence, we can assume that there are no side-wall influences on the generated transport processes. The channel was sealed to the outside. During the measurements, there was no in- or outflow of fluid. Fig. 4 displays a detailed view of the set-up.
The cilia shown in Fig. 1 are implemented in a port. A soft silicone rubber seal is placed between the port and the covering plate. There are two tubes to fill the measurement chamber. These tubes are sealed during the experiments. Thus, we have a closed environment. The ball chain is towed by a linear drive with constant velocity.
We used amPIV system to examine the flow field induced by the artificial cilia. ThemPIV technique is based on cross corre-lation of gray values which results from imaging of the light scattered by small tracer particles added to the fluid. In our application of fluid–structure interaction between the beating cilia and the induced flow field it is important to distinguish the light scattered from the artificial cilia from the light scattered from the tracer particles. Therefore, the technique of fluorescent scattering and optical filtering is used in combination with laser-based illumination. We used an epifluorescent set-up where recording and illumination goes along the same path in the flow chamber. A laser beam of a Nd:Yag laser (Continuum Minilite, l¼532 nm) is expanded and sent through a beam splitter into the liquid in the flow chamber. The fluid is seeded with fluores-cent tracer particles. The wavelength of the laser stimulates the tracer particles to emit light in the fluorescent wavelength (l¼583 nm). This scatter light is guided back through the beam splitter, it then passes a color filter that blocks the direct laser light, thus only the light scattered from the tracer particles hits the sensor chip of the camera (PCO 1600). Therefore, the tracer particles used herein were made of polyvinylacetate dyed with Rhodamine B. The density of these tracers ranges from 1.17 g l1 to 1.2 g l1. In order to match the density of the particles a water– glycerin mixture with a mass ratio of 40 : 60 was used as the fluid. The diameter of the particles ranges from 1mm up to 20mm. The kinematic viscosity for this mixture isn¼8.4 m2s1. The epi-fluorescent illumination is a volumetric illumination technique. Therefore, the measurement plane is defined by the numerical aperture of the objective. The depth of viewddovis estimated by
the equation according to Inoue and Spring.12
ddov¼
ln
NA2þ
n
MNAdc (1)
Here,ldenotes the wavelength of light, n the refractive index, NA is the numerical aperture and dcthe smallest length which the
detector can measure. However, the PIV analysis is based on a cross correlation. Even particles slightly out of focus have an Fig. 2 Schematic and photo of the cilia array with deflection by the ball
chain, view from the right (a), top view (b) and view from the front (c).
Fig. 3 Picture a) shows the membrane with the ball chain below. The lens is focused on the ball chain. Picture b) shows the ball chain when the membrane is removed.
[image:4.595.343.515.51.141.2] [image:4.595.52.276.51.379.2] [image:4.595.80.252.425.600.2]influence on the correlation function. Therefore, the depth of correlation is estimated by eqn (2) which characterizes the thickness of the measurement plane.13
ddoc¼
3ln
NA2þ 2:16dp
tanq þdp (2)
In eqn (2)dpdenotes the particle size andqis the half opening
angle of the objective. The data of the experimental set-up and the results of the calculations are given in Table 1. During the experiments the ball chain was pulled at a constant velocity. With the known gap between the balls and the velocity, the excitation frequency of the cilia could be calculated. The measurements were carried out at frequencies of 1 Hz, 2 Hz and 3 Hz. The images for the cross correlation were taken at a constant frame rate. The number of double frames used for one measurement was 400. The cross correlation is performed with windows of the size of 3232 pixels.
3
Results
3.1 Generated ciliary motion patterns
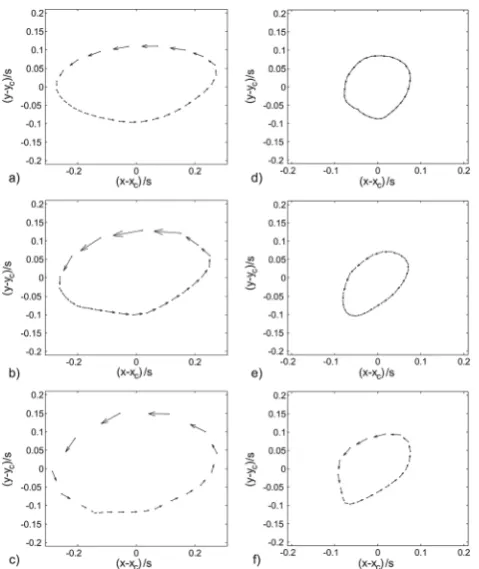
First the beating pattern of the artificial cilia is studied. There-fore, we took images of their tip movement. Note that the cylindrical body of the artificial cilia remains straight over the whole beating cycle while the tilt of the cylinder is manipulated by the base-layer actuation. Therefore the motion of the tips of the cilia is a sufficient indicator of the motion pattern in total. Fig. 5 depicts the positions of the cilia tips during one orbital beating cycle when a ball passes the local region from left to right. The dots represent the motion of the tip of one artificial cilium. In Fig. 5 the horizontal axis is defined by the axis and towing direction of the ball chain. Only four rows near the ball chain, two in the positive and two in the negative y-direction, perform a significant motion. The inner rows are the nearest to the ball chain. The outer row is the second row next to the ball chain.
[image:5.595.313.543.53.195.2]In Fig. 5, only two neighboring columns of the four cilia next to the ball are represented instead of all 40 cilia which are actually in motion along the chain. The distance of the inner row from the centerline of the chain is 250mm. The outer row has a distance of 750mm. The coordinates of the tip positions are normalized with the cilia spacing s of 500 mm as displayed in Fig. 2. In general, the plots demonstrate that the motion of the cilia tips follows an orbital curve. The deflection of the cilia tips, caused by the elevations the ball chain creates, leads to the fact
that the orbital center positions ycare not exactly at yc0.5 for
the inner row and yc1.5 for the outer row. In Fig. 6, the results
are displayed for selected individual cilia. The origin of the plots is the virtual center-position of the orbital motion of the cilia xc, yc. The vectors illustrate the path along which the cilia tips
move within defined time-steps ofDt ¼ 1/30 s. The motion of the inner row is presented in the images a) to c) of Fig. 6. In Fig. 6 the negative values of (yyc)/s indicate the direction towards the
chain. The velocity of the cilia near to the ball chain in the phase Table 1 Calculation of depth of view and depth of correlation
n 1.409
l 625 nm
NA 0.25
M 1.7
dc 7.4 mm
q 10
dp 10 mm
ddov 38 mm
ddoc 169 mm
Fig. 5 Schematics of the cilia tip motion, shown for two neighboring columns of cilia next to a ball. Each loop represents the positions of one cilium during the orbital beating cycle, which is sampled in equidistant time-steps. Therefore the spacing between the dots is inverse proportional to the velocity of the tips.
Fig. 6 Tip movement of an artificial cilium for different excitation frequencies, a) and d) by 1 Hz b) and e) by 2 Hz and c) and f) by 3 Hz. The plots in a) to c) display the motion-path of the inner row and d) to f) the motion-path of the outer row.
[image:5.595.42.290.68.177.2] [image:5.595.311.551.392.677.2]of forward motion (positive x-direction) is smaller than in the motion phase in negative x-direction at a larger distance to the balls. This leads to a slow motion beating phase when the cilia tips move in the direction of the ball chain and a faster recovery stroke in the opposite direction. The repetition frequency of the motion patterns depends on the travelling speed of the chain and the distance between the centers of the balls, which is equivalent to the wavelength of the travelling wave excitation (l¼2.1 mm). A towing speed of 2.1 mm s1leads to an excitation frequency of fex ¼ 1Hz. Other values are adjusted simply by changing the
towing speed. By towing the ball chain for a longer time one generates a large number of successive orbital beating cycles in the form of a continuous wave travelling along the ciliary surface.
The ciliary beating pattern deviates from a simple circular or ellipsoidal motion path with constant velocity, therefore there are more than one harmonics involved in the process. A sum of two harmonic functions is needed for reasonable approximation of the motion in each direction. The tip motion of the cilia is approximated by the following equation:
f¼A + B$sin(2pf$t+ C) + D$sin(4pf$t+ E) (3)
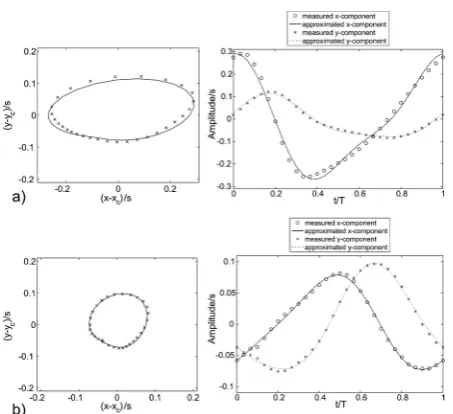
The coefficients for eqn (3) can be found in Table 2. The coefficients are different for the x-component and for the y-component of the orbital motion. Fig. 7 displays the time resolved solution of eqn (3) in these directions with the coeffi-cients given in Table 2 for an excitation frequency of 1Hz. The continuous line refers to the x-component and the dotted line to the y-direction. The x and o markers represent the measured data points. Fig. 7a) shows the orbital motion of the inner row and b) the orbital motion of the outer row together with the approxi-mated curves. In addition, the corresponding profiles of the
x- and y-coordinates of the motion pattern of the cilia are shown. The phase shift between the outer cilia row (further away in lateral direction from the chain) and the inner cilia row is approximately 90 degrees.
3.2 Large-scale streaming pattern
The large scale fluid motion generated by the traveling wave excitation is obtained by the processing of successive images at a frame rate of 16 fps for an excitation frequency of 1 Hz, 20 fps for fex¼2 Hz and 24 fps for fex¼3 Hz of the tracer particles. The
duration of the measurement is 25 excitation cycles (towing the number of 25 successive spheres on the chain along the membrane). Before the measurements start more than twice of the examined excitation cycles run through. Therefore, the flow
Fig. 7 Curve fit of the orbital beating patterns of the artificial cilia for a) the inner and b) the outer row of the cilia (excitation frequency fex¼1
Hz). Left: orbital motion pattern; right: temporal evolution of the coordinate positions relative to the center during the beating cycle (sphere symbol: measured x-component; solid line: curve fit of x-component according eqn (3); star symbol: measured y-component; dotted line: curve fit of y-component according eqn (3)).
[image:6.595.317.541.238.643.2] [image:6.595.54.281.437.644.2]in the channel has established a steady-state. The displacement of the tracer particles is determined from correlation procedure and represents the fluid drift. The cross correlation is performed with windows of the size of 3232 pixels.
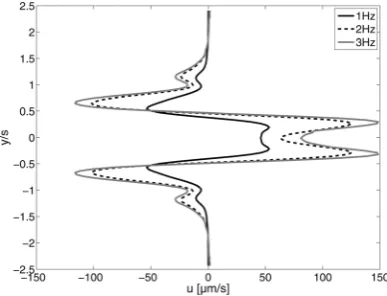
[image:7.595.321.541.48.303.2]The resulting streaming flow field is shown in Fig. 8. The streamlines of this net-flow component are displayed together with the color coded x-component of the streaming velocity. The red values are velocities in ball chain movement direction and the blue values represent the reverse direction. The orbital motion and center positions of the cilia along the inner and outer row are sketched into the diagrams (Fig. 8) to illustrate their location within the streaming flow field set-up. The structure of the streaming flow is comparable for all three excitation frequencies. There is a flow at the center in the same direction as the ball chain is towed (red color coded) and a reverse flow (blue color coded) between the inner and outer row. Keep in mind that we have a closed system. Thus, the fluid transport through the middle of the cilia array needs to be balanced by some backflow at the outsides. Overall, the streaming pattern shows a pair of two large elongated recirculation regions with symmetry to the centerline. For each excitation case, small primary swirls can be identified around the individual cilia. The small primary swirls are nested within the large recirculation pattern and contribute to the transport direction. The most relevant feature of the streaming motion is the streak-like flow transport along the center rows. Fig. 9 displays the mean flow profile along the y-axis. The u-component of the flow field is averaged from first column of the cilia array to the last column. As can be seen from the plots, the streaming velocities increase with increasing excitation frequencies. The shape of the velocity profile is similar in every measured case. The velocities along the center rows are much higher than the velocities in the back flow region. Near the cilia of the inner rows, the highest velocities occur. This indicates that the flow is driven by the cilia motion. The integral velocity over y is approximately zero, thus the net-transport in the hole system is zero, too. As mentioned before we have a closed system. It is important to quote, that the streaming result needs to be compared with the possible contribution of the elevated membrane surface alone to justify the relevance of the artificial cilia and their importance for the fluid transport. Therefore, we tested the same travelling wave mechanism with a membrane with no cilia on it as the reference case. The results showed that
the resulting displacements in the fluid near the elevations of the membrane are one order of magnitude lower and the resulting velocity vectors are less coherent than the displacements with the cilia Fig. 10. This clearly demonstrates that the fluid transport is induced by the artificial cilia and their specific beating pattern.
The Reynolds number of the flow is calculated by:
Re¼usl
n (4)
with us the induced streaming velocity in the middle of the
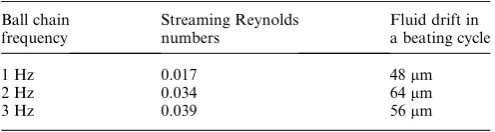
channel, l the length of the cilia as a characteristic scale of the beating amplitude and n the kinematic viscosity. In Table 3, the streaming Reynolds numbers and the mean drift of the fluid in the center from cycle to cycle are listed.
The Reynolds numbers of the flow given in Table 3 are much lower than unity. Under such low Reynolds numbers the flow is dominated by viscous forces. However, the resulting streaming pattern clearly demonstrates, that the highest velocities appear at the inner side of the row and in the forward motion. An expla-nation for this behavior is the additional effect of fluid squeezing in the gap between the inner rows, when the counter-rotating cilia approach each other in the forward stroke phase. Fluid is therefore accelerated into the gap between both inner rows and consequently pushed forward. In addition, we found only a low deficit of the velocity profile along the centerline relative to the maximum near the cilia. The approach of the cilia during the forward directed part of the orbital motion enhances the viscous coupling effect, thus the fluid elements at the centerline are accelerated, too.
Fig. 9 Mean profile of the streaming velocity component usalong the
y-axis (black line: fex¼1 Hz, dashed line: fex¼2 Hz and grey line fex¼3 Hz.
Fig. 10 Comparison of streaming effect with pillars (top) against the reference case of an actuated membrane without pillars (bottom). Streaming velocity is shown by contour lines of constant magnitude value. In the bottom diagram, the contours are given for the velocity range O(106)–O(105), which is one order of magnitude less than in the
top diagram with the range O(105)–O(104), all in m s1units.
[image:7.595.69.263.551.699.2]4
Conclusion
The method presented herein is based on a simple idea of generating travelling waves of orbital beating patterns along ciliary surfaces for the purpose of generating a localized direc-tional fluid transport along these surfaces. In addition, the free choice of direction of the fluid transport is an important aspect of the control probabilities of fluid transport in our approach. Therefore we don’t use artificial cilia with anisotropic shapes such ase.g.flap-like structures to induce the transport. Rather, the principle is based on artificial cilia with an isotropic shape in the form of cylindrical micro-pillars, whereas the streaming transport is achieved by actuation of orbital beating in specific spatio-temporal patterns along the cilia arrays. A typical actua-tion pattern is the generaactua-tion of a travelling wave of counter-rotating orbital beating cilia, which is achieved by a ball chain moving along the bottom of a flexible membrane which is covered on top with an array of micro-pillars. The streaming Reynolds number and travelling wave speed is varied by adjusting the towing speed of the chain at a given ball pitch relative to the spacing of the micro-pillars. When placed and towed along the center between neighboring rows of micro-pillars, the chain-type actuation principle generates a localized and directional fluid transport along the gap between the rows. A counter-rotating orbital motion of the cilia is induced therein, which generates both a streaming and squeezing effect. The experimental results prove that with such a simple set-up it is possible to induce a directional fluid transport which is propor-tional to the towing speed,i.e.the travelling wave speed. In our experimental set-up we were limited to a maximum excitation frequency of the ball chain of 3 Hz. Nevertheless, the tendency of larger induced velocities at higher frequencies could be shown.
Due to the asymmetric motion profile of the cilia with a slow forward and a fast recovery motion within the orbital cycle, one would expect a net flow in direction counter to the movement direction of the ball chain. However, this conclusion does not take into account the effect of the lateral motion of the artificial
cilia and their mutual interactionvia viscous coupling. In the slow forward motion part of the orbital cycle, the fluid is pushed forward due to a squeezing effect. The gap between the neigh-boring cilia rows left and right of the ball chain is decreasing, therefore the free space between the counter-rotating micro-pillars is decreasing too, while on the other hand the viscous coupling effect is increasing. Due to the small Reynolds numbers the drag forces predominate the inertial forces and have an effect on larger spatial scales than the inertial force. Hence, fluid is pushed forward and reaches maximum velocities even close to the center of the gap. In the recovery state of the cilia motion, the viscous coupling effects vanish. Accordingly, there is less fluid pushed back than forth. Reference measurements with a membrane without any artificial cilia show approximately zero effect on fluid motion which proves that the observed fluid transport effect is solely generated by the interaction of the cilia with the fluid and is not induced by the elevation of the membrane.
The use of a bundle of cilia actuated by a moving ball chain gives the opportunity to create a low cost transport mechanism for microfluidic applications. Changing the direction and speed of the ball chain is possible and allows us to alter the localized fluid transport speed and direction. 2D arrays of piston-like actuators in the form of a grid of balls may give further full control of position and orientation of transport pathways along the ciliary surface. Our measurements were carried out in a closed environment, so the actual flow rate could not be determined. Therefore, the streaming pattern shows a pair of counter-rotating swirl-type regions which are elongated in the towing direction and extend over the whole length of the micro-pillar rows. Around most of the individual cilia at the inner rows there is a smaller swirl-type motion which contributes to the global transport mechanism. With the here described set-up, the study of different influence factors of individual cilia defects on the flow could be done. e.g., defects in the cilia array can be simulated by decreasing the length of a single cilium in the array or changing their stiffness locally. In addition, further applica-tions may include the possible transport of particles in the liquid which is the subject of ongoing work in our lab.
Acknowledgements
[image:8.595.50.552.67.167.2]The authors thank Dr -Ing. Katrin Bauer and Dipl.-Ing. Andreas Hess. Part of the studies were funded by the DFG in the SPP micro- and nanofluidics, which is gratefully acknowledged here. Table 2 Approximated coefficient of eqn (3) for the inner and outer row of cilia by 1 Hz in the x- and y- direction
Inner row Outer row
Dimension
x-component y-component x-component y-component
f 1 1 1 1 Hz
A 4.04103 1.56103 6.13104 9.21104 mm
B 1.26101 4.69102 3.64102 4.20102 mm
C 1.34 4.41101 1.23 4.30101 radian
D 3.48102 1.22102 6.01103 6.67103 mm
E 8.79101 4.12101 8.49101 2.17101 radian
Table 3 Reynolds numbers
Ball chain frequency
Streaming Reynolds numbers
Fluid drift in a beating cycle
1 Hz 0.017 48mm
2 Hz 0.034 64mm
[image:8.595.43.291.212.278.2]References
1 C. Brennen and H. Winet,Annu. Rev. Fluid Mech., 1977,9, 339–398. 2 N. Darnton, L. Turner, K. Breuer and C. Berg,Biophys. J., 2004,86,
1863–1870.
3 A. Dauptain, J. Favier and A. Bottaro,J. Fluids Struct., 2008,24, 1156–1165.
4 G. Kokot, M. Vilfan, N. Osterman, A. Vilfan, B. Kavcic, I. Poberaj and D. Babic,Biomicrofluidics, 2011,5, 034103.
5 J. Hussong, N. Schorr, J. Belardi, O. Prucker, J. Rhe and J. Westerweel,Lab Chip, 2011,11, 2017–2022.
6 F. Fahrni, M. Prins and L. van IJzendoorn,Lab Chip, 2009,9, 3413– 3421.
7 B. A. Evans, A. R. Shields, R. Lloyd Carroll, S. Washburn, F. M. R and R. Superfine,Nano Lett., 2007,7, 1428–1434.
8 K. Khatavkar, P. Anderson, J. den Toonder and M.H,Phys. Fluids, 2007,19, 083605.
9 T.-R. Lee, K. Oh, C. J.-H, Y.-S. Chang, J.-B. Choi, G. Yagawa and Y.-J. Kim,Soft Matter, 2011,7, 4325–4334.
10 C. Br€ucker and A. Keißner,Exp. Fluids, 2010,49, 57–65.
11 C. Brucker, D. Bauer and H. Chaves,€ Exp. Fluids, 2007, 42, 737–749.
12 S. Inoue and K. R. Spring,Video microscopy - The fundamentals, Plenum Press Oxford, New York, 2nd edn, 1997.
13 C. Meinhart, S. Wereley and M. Gray,Meas. Sci. Technol., 2000,10, 809–814.