Manuscript Number: BONE-D-14-00403R2
Title: Muscle volume is related to trabecular and cortical bone architecture in typically developing children
Article Type: Original Full Length Article
Keywords: muscle, bone architecture, trabecular, cortical, femur length, MRI Corresponding Author: Dr. Christopher Modlesky, PhD
Corresponding Author's Institution: University of Delaware First Author: Deepti Bajaj, M.S.
Order of Authors: Deepti Bajaj, M.S.; Brianne M Allerton, M.S.; Joshua T Kirby, M.S.; Freeman Miller, MD; David A Rowe, PhD; Ryan Pohlig, PhD; Christopher Modlesky
Abstract: Introduction: Muscle is strongly related to cortical bone architecture in children; however, the relationship between muscle volume and trabecular bone architecture is poorly studied. The aim of this study was to determine if muscle volume is related to trabecular bone architecture in children and if the relationship is different than the relationship between muscle volume and cortical bone architecture.
Materials and methods: Forty typically developing children (20 boys and 20 girls; 6 to 12 y) were included the study. Measures of trabecular bone architecture [apparent trabecular bone volume to total volume (appBV/TV), trabecular number (appTb.N), trabecular thickness (appTb.Th), and trabecular separation (appTb.Sp)] in the distal femur, cortical bone architecture [(cortical volume, medullary volume, total volume, polar moment of inertia (J) and section modulus (Z)] in the midfemur, muscle volume in the midthigh and femur length were assessed using magnetic resonance imaging. Total and moderate-to-vigorous physical activity were assessed using an accelerometer-based activity monitor worn around the waist for four days. Calcium intake was assessed using diet records.
Relationships among the measures were tested using multiple linear regression analysis. Results: Muscle volume was moderately-to-strongly related to measures of trabecular bone
architecture [appBV/TV (r = 0.81, appTb.N (r = 0.53), appTb.Th (r = 0.67), appTb.Sp (r = -0.71; all p < 0.001] but more strongly related to measures of cortical bone architecture [cortical volume (r = 0.96), total volume (r = 0.94), Z (r = 0.94) and J (r = 0.92; all p < 0.001)]. Similar relationships were observed between femur length and measures of trabecular (p < 0.01) and cortical (p < 0.001) bone architecture. Sex, physical activity and calcium intake were not related to any measure of bone architecture (p > 0.05). Because muscle volume and femur length were strongly related (r = 0.91, p < 0.001), muscle volume was scaled for femur length (muscle volume/femur length2.77). When muscle volume/femur length2.77 was included in a regression model with femur length, sex, physical activity and calcium intake, muscle volume/femur length2.77 was a significant predictor of appBV/TV, appTb.Th and appTb.Sp (partial r = 0.44 to 049, p < 0.05) and all measures of cortical bone architecture (partial r = 0.47 to 054; p < 0.01).
1 2 3 4 5 6 7 8 9 10 11 12 13 14 15 16 17 18 19 20 21 22 23 24 25 26 27 28 29 30 31 32 33 34 35 36 37 38 39 40 41 42 43 44 45 46 47 48 49 50 51 52 53 54 55 56 57 58 59
Title: Muscle volume is related to trabecular and cortical bone architecture in typically developing children
Authors: Deepti Bajaj1, MS; Brianne M. Allerton1, MS, Joshua T. Kirby1, MS; Freeman Miller2, MD, David A. Rowe3, PhD, Ryan T. Pohlig4, PhD, Christopher M. Modlesky1, PhD
1
Department of Kinesiology and Applied Physiology, University of Delaware, Newark, DE 19711
2
Department of Orthopedics, Nemours AI duPont Hospital for Children, Wilmington, DE
3
School of Psychological Sciences and Health, University of Strathclyde, Glasgow, UK
4
Biostatistics Core Facility, University of Delaware, Newark, DE 19713
Abbreviations: apparent bone volume to total volume, appBV/TV; apparent trabecular number, appTb.N; apparent trabecular thickness, appTb.Th; apparent trabecular separation, appTb.Sp; section modulus, Z; polar moment of inertia, J
Address of correspondence and reprint requests: Christopher M. Modlesky, PhD
Department of Kinesiology and Applied Physiology University of Delaware
Newark, DE 19716
Telephone: (302) 831 4185 Fax: (302) 831 43693 Email: modlesky@udel.edu
4 5 6 7 8 9 10 11 12 13 14 15 16 17 18 19 20 21 22 23 24 25 26 27 28 29 30 31 32 33 34 35 36 37 38 39 40 41 42 43 44 45 46 47 48 49 50 51 52 53 54 55 56 57 58 59
Abstract
Introduction: Muscle is strongly related to cortical bone architecture in children; however, the
relationship between muscle volume and trabecular bone architecture is poorly studied. The aim
of this study was to determine if muscle volume is related to trabecular bone architecture in
children and if the relationship is different than the relationship between muscle volume and cortical bone architecture.
Materials and methods: Forty typically developing children (20 boys and 20 girls; 6 to 12 y)
were included the study. Measures of trabecular bone architecture [apparent trabecular bone volume to total volume (appBV/TV), trabecular number (appTb.N), trabecular thickness
(appTb.Th), and trabecular separation (appTb.Sp)] in the distal femur, cortical bone architecture
[(cortical volume, medullary volume, total volume, polar moment of inertia (J) and section
modulus (Z)] in the midfemur, muscle volume in the midthigh and femur length were assessed using magnetic resonance imaging. Total and moderate-to-vigorous physical activity were
assessed using an accelerometer-based activity monitor worn around the waist for four days.
Calcium intake was assessed using diet records. Relationships among the measures were tested using multiple linear regression analysis.
Results: Muscle volume was moderately-to-strongly related to measures of trabecular bone
architecture [appBV/TV (r = 0.81, appTb.N (r = 0.53), appTb.Th (r = 0.67), appTb.Sp (r = -0.71;
all p < 0.001] but more strongly related to measures of cortical bone architecture [cortical volume (r = 0.96), total volume (r = 0.94), Z (r = 0.94) and J (r = 0.92; all p < 0.001)]. Similar
3 4 5 6 7 8 9 10 11 12 13 14 15 16 17 18 19 20 21 22 23 24 25 26 27 28 29 30 31 32 33 34 35 36 37 38 39 40 41 42 43 44 45 46 47 48 49 50 51 52 53 54 55 56 57 58 59
strongly related (r = 0.91, p < 0.001), muscle volume was scaled for femur length (muscle volume/femur length2.77). When muscle volume/femur length2.77 was included in a regression model with femur length, sex, physical activity and calcium intake, muscle volume/femur length2.77 was a significant predictor of appBV/TV, appTb.Th and appTb.Sp (partial r = 0.44 to 049,p < 0.05) and all measures of cortical bone architecture (partial r = 0.47 to 054; p < 0.01).
Conclusions: The findings suggest that muscle volume in the midthigh is related to trabecular bone architecture in the distal femur of children. The relationship is weaker than the relationship
between muscle volume in the midthigh and cortical bone architecture in the midfemur, but the
discrepancy is driven, in large part, by the greater dependence of cortical bone architecture
measures on femur length.
4 5 6 7 8 9 10 11 12 13 14 15 16 17 18 19 20 21 22 23 24 25 26 27 28 29 30 31 32 33 34 35 36 37 38 39 40 41 42 43 44 45 46 47 48 49 50 51 52 53 54 55 56 57 58 59
Introduction
Childhood is viewed as a critical time to maximize the mass, architecture and strength of
bone and minimize fracture risk later in life [1, 2]. Areal bone mineral density (aBMD) is the
single best surrogate of fracture risk widely available. However, there is a significant overlap in
aBMD in those who have and have not fractured [3]. Moreover, using aBMD alone to make
clinical decisions in children has been questioned [4, 5]. The development of more sophisticated
imaging techniques, such as magnetic resonance imaging and computed tomography, now allow
for the separation on bone into different compartments and for the evaluation of different
architectural features of trabecular and cortical bone. The architecture of bone is an important contributor to its biomechanical strength [6]. Magnetic resonance imaging is particularly
attractive for the study of bone in children because it does not expose them to ionizing radiation.
Due to the importance of bone architecture, identifying factors that contribute to its
development could lead to an immediate and long-term reduction in fracture risk. Muscle clearly
has a positive influence on bone which has led to the proposal of muscle-bone indexes that
reflect the relationship between muscle and bone [7]. In theory, muscle-bone indexes can be
used to identify those at greatest risk for fracture or if factors other than muscle are contributing
3 4 5 6 7 8 9 10 11 12 13 14 15 16 17 18 19 20 21 22 23 24 25 26 27 28 29 30 31 32 33 34 35 36 37 38 39 40 41 42 43 44 45 46 47 48 49 50 51 52 53 54 55 56 57 58 59
The primary aim of this study was to determine if muscle volume is related to measures of trabecular bone architecture in typically developing children and if the relationship is different
than the relationship between muscle volume and cortical bone architecture. We hypothesized
that thigh muscle volume would be related to measures of trabecular and cortical bone
architecture in the distal femur of typically developing children while controlling for femur length, sex, physical activity and calcium intake.
Methods
Subjects
Typically developing children 6 to 12 years of age, between the 5th and 95th percentile for height and body mass, with no history of lower extremity fracture, no intramedullary fixation in the femur or tibia, no use of chronic medications known to affect bone or muscle development
and not participating in > 3 hours of organized physical activity per week were recruited from the Newark, DE, USA community by distributing flyers. The procedures followed were in
accordance with the ethical standards of the institutions on human experimentation. The
Institutional Review Boards at the University of Delaware and the AI duPont Hospital for Children approved the study. Written consent from parents and written assent from children, if able, were taken before testing.
Protocol
4 5 6 7 8 9 10 11 12 13 14 15 16 17 18 19 20 21 22 23 24 25 26 27 28 29 30 31 32 33 34 35 36 37 38 39 40 41 42 43 44 45 46 47 48 49 50 51 52 53 54 55 56 57 58 59
Anthropometrics
Children wore shorts, a t-shirt and no shoes during anthropometric assessment. Height
was measured to the nearest 0.1 cm using a wall-mounted stadiometer (Seca model 222, Novel
products, Rockton, IL). Body mass was rounded to the nearest 0.2 kg using a digital scale
(Detecto 6550, Cardinal Scale, MO). Height, body mass and body mass index (BMI) percentiles
were calculated from the normative graphs published by the Centers for Disease Control and
Prevention [11].
Tanner staging
Sexual maturity was assessed by a physician assistant using the Tanner staging technique
[12]. Signs of pubic hair growth were assessed along with testicular/penile development in boys,
and breast development in girls. The Tanner stages range from 1 to 5, with 1 indicating no signs
of sexual development (pre-pubertal), 2 indicating early sexual development and 5 indicating full
sexual development.
Physical activity
Physical activity was assessed using an accelerometer-based activity monitor (Actical;
Philips Respironics, Sunriver, OR) that was worn on the non-dominant hip for four days (three
3 4 5 6 7 8 9 10 11 12 13 14 15 16 17 18 19 20 21 22 23 24 25 26 27 28 29 30 31 32 33 34 35 36 37 38 39 40 41 42 43 44 45 46 47 48 49 50 51 52 53 54 55 56 57 58 59
Total physical activity was reported in average counts/d. Moderate-to-vigorous physical activity was reported in average counts/d, average minutes/d and average counts/minute/d. Physical activity was divided into moderate and vigorous levels based on the work of Puyau et al. [14] with 1500-6500 counts per minute classified as moderate activity and > 6500 counts per minute classified as vigorous activity. Only participants who wore the activity monitors for at least three complete days were included in the final analysis. This was confirmed by reviewing physical activity logs that were kept by the child with the assistance from the parent and by reviewing the graphical output generated by the activity monitor software.
Calcium intake
Children, with the aid of a parent, completed a diet record for two days during the week and one day on the weekend. To facilitate accurate quantification of foods, each participant and their parent received a list of serving size estimates based on comparisons to everyday objects (e.g. 3 oz of meat or poultry is approximately the size of a deck of cards). Calcium intake was estimated using the diet records and the USDA Food and Nutrient Database for Dietary Studies,
v. 1.0, as previously done [15]. Only participants who recorded diet for three complete days were included in the final analysis.
Magnetic resonance imaging
Trabecular bone architecture at the distal femur and cortical bone architecture and muscle
volume at the level of the middle-third of the femur on the non-dominant side were estimated
using MRI (GE 1.5 T; Milwaukee, WI). Children were immobilized from the waist down using
4 5 6 7 8 9 10 11 12 13 14 15 16 17 18 19 20 21 22 23 24 25 26 27 28 29 30 31 32 33 34 35 36 37 38 39 40 41 42 43 44 45 46 47 48 49 50 51 52 53 54 55 56 57 58 59
Different imaging protocols were used to collect images needed for the assessment of trabecular bone architecture and cortical bone architecture.
Trabecular bone architecture: A phased array coil (USA Instruments; Aurora, OH) was
secured to the lateral portion of the distal femur using a VacFIX system (PAR Scientific A/S;
Sivlandvaenge, Denmark). The lateral distal femur was identified using a three-plane localizer.
Then 26 high resolution axial images were collected immediately above the growth plate in the metaphysis using a 3D fast gradient echo sequence with a partial echo acquisition (4.5 ms echo time; 30 ms repetition time; 30° flip angle; 13.89 kHz bandwidth; 9 cm field of view) and an imaging matrix of 512 x 384 reconstructed to a 175 x 175 x 700 μm3
voxel size. Measures of trabecular bone architecture [i.e., appBV/TV, appTb.N (1/mm), appTb.Th (mm), and appTb.Sp
(1/mm)] in the 20 most central images were estimated using custom software created with Interactive Data Language (IDL; Research Systems, Inc, Boulder, CO) and a procedure similar
to that described by Majumdar et al. [17]. The procedure has been described in detail previously
[16]. One investigator oversaw the collection of all images and one research assistant conducted all image analysis. In our laboratory, the reproducibility of the trabecular bone architecture assessment in children using this procedure ranges from 2 to 3 % [16].
Cortical bone architecture, muscle volume and femur length: Axial images (1 cm thick
and 0.5 cm spacing) were collected along the length of the nondominant femur using a torso PA
coil (750 ms repetition time, 14 ms echo time, 16 cm field of view and a 512 x 512 imaging
matrix). Before image collection, the femur was identified using a three-plane localizer. The
region of interest box was carefully positioned using the proximal end of the femoral head and
the distal end of the femoral condyles to indicate the top and bottom, respectively, of the region
3 4 5 6 7 8 9 10 11 12 13 14 15 16 17 18 19 20 21 22 23 24 25 26 27 28 29 30 31 32 33 34 35 36 37 38 39 40 41 42 43 44 45 46 47 48 49 50 51 52 53 54 55 56 57 58 59
its midline was placed alongside the lateral portion of the femoral head and ran through the
center of the interchondalar notch between the femoral condyles. Using the localizer in the
sagittal plane, the region of interest box was positioned so its midline went through the center of
the femoral head and the center of the medial condyle. Images at the level of the middle third of
the femur were analyzed for measures of cortical bone architecture and strength and muscle
volume using software designed in-house with IDL. Images were first filtered with a median
filter to reduce pixel noise. The filtered images were then subjected to automatic segmentation
with a fuzzy C-means clustering algorithm. Using the software, voxels representing cortical
bone, the medullary cavity and muscle at the level of the mid-third of the femur were identified
and summed to determine their cross-sectional areas. Their volumes were quantified by
accounting for image thickness and spacing between images. Middle images were multiplied by
1.5 to account for the 1.0 cm slice thickness of each image and the 0.5 cm gap between images.
Images that included the proximal and distal ends of the region of interest were multiplied by an
appropriate correction factor (< 1.5) so the entire image set represented the middle third of the
femur. Volume (cm3) of the total midfemur was determined by summing cortical volume and medullary volume. Femur length was determined by counting the number of images and
adjusting for image thickness and spacing. Cross-sectional moment of inertia of the midfemur in
the anterior-posterior (CSMIap; cm4) and medial-lateral (CSMIml; cm4) directions were determined using the parallel-axis theorem [18]. Polar moment of inertia (J; cm4) was determined by adding CSMIap and CSMIml. Section modulus (Z; cm3) in the anterior-posterior and medial-lateral directions was calculated by dividing CSMIap and CSMIml by the furthest
distance from the neutral axis in the anterior-posterior and medial-lateral directions, respectively.
4 5 6 7 8 9 10 11 12 13 14 15 16 17 18 19 20 21 22 23 24 25 26 27 28 29 30 31 32 33 34 35 36 37 38 39 40 41 42 43 44 45 46 47 48 49 50 51 52 53 54 55 56 57 58 59
images and one research assistant conducted all image analysis. In our laboratory, the reproducibility of the cortical bone architecture and muscle volume estimates ranges from 0.5 to 2.6 % [19, 20]. To assess the reproducibility of femur length measurements by MRI, five children (6 to 12 years) were tested twice within 1 week. Tests were either on the same day or on a separate day. Femur length estimates from the repeat tests were identical.
Statistical analysis
Data were analyzed using SPSS (Version 22.0, Chicago, IL). Descriptive statistics for all
variables were conducted to screen for outliers and to assess normality using the Shapiro Wilk test. Sex differences in physical characteristics, including muscle volume and measures of trabecular and cortical bone architecture, were tested using independent t-tests for normally
distributed data and Mann Whitney U tests otherwise. Height, body mass and BMI percentiles were compared to their respective 50th age- and sex-based percentile using a one-sample t-test.
Sex by Tanner stage comparisons were conducted using the Chi-square test of independence.
Zero-order correlation analysis was used to assess relationships between muscle volume and
measures of trabecular and cortical bone architecture and to screen for multicollinearity among
the predictors of bone architecture (i.e., muscle volume, age, femur length, sex, physical activity and calcium intake). Multiple linear regression was used to determine the amount of variance in measures of bone architecture explained by muscle volume after controlling for femur length,
3 4 5 6 7 8 9 10 11 12 13 14 15 16 17 18 19 20 21 22 23 24 25 26 27 28 29 30 31 32 33 34 35 36 37 38 39 40 41 42 43 44 45 46 47 48 49 50 51 52 53 54 55 56 57 58 59
0.78 to 0.85, respectively, all p < 0.01), they were more strongly related to femur length. Muscle volume was also strongly correlated with femur length (r = 0.91, p < 0.001), resulting in a high variance inflation factor when both variables were included in regression models (> 6).
Therefore, a scaling factor was created to determine the contribution of muscle volume to
variability in measures of trabecular and cortical bone architecture independent of femur length. The scaling factor was created using a log-log regression analysis [21]. Muscle volume and femur length were both natural log transformed and the transformed muscle volume was regressed on transformed femur length. The regression slope (2.77) represents the power by which femur length was raised to reduce collinearity. The resulting index (muscle volume/femur length2.77) was unrelated to femur length (r= 0.03) suggesting that it would be independent of femur length in a regression model. In addition, when it was included in a regression model with femur length, sex, MVPA and calcium intake, the variance inflation factor was low (< 1.5). Standardized (β) coefficients and partial correlations were reported to express the degree of variance in measures of bone architecture explained by a variable while controlling for the other covariates. Alpha level was set at 0.05.
Results
Fifty one children (n = 25 boys and 26 girls) were enrolled in the study. Four boys were
excluded because they did not complete diet records. One boy was excluded because he did not
complete MRI testing. Five girls were excluded because they had a Tanner stage > 2. One girl
was excluded because she did not complete the MRI testing. Twenty boys and twenty girls were
4 5 6 7 8 9 10 11 12 13 14 15 16 17 18 19 20 21 22 23 24 25 26 27 28 29 30 31 32 33 34 35 36 37 38 39 40 41 42 43 44 45 46 47 48 49 50 51 52 53 54 55 56 57 58 59
which were log transformed before statistical analyses were conducted. However, non-transformed physical activity data are reported in Table 1 for easier comparison with other studies. There were no differences in age, Tanner stages, height, body mass or BMI, or age- and sex-based percentiles for height, body mass or BMI between boys and girls. Percentiles for height, body mass, and BMI were not different from the 50th age- and sex-based percentiles (p > 0.05). There were also no differences in any measure of physical activity or calcium intake between boys and girls (p > 0.05). There were no differences in measures of trabecular and cortical bone architecture between boys and girls (p > 0.05), as shown in Table 2.
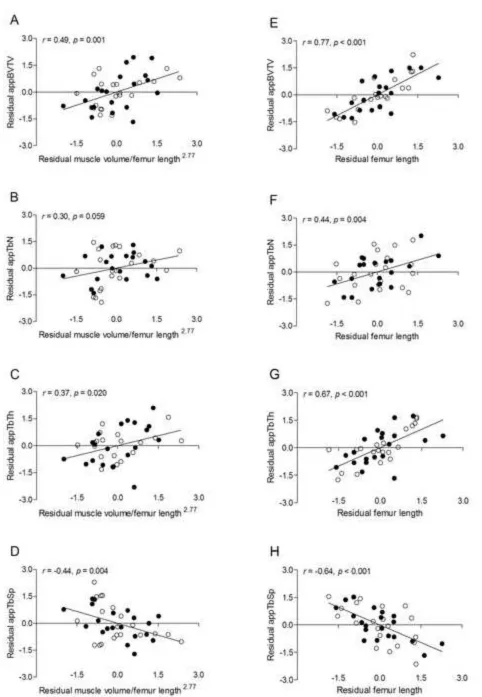
Zero-order correlations between measures of trabecular and cortical bone architecture and muscle volume, femur length, sex, MVPA and calcium intake are in Table 3. Muscle volume
was moderately-to-strongly and positively related to appBV/TV, appTb.N and appTb.Th and
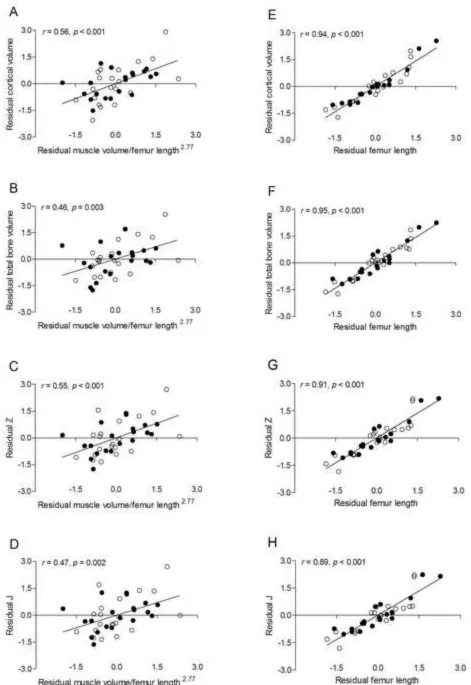
moderately-to-strongly and negatively related to appTb.Sp (all p < 0.001). Femur length was also moderately-to-strongly and positively related to appBV/TV, appTb.N and appTb.Th and moderately-to-strongly and negatively related to appTb.Sp (all p < 0.01). These relationships are demonstrated by scatter plots in Figure 1. Muscle volume and femur length were strongly and
positively related to cortical volume, total volume, Z and J (all p < 0.001). These relationships are demonstrated by scatter plots in Figure 2. No other variables were significantly correlated with measures of trabecular or cortical bone architecture.
Results from the multiple regression analysis with muscle volume/femur length2.77, femur length, sex, MVPA and calcium intake as independent variables and measures of trabecular bone architecture as dependent variables are reported in Table 4. The only significant predictors of
3 4 5 6 7 8 9 10 11 12 13 14 15 16 17 18 19 20 21 22 23 24 25 26 27 28 29 30 31 32 33 34 35 36 37 38 39 40 41 42 43 44 45 46 47 48 49 50 51 52 53 54 55 56 57 58 59
0.004); however, muscle volume/femur length2.77 was only marginally insignificant (p = 0.059). The relationships are demonstrated by scatter plots of residuals in Figure 3.
Results from the multiple regression analysis with muscle volume/femur length2.77, femur length, sex, MVPA and calcium intake as independent variables and measures of cortical bone architecture as dependent variables are reported in Table 5. The only significant predictors of measures of cortical bone architecture were muscle volume/femur length2.77 (all p < 0.01) and femur length (all p < 0.001). The relationships are demonstrated by scatter plots of residuals in Figure 4.
For each of the multiple regression models, the patterns of the relationships were the same irrespective of the type of physical activity (i.e., total physical activity or MVPA) or unit of physical activity (i.e., counts/d, min/d or counts/min/d) included in the model.
Discussion
To our knowledge, this is the first study to examine whether muscle is related to measures of trabecular bone architecture in children. A primary finding was that midthigh muscle volume was positively related to appBV/TV, appTb.N and appTb.Th and negatively related to appTb.Sp in the distal femur of pre and early-pubertal children. The present study is
also the first to determine if the relationship between muscle volume and trabecular bone
architecture is different than the relationship between muscle volume and cortical bone
architecture in children. Midthigh muscle volume was more strongly related to measures of
cortical than trabecular bone architecture. However, the magnitude of the disparity in the
4 5 6 7 8 9 10 11 12 13 14 15 16 17 18 19 20 21 22 23 24 25 26 27 28 29 30 31 32 33 34 35 36 37 38 39 40 41 42 43 44 45 46 47 48 49 50 51 52 53 54 55 56 57 58 59
were statistically controlled. The findings suggest that muscle volume is an independent contributor to the development of trabecular and cortical bone architecture in children.
The moderate-to-strong relationship between muscle volume and trabecular bone
architecture in children that was observed in the present study is consistent with the pattern reported in animals [22, 23] and humans [24, 25]. For example, muscle paralysis induced by
botulinum toxin has been shown to decrease trabecular thickness of the mandible in rats and
decrease BV/TV, Tb.N and Tb.Th and increase in Tb.Sp in the proximal tibia of mice [23].
Conversely, muscle contraction induced by electrical stimulation has been shown to blunt the
loss of BV/TV and Tb.N associated with hindlimb suspension in rats [26]. In humans,
conditions that result in a marked loss of muscle volume and strength in adults or poor accretion
in children, such as spinal cord injury [25] and cerebral palsy [16], are associated with impaired
trabecular bone architecture. Moreover, diminished trabecular bone architecture is associated
with low muscle volume and low muscle strength [27]. In addition, relationships between
appendicular muscle volume predicted by dual-energy X-ray absorptiometry and measures of
trabecular bone architecture have been observed in men and women 20-97 years of age [28].
The positive correlations between muscle and measures of cortical bone architecture in
the present study are consistent with previous reports [7, 9, 10, 29-31]. A positive moderate correlation between muscle cross sectional area and tibial cortical area was observed in 13 year
olds with different ethnicities (r ranged from 0.45 – 0.60, p < 0.001) [29]. A moderate-to-strong
relationship between muscle (or lean mass) and cortical bone architecture has also been reported
in adult athletes and non-athletes [7], chronic stroke patients [30], patients with spinal cord injury
[31], and children, adolescents and young adults [9, 10]. Despite the differences in research
3 4 5 6 7 8 9 10 11 12 13 14 15 16 17 18 19 20 21 22 23 24 25 26 27 28 29 30 31 32 33 34 35 36 37 38 39 40 41 42 43 44 45 46 47 48 49 50 51 52 53 54 55 56 57 58 59
although midthigh muscle volume was not as strongly related to measures of trabecular bone
architecture (r ranged from 0.53 to 0.81) as it was to measures of cortical bone architecture (r
ranged from 0.92 to 0.96), the relationships were still moderate-to-strong. The disparity suggests that muscle volume may be more closely linked to cortical than trabecular bone. However, the degree of the discrepancy was reduced substantially when femur length was statistically controlled (partial r ranged from -0.44 to 0.49 for trabecular bone architecture and -0.47 to 0.56 for cortical bone architecture). Therefore, it appears that the discrepancy in muscle’s
relationship with trabecular vs. cortical bone is driven, in large part, by the dependence of the cortical bone architecture measures on femur length. It is also possible that the difference in the strength of the relationships may be linked to the muscle and bone sites studied. Trabecular bone architecture was assessed in the distal femur, whereas cortical bone architecture and muscle
volume were assessed at the level of the midshaft of the femur. While the shaft of the femur is an attachment site for many thigh muscles (i.e., vastus intermedius, lateralis and medialis,
4 5 6 7 8 9 10 11 12 13 14 15 16 17 18 19 20 21 22 23 24 25 26 27 28 29 30 31 32 33 34 35 36 37 38 39 40 41 42 43 44 45 46 47 48 49 50 51 52 53 54 55 56 57 58 59
discriminate individuals who have osteoporotic fractures from those who do not have fracture [34].
To our knowledge, this is also the first study to examine the relationship between a measure of bone size (i.e., bone length) and measures of trabecular bone architecture in children.
Femur length, like midthigh muscle volume, was moderately-to-strongly and positively related to appBV/TV, appTb.N and appTb.Th and negatively related to appTb.Sp in the distal femur of pre and early-pubertal children. Also, similar to muscle volume, femur length was not as strongly related to measures of trabecular bone architecture as it was to measures of cortical bone architecture. Because femur length was highly correlated with muscle volume, the unique variance in trabecular bone architecture and cortical bone architecture explained by muscle
volume vs. femur length is difficult to separate. In an attempt to resolve the issue of collinearity, muscle volume was scaled for femur length (i.e., muscle volume/femur length2.77). When femur length was included in a multiple regression model with muscle volume/femur length2.77, sex, physical activity and calcium intake, femur length was a significant predictor of appBV/TV, appTb.N and appTb.Sp. This finding suggests that femur length is related to measures of trabecular and cortical bone architecture independent of muscle volume. Future studies that determine if measures of trabecular and cortical bone architecture track changes in muscle due to
intervention, such as resistance training, or unloading due to a neurological insult, such as spinal
cord injury, would provide valuable insight into their relationship with muscle independent of
bone size or general growth.
Another important finding in the present study was that there was no detectable sex-effect
on the relationship between muscle and bone architecture. Although boys are stronger than girls
3 4 5 6 7 8 9 10 11 12 13 14 15 16 17 18 19 20 21 22 23 24 25 26 27 28 29 30 31 32 33 34 35 36 37 38 39 40 41 42 43 44 45 46 47 48 49 50 51 52 53 54 55 56 57 58 59
in pre- and early-pubertal children [36, 37]. Sex hormones have been shown to affect the muscle-bone relationship, but this influence may not be observed until puberty. In a study of 318
boys and girls 6 to 22 years of age, Schoenau et al. [36] reported that girls have higher cortical
area than boys at the onset of puberty due to the surge in estrogen. On the other hand, another
cross-sectional comparison of children through young adults (6 to 21 years of age) suggests that
appBV/TV and appTb.Th become higher and appTb.Sp becomes lower in boys during late
puberty and this may be related to the surge in testosterone in boys [38].
One of the strengths of the present study was that the independent relationship between muscle volume and bone architecture was examined while muscle volume was scaled for femur length. This allowed us to control muscle volume for femur length while avoiding the collinearity associated with the two variables. Evaluating bone architecture’s relationship with muscle volume while statistically controlling for physical activity was another strength of the study. High levels of physical activity, especially MVPA, have a positive influence on muscle [39] and bone [40-42]. Therefore, it is plausible that the relationship between muscle and bone architecture is driven, at least in part, by physical activity. However, the relationship existed
even when total physical activity or MVPA was used as a covariate in a regression model. Statistically controlling for calcium intake is another strength of the study because higher bone
mineral content is seen in children with a regular dietary intake of calcium [43]. Moreover, there
is evidence that adolescent boys retain more calcium than girls [44]. On the other hand, calcium
intake is not associated with increases in lean mass [45]. Although it is plausible that calcium
intake can cause discord in the relationship between muscle and bone, the relationships between
4 5 6 7 8 9 10 11 12 13 14 15 16 17 18 19 20 21 22 23 24 25 26 27 28 29 30 31 32 33 34 35 36 37 38 39 40 41 42 43 44 45 46 47 48 49 50 51 52 53 54 55 56 57 58 59
We acknowledge that this study has limitations not already mentioned. One is the
cross-sectional design which does not allow us to make inferences about cause and effect. Although cortical bone was strongly related to muscle volume in the present study, some studies suggest
that cortical bone is more strongly related to impact loading than the bone strain generated by muscle forces [46]. There is also evidence that changes in cortical bone architecture occur before changes in muscle area during growth [47]. Therefore, additional studies are needed to determine if changes in bone architecture track changes in muscle volume that occur with growth or with intervention. A second limitation is that the sample size was small and restricted to
3 4 5 6 7 8 9 10 11 12 13 14 15 16 17 18 19 20 21 22 23 24 25 26 27 28 29 30 31 32 33 34 35 36 37 38 39 40 41 42 43 44 45 46 47 48 49 50 51 52 53 54 55 56 57 58 59
In summary, the findings from the present study suggest that midthigh muscle volume is related to measures of trabecular bone architecture in the distal femur and measures of cortical bone architecture in the midfemur. The findings also suggest that the relationship of bone architecture with midthigh muscle volume is not different in pre and early-pubertal boys and
girls. The relationship remained after controlling for femur length, suggesting that it may not be driven solely by general growth. Although midthigh muscle volume is more strongly related to cortical bone architecture in the midfemur than trabecular bone architecture in the distal femur, the reason for the discrepancy is due, in large part, to the greater dependence of cortical bone architecture measures on femur length. Longitudinal studies that track changes in trabecular and cortical bone architecture, muscle volume and bone length and intervention studies that facilitate increases in muscle size and strength would help us confirm whether muscle has a unique relationship with trabecular and cortical bone architecture in children.
Acknowledgments
We are thankful to the children who participated in our study and their families for their
time and cooperation. This study was funded by the National Institutes of Health (HD071397
and HD505030) and the National Osteoporosis Foundation.
References
[1] Heaney RP, Abrams S, Dawson-Hughes B, Looker A, Marcus R, Matkovic V, Weaver C.
Peak Bone Mass. Osteoporos Int 2000;11: 985-1009.
[2] Modlesky CM, Lewis RD. Does exercise during growth have a long-term effect on bone
4 5 6 7 8 9 10 11 12 13 14 15 16 17 18 19 20 21 22 23 24 25 26 27 28 29 30 31 32 33 34 35 36 37 38 39 40 41 42 43 44 45 46 47 48 49 50 51 52 53 54 55 56 57 58 59
[3] Ciarelli TE, Fyhrie DP, Schaffler MB, Goldstein SA. Variations in three-dimensional
cancellous bone architecture of the proximal femur in female hip fractures and in controls. J
Bone Miner Res 2000;15: 32-40.
[4] Crabtree NJ, Arabi A, Bachrach LK, Fewtrell M, El-Hajj Fuleihan G, Kecskemethy HH, Jaworski M, Gordon CM, International Society for Clinical D. Dual-energy X-ray absorptiometry interpretation and reporting in children and adolescents: the revised 2013 ISCD Pediatric Official Positions. J Clin Densitom 2014;17: 225-42.
[5] Adams JE, Engelke K, Zemel BS, Ward KA, International Society of Clinical D. Quantitative computer tomography in children and adolescents: the 2013 ISCD Pediatric Official Positions. J Clin Densitom 2014;17: 258-74.
[6] Jiang Y, Zhao J, Augat P, Ouyang X, Lu Y, Majumdar S, Genant HK. Trabecular bone
mineral and calculated structure of human bone specimens scanned by peripheral quantitative
computed tomography: relation to biomechanical properties. J Bone Miner Res 1998;13:
1783-90.
[7] Rittweger J, Beller G, Ehrig J, Jung C, Koch U, Ramolla J, Schmidt F, Newitt D,
Majumdar S, Schiessl H, Felsenberg D. Bone-muscle strength indices for the human lower leg.
Bone 2000;27: 319-26.
[8] Schoenau E. The "functional muscle-bone unit": a two-step diagnostic algorithm in
pediatric bone disease. Pediatr Nephrol 2005;20: 356-9.
[9] Leonard MB, Elmi A, Mostoufi-Moab S, Shults J, Burnham JM, Thayu M, Kibe L,
Wetzsteon RJ, Zemel BS. Effects of sex, race, and puberty on cortical bone and the functional
muscle bone unit in children, adolescents, and young adults. J Clin Endocrinol Metab 2010;95:
3 4 5 6 7 8 9 10 11 12 13 14 15 16 17 18 19 20 21 22 23 24 25 26 27 28 29 30 31 32 33 34 35 36 37 38 39 40 41 42 43 44 45 46 47 48 49 50 51 52 53 54 55 56 57 58 59
[10] Hogler W, Blimkie CJ, Cowell CT, Inglis D, Rauch F, Kemp AF, Wiebe P, Duncan CS,
Farpour-Lambert N, Woodhead HJ. Sex-specific developmental changes in muscle size and bone
geometry at the femoral shaft. Bone 2008;42: 982-9.
[11] Kuczmarski RJ, Ogden CL, Grummer-Strawn LM, Flegal KM, Guo SS, Wei,, R. M, Z.,,
Curtin LR, Roche AF, Johnson CL. CDC growth charts: United States. Adv Data 2000: 1-27.
[12] Tanner JA. Growth and Adolescence: Oxford: Blackwell Scientific Publications; 1962.
[13] Trost SG, Pate RR, Freedson PS, Sallis JF, Taylor WC. Using objective physical activity
measures with youth: how many days of monitoring are needed? Med Sci Sports Exerc 2000;32:
426-31.
[14] Puyau MR, Adolph AL, Vohra FA, Zakeri I, Butte NF. Prediction of activity energy
expenditure using accelerometers in children. Med Sci Sports Exerc 2004;36: 1625-1631.
[15] Johnson DL, Miller F, Subramanian P, Modlesky CM. Adipose tissue infiltration of
skeletal muscle in children with cerebral palsy. J Pediatr 2009;154: 715-720.
[16] Modlesky CM, Subramanian P, Miller F. Underdeveloped trabecular bone
microarchitecture is detected in children with cerebral palsy using high-resolution magnetic
resonance imaging. Osteoporos Int 2008;19: 169-76.
[17] Majumdar S, Genant HK, Grampp S, Newitt DC, Truong VH, Lin JC, Mathur A.
Correlation of trabecular bone structure with age, bone mineral density, and osteoporotic status:
in vivo studies in the distal radius using high resolution magnetic resonance imaging. J Bone
Miner Res 1997;12: 111-8.
[18] Turner CH, Burr DB. Experimental techniques for bone mechanics. In: Cowen SC,
4 5 6 7 8 9 10 11 12 13 14 15 16 17 18 19 20 21 22 23 24 25 26 27 28 29 30 31 32 33 34 35 36 37 38 39 40 41 42 43 44 45 46 47 48 49 50 51 52 53 54 55 56 57 58 59
[19] Modlesky CM, Kanoff SA, Johnson DL, Subramanian P, Miller F. Evaluation of the
femoral midshaft in children with cerebral palsy using magnetic resonance imaging. Osteoporos
Int 2009;20: 609-15.
[20] Modlesky CM, Cavaiola ML, Smith JJ, Rowe DA, Johnson DL, Miller F. A DXA-based
mathematical model predicts midthigh muscle mass from magnetic resonance imaging in
typically developing children but not in those with quadriplegic cerebral palsy. J Nutr 2010;140:
2260-5.
[21] Wells JC, Cole TJ. Adjustment of fat-free mass and fat mass for height in children aged 8 y. Int J Obes Relat Metab Disord 2002;26: 947-52.
[22] Tsai CY, Huang RY, Lee CM, Hsiao WT, Yang LY. Morphologic and bony structural
changes in the mandible after a unilateral injection of botulinum neurotoxin in adult rats. J Oral
Maxillofac Surg 2010;68: 1081-7.
[23] Poliachik SL, Bain SD, Threet D, Huber P, Gross TS. Transient muscle paralysis disrupts
bone homeostasis by rapid degradation of bone morphology. Bone 2010;46: 18-23.
[24] Pollock NK, Laing EM, Taylor RG, Baile CA, Hamrick MW, Hall DB, Lewis RD.
Comparisons of trabecular and cortical bone in late adolescent black and white females. J Bone
Miner Metab 2011;29: 44-53.
[25] Slade JM, Bickel CS, Modlesky CM, Majumdar S, Dudley GA. Trabecular bone is more
deteriorated in spinal cord injured versus estrogen-free postmenopausal women. Osteoporos Int
2005;16: 263-72.
[26] Lam H, Qin YX. The effects of frequency-dependent dynamic muscle stimulation on
3 4 5 6 7 8 9 10 11 12 13 14 15 16 17 18 19 20 21 22 23 24 25 26 27 28 29 30 31 32 33 34 35 36 37 38 39 40 41 42 43 44 45 46 47 48 49 50 51 52 53 54 55 56 57 58 59
[27] Szulc P, Blaizot S, Boutroy S, Vilayphiou N, Boonen S, Chapurlat R. Impaired bone
microarchitecture at the distal radius in older men with low muscle mass and grip strength: the
STRAMBO study. J Bone Miner Res 2013;28: 169-78.
[28] Lebrasseur NK, Achenbach SJ, Melton LJ, 3rd, Amin S, Khosla S. Skeletal muscle mass
is associated with bone geometry and microstructure and serum insulin-like growth factor
binding protein-2 levels in adult women and men. J Bone Miner Res 2012;27: 2159-69.
[29] Micklesfield LK, Norris SA, Pettifor JM. Determinants of bone size and strength in
13-year-old South African children: The influence of ethnicity, sex and pubertal maturation. Bone
2011;48: 777-85.
[30] Pang MY, Ashe MC, Eng JJ. Tibial bone geometry in chronic stroke patients: influence
of sex, cardiovascular health, and muscle mass. J Bone Miner Res 2008;23: 1023-30.
[31] Modlesky CM, Slade JM, Bickel CS, Meyer RA, Dudley GA. Deteriorated geometric
structure and strength of the midfemur in men with complete spinal cord injury. Bone 2005;36:
331-9.
[32] Majumdar S, Kothari M, Augat P, Newitt DC, Link TM, Lin JC, Lang T, Lu Y, Genant
HK. High-resolution magnetic resonance imaging: three-dimensional trabecular bone
architecture and biomechanical properties. Bone 1998;22: 445-54.
4 5 6 7 8 9 10 11 12 13 14 15 16 17 18 19 20 21 22 23 24 25 26 27 28 29 30 31 32 33 34 35 36 37 38 39 40 41 42 43 44 45 46 47 48 49 50 51 52 53 54 55 56 57 58 59
[34] Link TM, Majumdar S, Augat P, Lin JC, Newitt D, Lu Y, Lane NE, Genant HK. In vivo high resolution MRI of the calcaneus: differences in trabecular structure in osteoporosis patients. J Bone Miner Res 1998;13: 1175-82.
[35] Newman DG, Pearn J, Barnes A, Young CM, Kehoe M, Newman J. Norms for hand grip strength. Arch Dis Child 1984;59: 453-9.
[36] Schoenau E, Neu CM, Mokov E, Wassmer G, Manz F. Influence of puberty on muscle area and cortical bone area of the forearm in boys and girls. J Clin Endocrinol Metab 2000;85: 1095-8.
[37] Schoenau E, Neu CM, Beck B, Manz F, Rauch F. Bone mineral content per muscle cross-sectional area as an index of the functional muscle-bone unit. J Bone Miner Res 2002;17: 1095-101.
[38] Kirmani S, Christen D, van Lenthe GH, Fischer PR, Bouxsein ML, McCready LK, Melton LJ, 3rd, Riggs BL, Amin S, Muller R, Khosla S. Bone structure at the distal radius during adolescent growth. J Bone Miner Res 2009;24: 1033-42.
[39] MacDougall JD, Ward GR, Sale DG, Sutton JR. Biochemical adaptation of human
skeletal muscle to heavy resistance training and immobilization. J Appl Physiol Respir Environ
Exerc Physiol 1977;43: 700-3.
[40] Fuchs RK, Bauer JJ, Snow CM. Jumping improves hip and lumbar spine bone mass in
prepubescent children: a randomized controlled trial. J Bone Miner Res 2001;16: 148-56.
[41] Janz KF, Burns TL, Levy SM, Torner JC, Willing MC, Beck TJ, Gilmore JM, Marshall
TA. Everyday activity predicts bone geometry in children: the Iowa bone development study.
3 4 5 6 7 8 9 10 11 12 13 14 15 16 17 18 19 20 21 22 23 24 25 26 27 28 29 30 31 32 33 34 35 36 37 38 39 40 41 42 43 44 45 46 47 48 49 50 51 52 53 54 55 56 57 58 59
[42] Bailey DA, McKay HA, Mirwald RL, Crocker PR, Faulkner RA. A six-year longitudinal
study of the relationship of physical activity to bone mineral accrual in growing children: the
university of Saskatchewan bone mineral accrual study. J Bone Miner Res 1999;14: 1672-9.
[43] Lee WTK, Leung SSF, Lui SSH, Lau J. Relationship between long-term calcium intake
and bone mineral content of children aged from birth to 5 years. Br J Nutr 1993;70: 235-248.
[44] Braun M, Martin BR, Kern M, McCabe GP, Peacock M, Jiang Z, Weaver CM. Calcium
retention in adolescent boys on a range of controlled calcium intakes. Am J Clin Nutr 2006;84:
414-8.
[45] Smilowitz JT, Wiest MM, Teegarden D, Zemel MB, German JB, Van Loan MD. Dietary
fat and not calcium supplementation or dairy product consumption is associated with changes in
anthropometrics during a randomized, placebo-controlled energy-restriction trial. Nutr Metab
(Lond) 2011;8: 67.
[46] Schipilow JD, Macdonald HM, Liphardt AM, Kan M, Boyd SK. Bone
micro-architecture, estimated bone strength, and the muscle-bone interaction in elite athletes: an
HR-pQCT study. Bone 2013;56: 281-9.
[47] Xu L, Nicholson P, Wang Q, Alen M, Cheng S. Bone and muscle development during
puberty in girls: a seven-year longitudinal study. J Bone Miner Res 2009;24: 1693-8.
[48] Troiano RP, Berrigan D, Dodd KW, Masse LC, Tilert T, McDowell M. Physical activity in the United States measured by accelerometer. Med Sci Sports Exerc 2008;40: 181-8.
4 5 6 7 8 9 10 11 12 13 14 15 16 17 18 19 20 21 22 23 24 25 26 27 28 29 30 31 32 33 34 35 36 37 38 39 40 41 42 43 44 45 46 47 48 49 50 51 52 53 54 55 56 57 58 59
Text to Figures
Figure 1. Scatter plots demonstrating the unadjusted relationships between measures of trabecular bone architecture in the distal femur (i.e., appBV/TV, appTb.N, appTb.Th, and
appTb.Sp) and midthigh muscle volume (A-D) and femur length (E-H) in pre- and
early-pubertal boys ● and girls ○. Because no sex effect was detected, the solid line represents the regression line for the combined sample.
Figure 2. Scatter plots demonstrating the unadjusted relationships between measures of cortical bone architecture in the midfemur (i.e., cortical volume, total volume, J, and Z) and midthigh
muscle volume (A-D) and femur length (E-H) in pre- and early-pubertal boys ● and girls ○.
Because no sex effect was detected, the solid line represents the regression line for the combined sample.
Figure 3. Scatter plots demonstrating the relationships between measures of trabecular bone
architecture in the distal femur (i.e., appBV/TV, appTb.N, appTb.Th, and appTb.Sp) and 1) midthigh muscle volume/femur length2.77 while statistically controlling for femur length, sex, MVPA (min/d) and calcium intake (A-D) and 2) femur length while statistically controlling for midthigh muscle volume/femur length2.77, sex, MVPA (min/d) and calcium intake (E-H) in pre- and early-pubertal boys ● and girls ○. Because no sex effect was detected, the solid line
represents the regression line for the combined sample.
Figure 4. Scatter plots demonstrating the relationships between measures of cortical bone
3 4 5 6 7 8 9 10 11 12 13 14 15 16 17 18 19 20 21 22 23 24 25 26 27 28 29 30 31 32 33 34 35 36 37 38 39 40 41 42 43 44 45 46 47 48 49 50 51 52 53 54 55 56 57 58 59
muscle volume/femur length2.77 while statistically controlling for femur length, sex, MVPA (min/d) and calcium intake (A-D) and 2) femur length while statistically controlling for muscle volume/femur length2.77, sex, MVPA (min/d) and calcium intake (E-H) in pre- and early-pubertal boys ● and girls ○. Because no sex effect was detected, the solid line represents the
Table 1. Physical characteristics of pre- and early-pubertal typically developing children
Boys (n = 20)
Girls (n = 20)
p d
Age (y) 9.7 ± 1.6 10.0 ± 1.8 0.451 0.017
Tanner stage (1/2)
Pubic hair 17/3 16/4 0.677 0.129
Testicular-penile/Breast 17/3 15/5 0.429 0.247
Height (m) 1.38 ± 0.12 1.39 ± 0.11 0.765 0.174
Height percentile 53 ± 29 48 ± 21 0.494 0.222
Body mass (kg) 33.2 ± 7.7 33.4 ± 7.7 0.926 0.026
Body mass percentile 57 ± 26 45 ± 24 0.195 0.437
BMI (kg/m2) 17.2 ± 1.8 17.1 ± 2.3 0.837 0.069
BMI percentile 54 ± 27 45 ± 28 0.283 0.345
Midthigh muscle volume (cm3) 891 ± 267 896 ± 250 0.945 0.019 Femur length (m) 0.378 ± 0.040 0.385 ± 0.037 0.500 0.181
Total physical activity (counts/d)
480,370 ± 205,490 458,902 ± 197,209 0.738 0.107 MVPA (counts/d) 296,220 ± 193,585 266,999 ± 167,695 0.613 0.162
MVPA (min/d) 92 ± 44 88 ± 35 0.788 0.077
MVPA (counts/min/d) 3068 ± 612 2908 ± 549 0.389 0.276
Calcium intake (mg/d) 989 ± 308 899 ± 220 0.212 0.352
Table 2. Measures of trabecular and cortical bone architecture Boys
(n = 20)
Girls (n = 20)
p d
Trabecular bone architecture
appBV/TV 0.322 ± 0.027 0.320 ± 0.024 0.838 0.078
appTb.N (1/mm) 1.672 ± .063 1.683 ± 0.069 0.597 0.182
appTb.Th (mm) 0.192 ± 0.013 0.190 ± 0.012 0.534 0.160 appTb.Sp (mm) 0.407 ± 0.028 0.405 ± 0.030 0.856 0.069
Cortical bone architecture
Cortical volume (cm3) 26.6 ± 8.8 27.0 ± 8.5 0.861 0.046 Total bone volume (cm3) 42.0 ± 13.2 42.2 ± 12.1 0.960 0.016
Z (cm3) 0.722 ± 0.234 0.716 ± 0.239 0.873 0.025
J (cm4) 1.54 ± 0.68 1.54 ± 0.68 0.978 0.001
Table 3. Zero-order correlations demonstrating the relationships between bone architecture and muscle volume,
femur length, sex, physical activity and calcium intake
Muscle volume (cm3)
Femur length (m)
Sex MVPA
(min/d)
Calcium Intake (mg/d)
Trabecular bone architecture
appBV/TV .81* .72* .03 .17 -.06
appTb.N (1/mm) .53* .49** -.09 .23 -.23
appTb.Th (mm) .67* .57* .10 .07 .11
appTb.Sp (mm) -.71* -.63* .03 -.22 .16
Cortical bone architecture
Cortical vol (cm3) .96* .92* -.03 .15 -.16
Total vol (cm3) .94* .93* -.01 .21 -.18
Z (cm3) .94* .88* .01 .15 .-18
J (cm4) .92* .86* .01 .14 -.20
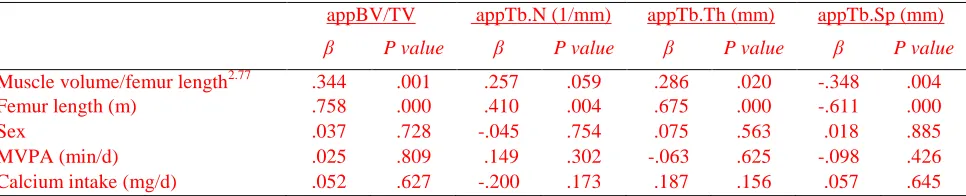
[image:31.612.75.559.120.298.2]Table 4. Predictors of trabecular bone architecture in the distal femur of typically developing children determined
using multiple regression analysis
appBV/TV appTb.N (1/mm) appTb.Th (mm) appTb.Sp (mm)
β P value β P value β P value β P value
Muscle volume/femur length2.77 .344 .001 .257 .059 .286 .020 -.348 .004
Femur length (m) .758 .000 .410 .004 .675 .000 -.611 .000
Sex .037 .728 -.045 .754 .075 .563 .018 .885
MVPA (min/d) .025 .809 .149 .302 -.063 .625 -.098 .426
Calcium intake (mg/d) .052 .627 -.200 .173 .187 .156 .057 .645
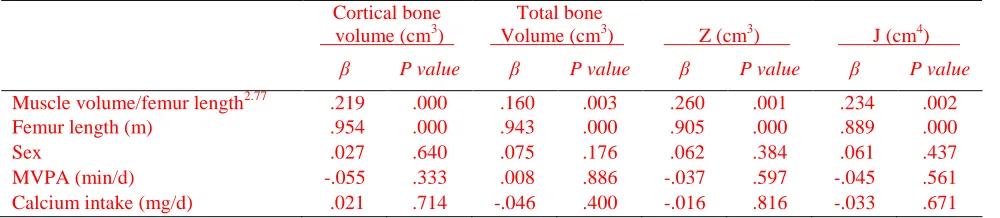
[image:32.612.74.557.117.215.2]Table 5. Predictors of cortical bone architecture in the midfemur of typically developing children determined using
multiple regression analysis
Cortical bone volume (cm3)
Total bone
Volume (cm3) Z (cm3)
J (cm4)
β P value β P value β P value β P value
Muscle volume/femur length2.77 .219 .000 .160 .003 .260 .001 .234 .002
Femur length (m) .954 .000 .943 .000 .905 .000 .889 .000
Sex .027 .640 .075 .176 .062 .384 .061 .437
MVPA (min/d) -.055 .333 .008 .886 -.037 .597 -.045 .561
Calcium intake (mg/d) .021 .714 -.046 .400 -.016 .816 -.033 .671