City, University of London Institutional Repository
Citation
:
Marshall, C. R., Jones, A., Denmark, T., Mason, K., Atkinson, J., Botting, N. and
Morgan, G. (2015). Deaf children's non-verbal working memory is impacted by their
language experience. Frontiers in Psychology, 6(00527), doi: 10.3389/fpsyg.2015.00527
This is the published version of the paper.
This version of the publication may differ from the final published
version.
Permanent repository link:
http://openaccess.city.ac.uk/13551/
Link to published version
:
http://dx.doi.org/10.3389/fpsyg.2015.00527
Copyright and reuse:
City Research Online aims to make research
outputs of City, University of London available to a wider audience.
Copyright and Moral Rights remain with the author(s) and/or copyright
holders. URLs from City Research Online may be freely distributed and
linked to.
City Research Online:
http://openaccess.city.ac.uk/
[email protected]
doi: 10.3389/fpsyg.2015.00527
Edited by:
Mary Rudner, Linköping University, Sweden
Reviewed by:
Mireille Besson, Centre National de la Recherche Scientifique, France Matt Hall, University of California, San Diego, USA
*Correspondence:
Gary Morgan, Division of Language and Communication Sciences, City University London, Northampton Square, London EC1V 0HB, UK [email protected]
†
These authors have contributed equally to this work.
Specialty section:
This article was submitted to Auditory Cognitive Neuroscience, a section of the journal Frontiers in Psychology
Received:30 January 2015
Accepted:13 April 2015
Published:05 May 2015
Citation:
Marshall C, Jones A, Denmark T, Mason K, Atkinson J, Botting N and Morgan G (2015) Deaf children’s non-verbal working memory is impacted by their language experience. Front. Psychol. 6:527. doi: 10.3389/fpsyg.2015.00527
Deaf children’s non-verbal working
memory is impacted by their
language experience
Chloë Marshall1 †, Anna Jones2 †, Tanya Denmark2, Kathryn Mason2, Joanna Atkinson2,
Nicola Botting3 and Gary Morgan3*
1Department of Psychology and Human Development, UCL Institute of Education, University College London, London, UK, 2Deafness, Cognition and Language Research Centre, University College London, London, UK,3Division of Language and
Communication Sciences, City University London, London, UK
Several recent studies have suggested that deaf children perform more poorly on working memory tasks compared to hearing children, but these studies have not been able to determine whether this poorer performance arises directly from deafness itself or from deaf children’s reduced language exposure. The issue remains unresolved because findings come mostly from (1) tasks that are verbal as opposed to non-verbal, and (2) involve deaf children who use spoken communication and therefore may have experienced impoverished input and delayed language acquisition. This is in contrast to deaf children who have been exposed to a sign language since birth from Deaf parents (and who therefore have native language-learning opportunities within a normal developmental timeframe for language acquisition). A more direct, and therefore stronger, test of the hypothesis that the type and quality of language exposure impact working memory is to use measures of non-verbal working memory (NVWM) and to compare hearing children with two groups of deaf signing children: those who have had native exposure to a sign language, and those who have experienced delayed acquisition and reduced quality of language input compared to their native-signing peers. In this study we investigated the relationship between NVWM and language in three groups aged 6–11 years: hearing children (n=28), deaf children who were native users of British Sign Language (BSL;n=8), and deaf children who used BSL but who were not native signers (n = 19). We administered a battery of non-verbal reasoning, NVWM, and language tasks. We examined whether the groups differed on NVWM scores, and whether scores on language tasks predicted scores on NVWM tasks. For the two executive-loaded NVWM tasks included in our battery, the non-native signers performed less accurately than the native signer and hearing groups (who did not differ from one another). Multiple regression analysis revealed that scores on the vocabulary measure predicted scores on those two executive-loaded NVWM tasks (with age and non-verbal reasoning partialled out). Our results suggest that whatever the language modality—spoken or signed—rich language experience from birth, and the good language skills that result from this early age of acquisition, play a critical role in the development of NVWM and in performance on NVWM tasks.
Introduction
Working memory is the capacity to encode, store, manipulate and recall information, and is essential for cognition (Baddeley and Hitch, 1974). As Hirshorn et al.(2012 p. 85) write, “One would be hard pressed to name any higher level cognitive abil-ity that does not foundationally depend on holding information in memory and being able to manipulate and integrate it with knowledge from long-term memory.” Not surprisingly, there-fore, individual differences in working memory are associated with variation in such diverse activities as reasoning ability ( Kyl-lonen and Christal, 1990), the acquisition of computer program-ming skills (Shute, 1991), and a whole set of activities that require language, such as reading comprehension (Daneman and Car-penter, 1980), novel word learning (Kwok and Ellis, 2014), syn-tactic processing (King and Just, 1991), second language learning (Kormos and Sáfár, 2008), acquiring an artificial language (Kapa and Colombo, 2014), and even adjusting to non-native speakers’ lexical reference (Lev-Ari, 2015). Furthermore, individual differ-ences in children’s working memory are closely linked to their academic achievement (Alloway et al., 2005; Engel de Abreu et al., 2014). In the recent literature, the term working memory has been used to describe only the complex and executive-loaded elements of memory, i.e., where concurrent maintenance and processing of information are required for task completion. The focus of the study reported in the current paper is the nature of the association between language and working memory in the wider sense, although we were particularly interested in the complex and executive-loaded tasks.
As is often the case when trying to understand the nature of associative relationships between cognitive variables, it is far from straightforward to establish causal direction, i.e., whether differences in working memory drive individual differences in language during development, or vice versa. Longitudinal studies of children’s vocabulary size have suggested that working mem-ory ability does indeed drive vocabulary development rather than the other way round (Avons et al., 1998). Mechanistically, the claim is that the phonological loop (a component of phonological working memory;Baddeley and Hitch, 1974) provides a tempo-rary means of storing new words, before they are consolidated in phonological long term memory (Baddeley et al., 1998). However, the strength of working memory as a predictor of vocabulary size declines with age (Gathercole et al., 1992) and is not found in all studies (Melby-Lervag et al., 2012).
A window onto the question of whether the causal influ-ence might also operate in the opposite direction, i.e., whether individual differences in language can drive differences in work-ing memory, comes from deaf children whose language learnwork-ing experience is very different from that of the vast majority of chil-dren. The incidence of significant congenital deafness is about 1 in 1000 live births in most developed countries, including the UK, although it may be 3–4 times higher in certain communi-ties or parts of the UK (Davis et al., 1997). Even mild deafness (defined as a hearing loss of 21–40 decibels) can cause difficul-ties accessing spoken language and have a detrimental effect on linguistic development. Hearing aids and cochlear implant tech-nology, while improving rapidly, do not offer access to the same
quality of speech that hearing children obtain naturally (Faulkner and Pisoni, 2013).
Sign languages such as British Sign Language (BSL)dooffer a fully accessible language form to deaf children who do not have co-occurring visual impairment, but the vast majority of deaf children (over 90%;Lederberg and Mobley, 1990) are born to hearing non-signing parents. This means that even in cases where hearing parents learn BSL and sign with their children from an early age, the quality and quantity of language input and interaction that they are able to provide is likely to be impoverished compared to that provided by deaf signing parents. Nevertheless, for deaf children born to deaf signing parents, who receive sign language input from birth, language acquisition can show remarkable parallels in onset, rate and patterns of devel-opment compared to hearing children who are learning spoken languages (seeChamberlain et al., 2000; Morgan and Woll, 2002; Schick et al., 2005 for reviews). Deaf children of deaf parents (i.e., native signers) are therefore a very interesting population theoretically, but they are also very difficult to recruit to research studies. Not only are there a very small number of children in this group, but measuring their skills requires carefully-designed tasks and a researcher fluent in the particular sign language under consideration (Lieberman and Mayberry, 2015).
The diversity of language input in the deaf population, both with respect to age of access to language (from birth, later in infancy/childhood) and language form (signed or spoken), allows researchers to investigate how individual differences in linguis-tic input can impact on working memory development. In the remainder of this introduction, we review studies that have inves-tigated working memory in deaf adults and children, identify the gaps in that literature, and motivate our own study.
A theme in the research literature on deaf people’s working memory to date is a division between two types of studies: those that have investigated memory for spoken material, and those that have studied memory for signed and/or non-linguistic visuo-spatial material. Measurement of working memory across modal-ities requires serious consideration. It cannot be assumed that performance on a task presented in two different modalities is directly comparable. Likewise it cannot be assumed that two tasks presented in the same modality are directly comparable. As we discuss below, both modality and the nature of the material affect recall in working memory tasks.
It is perhaps not surprising that studies where material is pre-sented auditorally find poorer recall by deaf participants in com-parison to hearing participants. For example,Fagan et al. (2007)
studied deaf children aged 6–14 years who received a cochlear implant between the ages of 1 and 6 years. Group means on spoken forward and backward digit span tasks were significantly lower than the standardized mean, with half the sample scoring below 1 SD from the mean on the forward task and the major-ity scoring below 1 SD from the mean on the backward task. Furthermore, scores on both span tasks were moderately corre-lated with vocabulary comprehension and non-word/rare-word reading scores. In another study,Burkholder and Pisoni (2003)
and lip reading strategies, in addition to speech), and compared them to a group of hearing children on spoken digit span tasks. Both deaf groups performed significantly more poorly than the hearing group. The digit span disadvantage for deaf participants has been found even when the task bypasses listening/speaking by being presented in written form (Parasnis et al., 1996), and when letters are used instead of digits (Wallace and Corballis, 1973).
A disadvantage for serially-presented linguistic material is also found when deaf participants undertake the digit span or letter span task in a sign language. Deaf native American Sign Lan-guage (ASL) signers recall on average only 5±1 digits in forward tasks, compared to hearers who recall an average of 7±2 digits
(Boutla et al., 2004; Bavelier et al., 2006).Hall and Bavelier(2010, p. 54) have concluded that “speech-based representations are bet-ter suited for the specific task of perception and memory encod-ing of a series of unrelated verbal items in serial order through the phonological loop.”Conway et al. (2009)go further and propose the “auditory scaffolding hypothesis,” whereby one’s experience with sound helps provide a scaffold for the development of those general cognitive abilities that are required for the representa-tion of temporal or sequential patterns. However, Bavelier and colleagues’ work shows thathearingEnglish-ASL bilingual adults also show the same disadvantage for sign span compared to spo-ken span (Bavelier et al., 2008), which challenges the auditory scaffolding hypothesis because these individuals have had rich auditory input since birth. In any case, it is clear that performance on spoken serial recall tasks may not be directly comparable to performance on signed serial recall tasks.
For non-linguistic material that is not processed using the phonological loop, but which, like linguistic material, is serial in nature, deaf signers have been shown to have an advantage com-pared to other groups. Deaf adult signers have longer forward spans than hearing non-signers on the visuo-spatial Corsi Block Test (Geraci et al., 2008).Wilson et al. (1997)showed that the advantage for deaf signers over hearing non-signers in the Corsi Block Test was also evident in 8–10 year-old children. Evidence that the working memory advantage might arise from using sign language, rather than from being deaf, comes from studies by
Capirci et al. (1998)andParasnis et al. (1996). The former study demonstrated that hearing children who were taught sign lan-guage at school performed on non-verbal working memory tasks better after 1 year than hearing children who were taught a spo-ken language (Capirci et al., 1998), while the latter study found that deaf orally-educated children did not have an advantage over hearing children (Parasnis et al., 1996).
When serial recall of material is not the only requirement of the working memory task, or indeed is not required at all, then the pattern of results looks different again. Differences havenot
been found between deaf signers and hearing non-signers on complex span tasks, which rely on some sort of processing of material in addition to serial maintenance. However, the difficulty of complex span tasks means that to date in the deafness and sign language literature they appear to have only been carried out with adults (e.g.,Boutla et al., 2004; Andin et al., 2013).
In summary, several recent studies have suggested that deaf children perform more poorly on working memory tasks compared to hearing children, but they have not been able to
determine whether this poorer performance arises directly from deafness itself or from deaf children’s reduced language exposure. The underlying cause of deaf children’s poor task performance remains unresolved because findings come mostly from (1) tasks that are verbal as opposed to non-verbal (e.g.,Burkholder and Pisoni, 2003; Fagan et al., 2007) and (2) deaf children who use spoken communication and who may therefore have experi-enced impoverished language input or have language develop-ment delay (e.g.,Burkholder and Pisoni, 2003; Fagan et al., 2007; Figueras et al., 2008; Beer et al., 2011; Hintermair, 2013). Such a group may potentially perform differently on working mem-ory tasks compared to deaf children who have been exposed to a sign language since birth from Deaf parents (and who there-fore have native language-learning opportunities within a nor-mal developmental timeframe for language acquisition). The role of age of language exposure in the wider neuro-cognitive abil-ities of deaf individuals has also been highlighted (Campbell et al., 2014). Moreover, studies using complex span tasks have not been reported, to the best of our knowledge, with deaf chil-dren. As mentioned earlier, recruiting and testing deaf children with a range of language experiences, and particularly those who are native signers, is a challenging task. However, doing so pro-vides important contrasts which enable us to start unpacking the influences of auditory experience and language background.
A more direct, and consequently stronger, test of the relation-ship between type and quality of language exposure and work-ing memory is therefore to use measures of non-verbal workwork-ing memory and to compare hearing children with two groups of deaf signing children: those who have had native exposure to a sign language, and those who have experienced delayed acqui-sition and reduced quality of sign language input compared to their native-signing peers. This is exactly what we set out to do in the present study. If it is language experience rather than deafness that impacts on working memory, then native deaf signers should pattern like hearing children and both groups should perform better than non-native signers. Furthermore, scores on language tasks should correlate with working memory scores. If, however, it is lack of auditory experience that causes poor working mem-ory, or if it is the case that comorbid memory difficulties occur with deafness, then both deaf groups should perform worse than the hearing group. If neither language experience nor deafness has an impact on working memory, then the three groups would not be expected to differ from one another, and no relationship should be found between language and working memory scores.
Methods
Participants
Twenty seven deaf children aged 6–11 years old (16 boys) were recruited. All had profound and/or severe hearing loss in both ears, with the majority (n = 24) being profoundly deaf in both
on their exposure to, and use of, BSL, they were divided into two groups: native signers (n=8) and non-native signers (n=19).
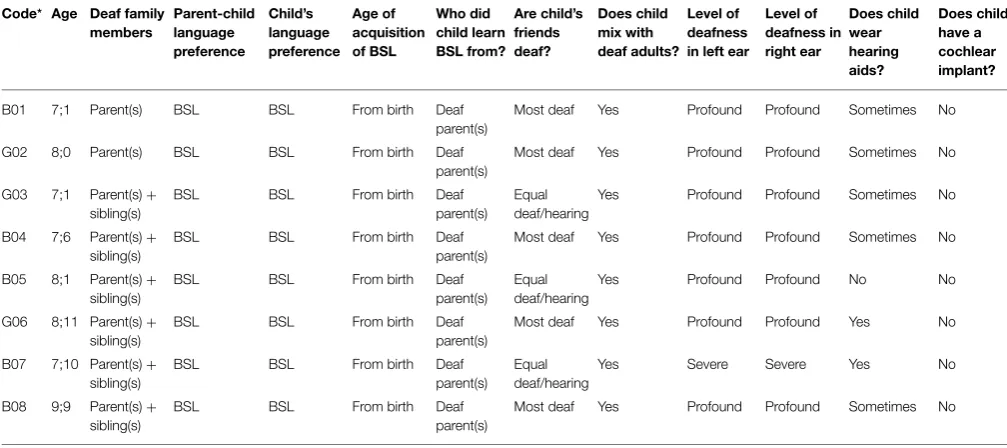
To be included in the native signer group, participants had to have at least one deaf parent (some also had one or more deaf sib-lings, but this was not a requirement for inclusion) and to have been exposed to BSL from their parent(s) since birth. In addi-tion, the parents of these children had to report that BSL was the language in which their child preferred to communicate and was the language in which the child communicated with his/her deaf parent(s). Although not part of the selection criteria, the eight children in this group (5 boys) were all reported to mix regularly with deaf adults and either half or the majority of their friends were reported to be deaf. Please seeTable 1for further details.
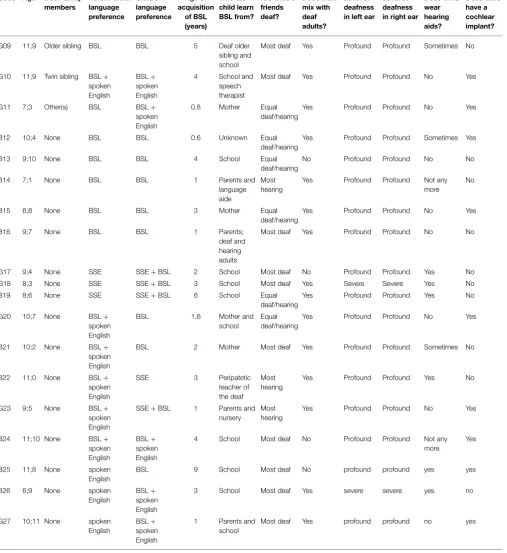
The remaining 19 deaf participants (11 boys) were considered to be non-native signers. This group was characterized by a later age of acquisition of BSL than the native-signer group (M=2;11 years,SD=2;2 years, range = 0;7–9;0 years), and the majority (n = 13) were reported to use sign-supported English (SSE) or
spoken English alongside BSL as their preferred language and with their hearing parents. As Table 2shows, this was a more heterogeneous group with respect to language background and current language use than the native-signer group, as is to be expected.
Twenty eight hearing participants of the same age—6 to 11 years (16 boys)—were also recruited. All were reported by par-ents/and or teachers to have no hearing difficulties or learning difficulties of any kind, and all had English as their first language. The mean age of the deaf participants was 9;2 years (SD= 1;8), and of the hearing participants was 9;0 (SD=1;5). There was no
significant age difference between the deaf and hearing groups,
t(53) = 0.320,p = 0.751. However, the native signers (M =
8;0,SD=0;11) were significantly younger than the non-native signers (M = 9;7,SD= 1;9),t(25) = 2.391,p = 0.025, and
marginally younger than the hearing participants,t(34) =1.802,
p = 0.080. The non-native signer and hearing groups did not
differ on age,t(45)=1.289,p=0.204.
With respect to non-verbal reasoning, as measured by the matrix reasoning subset of the Wechsler Abbreviated Scale of Intelligence (WASI;Wechsler, 1999), both groups had mean T-scores in the normal range (mean=50,SD=10),Mdeaf=52.33
(SDdeaf=10.57) andMhearing=55.79 (SDhearing= 8.48), and the
scores did not differ significantly from one another,t(53)=1.338,
p = 0.186. Within the deaf group, the native signer subgroup
(M = 62.25,SD=7.01) had significantly higher T-scores than
the non-native signers (M = 48.16,SD=8.96),t(25) = 3.954,
p = 0.001, and marginally higher T-scores than the hearing
group,t(34) = 1.967,p = 0.057. The hearing group had higher
T-scores than the non-native signers,t(45)=2.959,p=0.005.
Materials
Working Memory Tasks
Two working memory tasks, namely the Spatial Span Task (Wechsler and Naglieri, 2006) and the Odd One Out Span Task (Henry, 2001), were selected after piloting as they require a mini-mal amount of verbal instruction and only non-verbal responses (i.e., pointing).
[image:5.595.44.548.478.702.2]TheSpatial Span Task(from the Wechsler Nonverbal Scale of Ability,Wechsler and Naglieri, 2006) is a measure of visuo-spatial short-term working memory similar to the Corsi Block Test. A set of nine identical blue blocks is affixed to a white board in an unstructured array. The examiner can view a number on each of the blocks and is seated directly opposite to the child being tested. Children are instructed to tap a sequence of blocks in the same order as the examiner in the “forward” test, and in the reverse order in the “backward” test. Children are administered two trials for each sequence length, beginning with two blocks, ranging up
TABLE 1 | Language background of deaf native signers.
Code* Age Deaf family members
Parent-child language preference
Child’s language preference
Age of acquisition of BSL
Who did child learn BSL from?
Are child’s friends deaf?
Does child mix with deaf adults?
Level of deafness in left ear
Level of deafness in right ear
Does child wear hearing aids?
Does child have a cochlear implant?
B01 7;1 Parent(s) BSL BSL From birth Deaf parent(s)
Most deaf Yes Profound Profound Sometimes No
G02 8;0 Parent(s) BSL BSL From birth Deaf parent(s)
Most deaf Yes Profound Profound Sometimes No
G03 7;1 Parent(s)+
sibling(s)
BSL BSL From birth Deaf
parent(s) Equal deaf/hearing
Yes Profound Profound Sometimes No
B04 7;6 Parent(s)+
sibling(s)
BSL BSL From birth Deaf
parent(s)
Most deaf Yes Profound Profound Sometimes No
B05 8;1 Parent(s)+
sibling(s)
BSL BSL From birth Deaf
parent(s) Equal deaf/hearing
Yes Profound Profound No No
G06 8;11 Parent(s)+
sibling(s)
BSL BSL From birth Deaf
parent(s)
Most deaf Yes Profound Profound Yes No
B07 7;10 Parent(s)+
sibling(s)
BSL BSL From birth Deaf
parent(s) Equal deaf/hearing
Yes Severe Severe Yes No
B08 9;9 Parent(s)+
sibling(s)
BSL BSL From birth Deaf
parent(s)
Most deaf Yes Profound Profound Sometimes No
TABLE 2 | Language background of deaf non-native signers.
Code* Age Deaf family members Parent-child language preference Child’s language preference Age of acquisition of BSL (years) Who did child learn BSL from? Are child’s friends deaf? Does child mix with deaf adults? Level of deafness in left ear
Level of deafness in right ear
Does child wear hearing aids? Does child have a cochlear implant?
G09 11;9 Older sibling BSL BSL 5 Deaf older sibling and school
Most deaf Yes Profound Profound Sometimes No
G10 11;9 Twin sibling BSL+
spoken English
BSL+
spoken English
4 School and speech therapist
Most deaf Yes Profound Profound No Yes
G11 7;3 Other(s) BSL BSL+
spoken English
0.8 Mother Equal deaf/hearing
Yes Profound Profound No Yes
B12 10;4 None BSL BSL 0.6 Unknown Equal
deaf/hearing
Yes Profound Profound Sometimes Yes
B13 9;10 None BSL BSL 4 School Equal
deaf/hearing
No Profound Profound No No
B14 7;1 None BSL BSL 1 Parents and
language aide
Most hearing
Yes Profound Profound Not any more
No
B15 6;8 None BSL BSL 3 Mother Equal
deaf/hearing
Yes Profound Profound No Yes
B16 9;7 None BSL BSL 1 Parents;
deaf and hearing adults
Most deaf Yes Profound Profound No No
G17 9;4 None SSE SSE+BSL 2 School Most deaf No Profound Profound Yes No
G18 8;3 None SSE SSE+BSL 3 School Most deaf Yes Severe Severe Yes No
B19 8;6 None SSE SSE+BSL 6 School Equal
deaf/hearing
Yes Profound Profound Yes No
G20 10;7 None BSL+
spoken English
BSL 1.6 Mother and
school
Equal deaf/hearing
Yes Profound Profound No Yes
B21 10;2 None BSL+
spoken English
BSL 2 Mother Most deaf Yes Profound Profound Sometimes No
B22 11;0 None BSL+
spoken English
SSE 3 Peripatetic
teacher of the deaf
Most hearing
Yes Profound Profound Yes No
G23 9;5 None BSL+
spoken English
SSE+BSL 1 Parents and nursery
Most hearing
Yes Profound Profound No Yes
B24 11;10 None BSL+
spoken English
BSL+
spoken English
4 School Most deaf No Profound Profound Not any more
Yes
B25 11;8 None spoken English
BSL 9 School Most deaf No profound profound yes yes
B26 6;9 None spoken English
BSL+
spoken English
3 School Most deaf Yes severe severe yes no
G27 10;11 None spoken English
BSL+
spoken English
1 Parents and school
Most deaf Yes profound profound no yes
*B, Boy; G, Girl.
to a span of nine. Two trials of each sequence length are admin-istered, and the test is terminated once both trials of the same sequence length are failed. The task begins with two practice tri-als in both the spatial span forward and backward conditions to
ensure that the child understands the task. One point is awarded for each sequence accurately repeated.
in PowerPoint and comprises 63 slides, each displaying a set of three shapes. On each of the slides, two of the shapes are identi-cal, and one is slightly different: the “odd one out.” The examiner shows the child a slide and asks them to identify which shape is the odd one out. The child is instructed to try to remember the location of this shape. The following slide contains an empty grid with three boxes, and the child is asked to point to the empty box in the same location as the shape that they have just seen. After four single-item trials have been displayed, the child is shown two sets of shapes in a row. There then follows a slide with two empty grids, one on top of the other. The child is instructed to point to the empty boxes in the same location as the two “odd” shapes they have previously seen, in the same order that they were presented. If the child initially verbalizes or signs their answer (e.g.,left, mid-dle, etc.), they are reminded that they need to point to the location of the shape. Trial length increases sequentially in blocks of four with a maximum of six sets of shapes. Once the child makes two errors within a block, the test is terminated. The total number of trials correctly recalled is then calculated. Before the test begins, two practice trials are administered to illustrate the task proce-dure: a single-item and a two-item trial. Correct responses to the practice items are indicated to the child if they do not initially answer correctly.
Language Tasks
We used three tests of language, of which two were new adapta-tions of existing measures. An adapted version of theExpressive One Word Picture Vocabulary Test(EOWPVT;Brownell, 2000) was used to test single word vocabulary production. The full test was initially administered as per the instruction manual. The chil-dren are presented with single pictures that test knowledge of primarily simple nouns (e.g., train, pineapple,kayak), but also some verbs (e.g.,eating,hurdling), and category labels (e.g.,fruit,
food). After four practice items, the test begins at various starting points depending on the child’s age. Eight items must be labeled correctly in succession, and the experimenter works backwards if necessary until the basal is achieved. The test finishes when the child gets six successive incorrect answers. The EWOPVT was developed in the USA and so a few pictures (n = 3) were
substituted with alternative pictures to make the test more cultur-ally relevant for children in the UK (e.g.,raccoon→badger). In order that the EOWPVT could be used to assess the vocabulary of both hearing and deaf children who communicate in BSL, it was necessary to exclude a number of test items that do not exist in BSL (e.g.,cactus,banjo, “musical instruments”as a collective term). This list of 15 excluded items was established by adminis-tering the test to three native signing Deaf adults who primarily communicated in BSL. These items were then deducted from the children’s total raw scores.
TheBSL Narrative Production Test(Herman et al., 2004) was designed to assess deaf children’s (age 4–11 years) expressive lan-guage by eliciting a narrative in BSL. The child first watches a short, silent video (on a DVD) acted out by two deaf children. Participants are instructed to watch it carefully as they are going to be asked to tell the story once the video has finished. The experimenter leaves the room while the child watches the video and returns once it has finished. The experimenter asks the child
to tell the story. The aim is to elicit a spontaneous story, so no further prompting is given other than asking, “is there anything else?” to check that the child has finished. The child’s narrative is videotaped for subsequent scoring. The test is scored based upon three components: (1) the content of the story (i.e., the level of detailed information included in their narrative); (2) story structure (i.e., introducing the participants and setting the scene, reporting the key events leading to the climax of the story, and detailing the resolution of the story at the end); (3) aspects of BSL grammar (including use of spatial location, person and object classifiers and role shift). The narratives were scored by an exper-imenter who was fluent in BSL and had completed the training course required for administrators/coders of the test.
Hearing control group children were also tested on their nar-rative skills using the same video to elicit a spontaneous story in spoken English. As the original story is told only through gesture and action, this prompted the hearing children to use some gesture in their story retellings e.g., when describing the boy demanding food from the girl, a child may say: “Then he went like that [gestures putting out hand].” These gestures were included in the scoring of the story content. Because English and BSL grammar systems are very different, only narrative content and structure were scored for the purpose of this study. The reli-ability of the use of the test in spoken English was investigated with composite scores of structure and content. Twenty-four of the narratives were scored by two trained testers, showing good inter-rater reliability (r = 0.97,p < 0.001). Ten of the
narra-tives were scored a second time by the same scorer, showing high intra-rater reliability (r = 0.98,p < 0.001). The internal
con-sistency between the content and structure items of the measure was also high (r=0.90,p<0.001).
TheLanguage Proficiency Profile-2(LPP-2;Bebko and McK-innon, 1993) is a questionnaire completed by a person who is familiar with the child’s language skills. The aim is to provide an overall evaluation of linguistic and communicative skills of deaf children, regardless of the specific language or modality in which they communicate (i.e., BSL, signed supported English, spoken English, etc.). Most usually the parents, but occasionally the teacher (n = 3, all in the deaf group), of the children
complete and has been shown to have good concurrent validity with language measures used with both deaf and hearing children (Bebko et al., 2003).
Non-verbal Reasoning Task
Finally, theMatrix Reasoningsubtest of theWechsler Abbreviated Scale of Intelligence(WASI;Wechsler, 1999) was also adminis-tered as a control measure. Matrix reasoning is a performance IQ assessment of non-verbal fluid ability. The child is presented with a pattern with a missing section and is instructed to select the correct response from five potential choices. The starting and stopping points are determined by the participant’s age, and the matrices become increasingly difficult to solve. The test begins with two practice items to ensure the child has understood the task. The test is terminated when four successive answers, or four out of five successive answers, are incorrect.
Procedure
Prior to data collection, written parental consent was obtained and the LPP-2 questionnaire was also completed by parents. (For three children, all in the deaf group, the LPP-2 was completed instead by the child’s teachers). Face-to-face consent was obtained from the children at the start of the testing session. The children were tested individually in a quiet room, either at school or at home, in a session lasting 35–45 min. (The approximate timings for each test were: Corsi blocks—5 min; Odd one out task—5 to 10 min; Narrative—5 to 10 min; Vocabulary—10 min; WASI matrix reasoning—10 min). The entire session was videotaped. Testing of the deaf children was carried out by an adult hearing native user of BSL, who is highly experienced in communicat-ing with deaf children. The hearcommunicat-ing children were also tested by this adult and by three additional trained hearing experimenters. Standardized test instructions (translated into BSL) were used for all of the tests. As mentioned earlier, the tasks required mini-mal verbal/signed instruction, and sufficient practice trials were included to ensure understanding of the task requirements. It was ensured that lighting conditions were good and that children could see the experimenter clearly to view lip movements. The tests were administered in the same order for all participants to ensure that possible test-order effects would be consistent across groups.
Results
Data were missing from one hearing child for the BSL Narrative Production test, and from five deaf and two hearing children for LPP-2. Otherwise the dataset was complete. We present three sets of analyses. First, we compare the entire group of deaf children to the group of hearing children on all language and working mem-ory measures. Secondly, we split the deaf group according to lan-guage experience into native and non-native signer groups, and compare them to the hearing children on all language and work-ing memory measures. Finally, we investigate whether language scores predict working memory scores in the deaf and hearing children considered together.
Comparison of Deaf vs. Hearing Groups
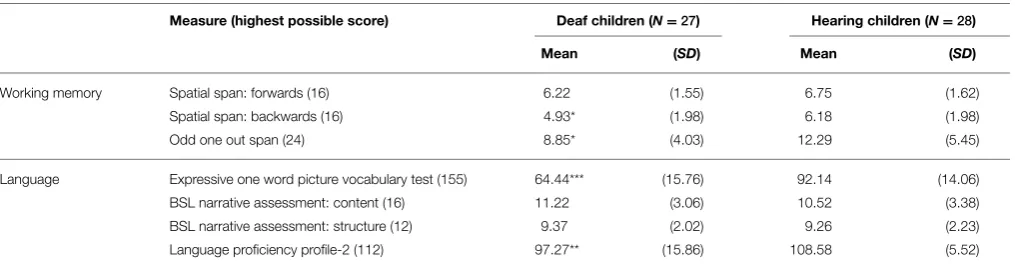
Raw scores for the deaf and hearing groups on the language and working memory tasks are presented inTable 3. A series of independent samplest-tests was carried out to test for group dif-ferences. Because the groups did not differ for age and WASI matrix reasoning score, those factors were not controlled for in this analysis.
For the working memory tasks, the hearing group significantly outscored the deaf group on two measures: Spatial Span Back-ward,t(53)=2.345,p=0.023, and Odd One Out,t(53)=2.650,
p=0.011. There were no group differences on the Spatial Span
Forward task,t(53)=1.231,p=0.224.
For the language tasks, the hearing group significantly outscored the deaf group on two measures: the Expressive One Word Picture Vocabulary Test,t(53) = 6.883,p < 0.001, and
the Language Proficiency Profile, t(46) = 3.401, p = 0.001.
There were, however, no group differences for BSL Narrative: Content,t(52)=0.803,p=0.426, and BSL Narrative: Structure,
t(52) =0.193,p=0.849. Overall, therefore, where group
differ-ences were found on language and working memory measures, they favored the hearing group.
Comparison of Native Signer and Non-Native Signer vs. Hearing Groups
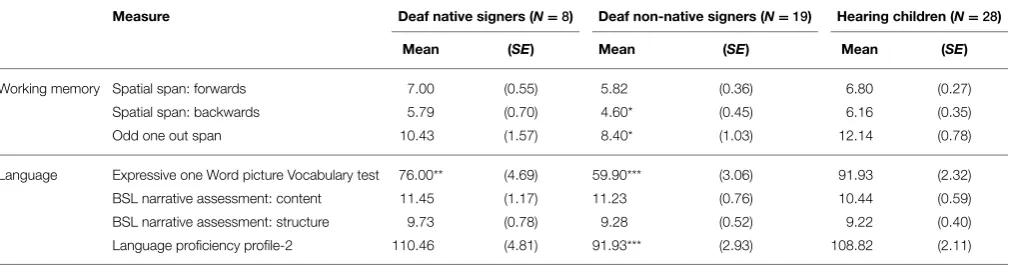
[image:8.595.45.553.566.700.2]Table 4presents the results of the language and working mem-ory tasks for the three groups separately. Because the non-native signers were significantly older than the native signers, and
TABLE 3 | Mean (standard deviation) raw scores for the language and working memory measures, for the deaf and hearing groups.
Measure (highest possible score) Deaf children (N=27) Hearing children (N=28)
Mean (SD) Mean (SD)
Working memory Spatial span: forwards (16) 6.22 (1.55) 6.75 (1.62)
Spatial span: backwards (16) 4.93* (1.98) 6.18 (1.98)
Odd one out span (24) 8.85* (4.03) 12.29 (5.45)
Language Expressive one word picture vocabulary test (155) 64.44*** (15.76) 92.14 (14.06)
BSL narrative assessment: content (16) 11.22 (3.06) 10.52 (3.38)
BSL narrative assessment: structure (12) 9.37 (2.02) 9.26 (2.23)
Language proficiency profile-2 (112) 97.27** (15.86) 108.58 (5.52)
TABLE 4 | Estimated marginal means (standard error) for the language and working memory measures (controlling for age and WASI T-score), for the deaf native signer, deaf non-native signer, and hearing groups.
Measure Deaf native signers (N=8) Deaf non-native signers (N=19) Hearing children (N=28)
Mean (SE) Mean (SE) Mean (SE)
Working memory Spatial span: forwards 7.00 (0.55) 5.82 (0.36) 6.80 (0.27)
Spatial span: backwards 5.79 (0.70) 4.60* (0.45) 6.16 (0.35)
Odd one out span 10.43 (1.57) 8.40* (1.03) 12.14 (0.78)
Language Expressive one Word picture Vocabulary test 76.00** (4.69) 59.90*** (3.06) 91.93 (2.32) BSL narrative assessment: content 11.45 (1.17) 11.23 (0.76) 10.44 (0.59)
BSL narrative assessment: structure 9.73 (0.78) 9.28 (0.52) 9.22 (0.40) Language proficiency profile-2 110.46 (4.81) 91.93*** (2.93) 108.82 (2.11)
Group scores significantly lower than the hearing group:*p<0.05,**p<0.01,***p<0.001.
because the non-native signers scored lower on the WASI matrix reasoning than both the native signers and the hearing group, we investigated group differences using ANCOVAs wherein we controlled for age and WASI score. Within each ANCOVA we carried out post hoc comparisons for group, using the Sidak correction to adjust for multiple comparisons.
For the working memory tasks there was a significant effect of group for the Spatial Span Backward task, F(2,54) = 3.449,
p=0.040.Post hoctests revealed just one significant group
dif-ference: the non-native signers scored significantly more poorly than the hearing group,p = 0.034. Likewise, for the Odd One
Out task, there was a significant effect of group,F(2,54)=4.187,
p = 0.021, with the only group difference being between the
non-native signers and the hearing group, p = 0.020. There
were no group differences for the Spatial Span Forward task,
F(2,54)=2.474,p=0.094.
For the language tasks, the Expressive One Word Picture Vocabulary Test demonstrated a highly significant effect of group,F(2,54) = 34.829,p < 0.001, and this was driven by all
three groups being significantly different from one another: non-native signer <native signer,p = 0.029, non-native signer<
hearing,p = 0.001, and native signer<hearing,p = 0.009.
For the Language Proficiency Profile, there was also a significant effect of group,F(2,47)=10.688,p=0.001, with the non-native
signer group scoring significantly lower than both the native signer group,p=0.011, and the hearing group,p<0.001. There
were no significant differences in scores between the native signer and hearing groups. As before, there were no group differences for scores on the BSL Narrative Test: Content,F(2,53) = 0.542,
p = 0.585, and BSL Narrative Test: Structure,F(2,53) = 0.174,
p=0.841.
Using Language Scores to Predict Working Memory Scores
To explore the contribution of language to working memory test scores, a set of multiple regression analyses was carried out across all participants to predict scores on each working memory task. Expressive One Word Picture Vocabulary Test and Language Proficiency Profile scores were used as predictors. (The scores for content and structure in the BSL Narrative Production Test were
not used because they had shown no group differences.) Age and WASI matrix reasoning T-scores were used as control predictors, and were entered into the model in a first step.
For the Spatial Span Backward task, a model with just age and WASI score entered as predictors of span scores was sig-nificant,F(2,47) = 4.167, p = 0.022, adjusted R
2 = 0.119.
Both age (β = 0.397,t = 2.680,p = 0.010) and WASI score
(β=0.299,t=2.016,p=0.050) were unique predictors. When
the two language measures were added, the model was a better fit,F(4,47)=4.465,p=0.004, adjustedR2 =0.228. In this new
model, both age (β = 0.273,t = 1.772,p = 0.083) and WASI
score (β=0.174,t=1.196,p=0.238) lost their unique
predic-tive power. Expressive One Word Picture Vocabulary score was a significant unique predictor (β=0.379,t=2.208,p=0.033),
but the Language Proficiency Profile score was not (β = 0.029,
t=0.176,p=0.861).
The Odd One Out task showed a similar pattern to the Spatial Span Backward task. Age and WASI score entered together into the model were significant predictors of span scores,F(2,47) =
8.192,p = 0.001, adjustedR2 = 0.234. Both age (β = 0.497,
t = 3.596,p =0.001) and WASI score (β = 0.427,t =3.092,
p=0.003) were unique predictors. When the two language
mea-sures were added, the model showed an excellent fit,F(4,47) =
11.368,p < 0.001, and explained almost half of the variance in
complex span (adjustedR2=0.469). Age (β=0.329,t=2.576,
p=0.014) and WASI score (β =0.260,t = 2.149,p= 0.037)
remained significant predictors. Expressive One Word Picture Vocabulary score was also a significant unique predictor (β =
0.510, t = 3.588, p = 0.001), but the Language Proficiency
Profile score was not (β=0.035,t=0.261,p=0.795).
Finally, for the Spatial Span Forward task, age and WASI score entered together into the model were significant predictors of span scores,F(2,47) = 6.456,p = 0.003, adjustedR
2 = 0.188.
Only age was a unique predictor (β = 0.495,t = 3.480,p =
0.001). WASI score was not a unique predictor, (β = 0.071,
t = 0.501, p = 0.619). Adding the two language measures
improved the model’s fit,F(4,47) = 5.746,p = 0.001, adjusted
R2 = 0.288. Age remained a significant unique predictor (β =
0.396,t = 2.677,p = 0.010), but WASI score again was not
One Word Picture Vocabulary score (β = 0.318,t = 1.933,
p = 0.060) nor Language Proficiency Profile score (β = 0.086,
t = 0.553,p = 0.583) were unique predictors of Spatial Span
Forward score.
Summary of Results
For the Expressive One Word Picture Vocabulary Test we found significant group differences: the deaf group as a whole, and the native signer and non-native signer groups separately, scored more poorly than the hearing group. Furthermore, the non-native signers scored significantly lower than the non-native signers. For the Language Proficiency Profile, the pattern was a little dif-ferent: the group difference between the deaf and hearing groups appeared to be driven by the poor performance of the non-native signer group.
The two executive-loaded working memory measures, the Spatial Span Backward and the Odd One Out Task, patterned like the Language Proficiency Profile: the group of deaf children as a whole and the non-native signer group separately scored lower than the hearing children, but the native signer group did not. For these two working memory measures, vocabulary as mea-sured by the Expressive One Word Picture Vocabulary Test was a significant predictor of scores, beyond age and WASI matrix reasoning score, revealing an association between language and executive-loaded working memory.
However, for the BSL Narrative Production Test, scores for Narrative and Content revealed no group differences—the group of deaf children as a whole, and the two separate groups of deaf native and deaf non-native signers, scored at the same level as the hearing group. Similarly, for one of the working memory measures, the Spatial Span Forward task, we found no group differences. Thus, it is not inevitable that language and work-ing memory performance is worse in deaf children compared to hearing—it depends on the nature of the task.
Discussion
In this study, we investigated the relationship between language and working memory by comparing three groups of children with different language experiences: hearing children, deaf native signers, and deaf non-native signers. These three groups allowed us to tease apart the impact of the quality of auditory experi-ence vs. the impact of reduced language experiexperi-ence on work-ing memory. If disturbances to auditory experience cause poor working memory, then both deaf groups should have performed worse than the hearing group. If it is language experience rather than deafness that impacts on working memory, then deaf native signers should have patterned like hearing children and both groups should have performed better than non-native signers. Furthermore, scores on language tasks should have correlated with working memory scores.
Our findings are consistent with this latter hypothesis that language experience, but not deafnessper se, impacts on non-verbal, executive-loaded working memory. Although our group of deaf children as a whole performed more poorly than an age-matched group of hearing children on the two tasks that involved executive-loaded working memory (the Spatial Span Backward
and the Odd One Out Tasks), this poor performance was driven by those deaf children who had had delayed and reduced lan-guage exposure by not having received signed lanlan-guage input from birth. The small subset of children (n=8) who had learnt BSL under “native” language-learning conditions, i.e., from deaf signing parents, and who had rich language interactions through-out their childhood with family members, friends and at school, did not differ from the hearing group in their working memory scores. We do of course need to be cautious in our interpreta-tion: our group of deaf native signers was small, as this is a rare population. Indeed, small sample sizes are prevalent in experi-mental studies of native signers’ working memory (e.g.n = 6
inWang and Napier, 2013; n = 8 in Krakow and Hanson,
1985; n = 11 inWilson and Emmorey, 2006). Finally in our study, vocabulary, as indexed by the Expressive One Word Pic-ture Vocabulary Test, was a strong predictor of scores on both executive-loaded working memory tasks when all children were considered together.
As discussed in the introduction, teasing apart causal relations between two variables over developmental time is not straightfor-ward. For example, working memory has been extensively inves-tigated in children with Specific Language Impairment (SLI). It has been argued that poor language directly impacts on working memory in children with SLI (van der Lely and Howard, 1993), but others have argued otherwise. In a more recent studyHenry et al. (2012)administered the same non-verbal Odd One Out task as we used in our study (Henry, 2001) and a verbal working memory task, Listening Recall (Working Memory Test Battery for Children,Pickering and Gathercole, 2001).Henry et al. (2012)
found that groups of children with poor language [both normal IQ (i.e., SLI) and low IQ] scored lower than typically develop-ing children on both the verbal and non-verbal workdevelop-ing memory tasks. In particular, performance on these tasks remained lower for the SLI group even when verbal IQ was entered in the regres-sion analyses.Henry et al. (2012)conclude that their results are consistent with SLI being caused by a domain-general impair-ment rather than by an impairimpair-ment specific to language (see also
Ullman and Pierpont, 2005). However, these issues are difficult to tease apart in a population that is heterogeneous with respect to the severity and profile of language difficulties, and where it is possible that deficits of both domain-general and domain-specific (i.e., language) origin co-occur in the same child.
hearing children. Our results indicate that when children do not have adequate exposure to a native language—regardless of its modality—this has consequences for the development of wider cognitive skills (seeCampbell et al., 2014, for a discussion of the neurocognitive consequences of late age of exposure).
However, we do need to be careful when considering the data in our study—does the association between language and non-verbal working memory arise because language is mediating per-formance on working memory tasks concurrently, or because language has had a developmental effect on working memory up until this point in the child’s life? We have been particularly careful to choose tasks that we think do not benefit from ver-bal mediation, and therefore, the measures should not contribute to poorer performance in this way. Nevertheless, we are aware that the nature of verbal mediation in visual tasks is not fully understood, and that research is only just beginning to explore this in children with atypical development. For example,Lidstone et al. (2012) showed that children with and without SLI were equally affected by a verbal suppression task during the Tower of London (executive memory planning task) despite the fact that children with SLI performed more poorly on the task overall. Ide-ally, longitudinal and training studies would help to elucidate this issue.
Furthermore, our results indicate that of the four language measures used—the Language Proficiency Profile, Expressive One Word Picture Vocabulary Test, BSL Narrative: Con-tent and BSL Narrative: Structure—it was the Expressive One Word Picture Vocabulary Test that predicted executive-loaded working memory scores. One interpretation is that the abil-ity to name stimuli and describe them during such tasks allows verbal mediation and draws on vocabulary skills. How-ever, we did not have a measure of syntax, which might also be involved in verbal mediation. The grammatical struc-ture of BSL and English is very different and not easily directly comparable, and whether syntax could be a predictor of working memory scores in our participants remains to be tested.
Finally, although we have interpreted our results as indicat-ing that language experience directly impacts workindicat-ing mem-ory, there are other differences in the developmental experience of native and non-native signers apart from language exposure that might be at play here. These include parental attachment, attention-getting strategies and social-cognitive development,
among others (Marschark and Hauser, 2012). It is possible that some or all of these factors work alongside language exposure to influence working memory development. More research with larger numbers of native signers is required to fully understand these relationships.
Despite these caveats in the interpretation of our results, we argue that contrasting deaf children who grow up in optimal and suboptimal language-learning environments offers a valuable method for understanding the relationship between language and working memory. When the majority of deaf children start to develop language, they experience suboptimal conditions because the language context is predominantly oral. When this “adverse” condition is not present (i.e., when the child’s deaf parent signs with them) we see a very different picture that can inform both theory and clinical practice. In particular, deafness might not be, in itself, a barrier to the development of good working mem-ory abilities. With early exposure to an accessible sign language deaf children can demonstrate comparable skills to their hear-ing peers in this crucial domain. We would not wish for our results to be taken as indicating that early exposure to sign lan-guage does not help deaf children fromhearingfamilies—indeed, we would argue the opposite. An obvious implication for inter-ventions with deaf children of hearing parents is for accessible language exposure to be provided early enough and in contexts where it can enhance or interact with working memory skills. A next step is to understand which aspects of language (e.g., communicative practices between interlocutors or more partic-ular components of language such as vocabpartic-ulary or syntax) are more closely involved in enabling the full development of work-ing memory. We still lack sufficient information about the tim-ing, amount and quality of sign language exposure that might be necessary to support age-appropriate cognitive development, and we hope to see more future research that investigates those relationships.
Acknowledgments
The study reported in this paper was funded by the Economic and Social Research Council of Great Britain (Grant 620-28-600 Deaf-ness, Cognition and Language Research Centre). We also thank Rosalind Herman for her advice on adapting theBSL Production Test (Narrative Skills)into English and theExpressive One Word Picture Vocabulary Testinto BSL.
References
Alloway, T. P., Gathercole, S. E., Adams, A.-M., and Willis, C. S. (2005). Working memory abilities in children with special educa-tional needs. Educ. Child Psychol. 22, 56–67. Available online at: http://www.york.ac.uk/res/wml/Alloway%20Ed&CP.pdf
Andin, J., Orfanidou, E., Cardin, V., Holmer, E., Capek, C. M., Woll, B., et al. (2013). Similar digit-based working memory in deaf signers and hear-ing non-signers despite digit span differences. Front. Psychol.4:942. doi: 10.3389/fpsyg.2013.00942
Avons, S., Wragg, C., Cupples, L., and Lovegrove, W. (1998). Measures of phono-logical short-term memory and their relationship to vocabulary development.
Appl. Psycholinguist.19, 583–602. doi: 10.1017/S0142716400010377
Baddeley, A. D., Gathercole, S. E., and Papagno, C. (1998). The phonological loop as a language learning device.Psychol. Rev.105, 158–173. doi: 10.1037/0033-295X.105.1.158
Baddeley, A. D., and Hitch, G. J. (1974). “Working memory,” inThe Psychology of Learning and Motivation: Advances in Research and Theory,Vol. 8, ed G. A. Bower (New York, NY: Academic Press), 47–89.
Bavelier, D., Newport, E. L., Hall, M., Supalla, T., and Boutla, M. (2006). Persistent differences in short-term memory span between sign and speech.Psychol. Sci.
17, 1090–1092. doi: 10.1111/j.1467-9280.2006.01831.x
Bebko, J. M., Calderon, R., and Treder, R. (2003). The language proficiency profile-2: assessment of the global communication skills of deaf children across lan-guages and modalities of expression.J. Deaf Stud. Deaf Educ.8,438–451. doi: 10.1093/deafed/eng034
Bebko, J. M., and McKinnon, E. E. (1993).The Language Proficiency Profile-2.
Toronto, ON: York University.
Beer, J., Kronenberger, W. G., and Pisoni, D. B. (2011). Executive function in every-day life: implications for young cochlear implant users.Cochlear Implants Int.
12, S89–S91. doi: 10.1179/146701011X13001035752570
Boutla, M., Supalla, T., Newport, E. L., and Bavelier, D. (2004). Short-term memory span: insights from sign language. Nat. Neurosci.7, 997–1002. doi: 10.1038/nn1298
Brownell, R. (2000).Expressive One Word Picture Vocabulary Test, 3rd Edn. Novato, CA: Academic Therapy Publications.
Burkholder, R. A., and Pisoni, D. B. (2003). Speech timing and working memory in profoundly deaf children after cochlear implantation.J. Exp. Child Psychol.85, 63–88. doi: 10.1016/S0022-0965(03)00033-X
Campbell, R., MacSweeney, M., and Woll, B. (2014). Cochlear implantation (CI) for prelingual deafness: the relevance of studies of brain organization and the role of first language acquisition in considering outcome success.Front. Hum. Neurosci.8:834 doi: 10.3389/fnhum.2014.00834
Capirci, O., Cattani, A., Rossini, P., and Volterra, V. (1998). Teaching sign Lan-guage to hearing children as a possible factor in cognitive enhancement.J. Deaf Stud. Deaf Educ.3, 135–142. doi: 10.1093/oxfordjournals.deafed.a014343 Chamberlain, C., Morford, J. P., and Mayberry, R. I. (2000).Language Acquisition
by Eye.Mahwah, NJ: Lawrence Erlbaum Associates.
Conway, C. M., Pisoni, D. B., and Kronenberger, W. G. (2009). The importance of sound for cognitive sequencing abilities: the auditory scaffolding hypothesis.
Curr. Dir. Psychol. Sci.18, 275–279. doi: 10.1111/j.1467-8721.2009.01651.x Daneman, M., and Carpenter, P. A. (1980). Individual differences in
work-ing memory and readwork-ing.J. Verbal Learn. Verbal Behav.19, 450–466. doi: 10.1016/S0022-5371(80)90312-6
Davis, A., Bamford, J., Wilson, I., Ramkalawan, T., Forshaw, M., and Wright, S. (1997). A critical review of the role of neonatal hearing screening in the detection of congenital hearing impairment.Health Technol. Assess.1, i–iv, 1–176.
Engel de Abreu, P. M. J., Abreu, N., Nikaedo, C. C., Puglisi, M. L., Tourinho, C. J., Miranda,M. C., et al. (2014). Executive functioning and reading achievement in school: a study of Brazilian children assessed by their teachers as poor readers.
Front. Psychol.5:550. doi: 10.3389/fpsyg.2014.00550
Fagan, M. K., Pisoni, D. B., Horn, D. L., and Dillon, C. M. (2007). Neuropsycho-logical processes associated with vocabulary, reading, and working memory in deaf children with cochlear implants.J. Deaf Stud. Deaf Educ.12, 461–471. doi: 10.1093/deafed/enm023
Faulkner, K. F., and Pisoni, D. B. (2013). Some observations about cochlear implants: challenges and future directions. Neurosci. Discov. 1:9. doi: 10.7243/2052-6946-1-9
Figueras, B., Edwards, L., and Langdon, D. (2008). Executive function and language in deaf children. J. Deaf Stud. Deaf Educ. 13, 362–377. doi: 10.1093/deafed/enm067
Gathercole, S. E., Willis, C. S., Emslie, H., and Baddeley, A. D. (1992). Phono-logical memory and vocabulary development during the early school years: a longitudinal study.Dev. Psychol.28, 887–898. doi: 10.1037/0012-1649.28.5.887 Geraci, C., Gozzi, M., Papagno, C., and Cecchetto, C. (2008). How grammar can cope with limited short term memory: simultaneity and seriality in sign languages.Cognition106, 780–804. doi: 10.1016/j.cognition.2007.04.014 Hall, M., and Bavelier, D. (2010). “Working memory, deafness and sign language,”
inThe Handbook of Deaf Studies, Language and Education, Vol. 2, eds M. Marschark and P. E. Spencer (Oxford: Oxford University Press), 458–472. Henry, L. A. (2001). How does the severity of a learning disability affect working
memory performance?Memory9, 233–247. doi: 10.1080/09658210042000085 Henry, L. A., Messer, D. J., and Nash, G. (2012). Executive functioning in children
with specific language impairment.J. Child Psychol. Psychiatry53, 37–45. doi: 10.1111/j.1469-7610.2011.02430.x
Herman, R., Grove, N., Holmes, S., Morgan, G., Sutherland, H., and Woll, B. (2004).Assessing BSL Development: Production Test (Narrative Skills). London: City University.
Hintermair, M. (2013). EF and behavioural problems in deaf and hard-of-hearing students at general and special schools.J. Deaf Stud. Deaf Educ.18, 344–359. doi: 10.1093/deafed/ent003
Hirshorn, E. A., Fernandez, N. M., and Bavelier, D. (2012). Routes to short-term memory indexing: lessons from deaf native users of American Sign Language. Cogn. Neuropsychol. 29, 85–103. doi: 10.1080/02643294.2012.7 04354
Kapa, L. L., and Colombo, J. (2014). Executive function predicts artificial language learning. J. Mem. Lang. 76, 237–252. doi: 10.1016/j.jml.2014. 07.004
King, J., and Just, M. A. (1991). Individual differences in syntactic processing: the role of working memory.J. Mem. Lang.30, 580–602. doi: 10.1016/0749-596X(91)90027-H
Kormos, J., and Sáfár, A. (2008). Phonological short-term memory, working memory and foreign language performance in intensive lan-guage learning. Bilingualism 11, 261–271. doi: 10.1017/S13667289080 03416
Krakow, R. A., and Hanson, V. L. (1985). Deaf signers and serial recall in the visual modality: memory for signs, fingerspelling and print.Mem. Cognit.13, 265–272. doi: 10.3758/BF03197689
Kwok, R. K. W., and Ellis, A. W. (2014). Visual word learning in adults with dyslexia.Front. Hum. Neurosci.8:264. doi: 10.3389/fnhum.2014.00264 Kyllonen, P. C., and Christal, R. E. (1990). Reasoning ability is (little more than)
working-memory capacity?Intelligence14, 389–433.
Lederberg, A., and Mobley, C. E. (1990). The effect of hearing impairment on the quality of attachment and mother-toddler interaction. Child Dev.61, 1596–1604. doi: 10.2307/1130767
Lev-Ari, S. (2015). Comprehending non-native speakers: theory and evi-dence for adjustment in manner of processing.Front. Psychol.5:1546. doi: 10.3389/fpsyg.2014.01546
Lidstone, J., Meins, E., and Fernyhough, C. (2012). Verbal mediation of cogni-tion in children with Specific Language Impairment.Dev. Psychopathol.24, 651–660. doi: 10.1017/S0954579412000223
Lieberman, A. M., and Mayberry, R. I. (2015). “Studying sign language acquisi-tion,” inResearch Methods in Sign Language Studies: A Practical Guideeds E. Orfanidou, B. Woll, and G. Morgan (Malden, MA: Wiley), 281–299. Marschark, M., and Hauser, P. C. (2012).How Deaf Children Learn. Oxford:
Oxford University Press.
Melby-Lervag, M., Lervag, A., Lyster, S.-A. H., Klem, M., Hagtvet, B., and Hulme, C. (2012). Nonword-repetition ability does not appear to be a causal influ-ence on children’s vocabulary development.Psychol. Sci.23, 1092–1098. doi: 10.1177/0956797612443833
Morgan, G., and Woll, B. (eds.). (2002).Directions in Sign Language Acquisition. Amsterdam: John Benjamins.
Parasnis, I., Samar, V., and Bettger, J. (1996). Does deafness lead to enhancement of visual spatial cognition in children? Negative evidence from deaf nonsign-ers. J. Deaf Stud. Deaf Educ.1, 145–152. doi: 10.1093/oxfordjournals.deafed. a014288
Pickering, S., and Gathercole, S. E. (2001).Working Memory Test Battery for Children. London: Psychological Corporation.
Schick, B., Marschark, M., and Spencer, P. E. (eds.). (2005).Advances in the Sign Language Development of Deaf Children. New York, NY: Oxford University Press.
Shute, V. J. (1991). Who is likely to acquire programming skills?J. Educ. Comput. Res.7, 1–24. doi: 10.2190/VQJD-T1YD-5WVB-RYPJ
Ullman, M. T., and Pierpont, E. I. (2005). Specific language impairment is not spe-cific to language: the procedural deficit hypothesis.Cortex41, 399–433. doi: 10.1016/S0010-9452(08)70276-4
van der Lely, H. K. J., and Howard, D. (1993). Specifically language impaired chil-dren: linguistic impairment or short term memory deficit?J. Speech Hear. Res.
37, 1193–1207. doi: 10.1044/jshr.3606.1193
Wallace, G., and Corballis, M. C. (1973). Short-term memory and cod-ing strategies in the deaf. J. Exp. Psychol. 99, 334–348. doi: 10.1037/h00 35372
Wechsler, D. (1999).Wechsler Abbreviated Scale of Intelligence. San Antonio, TX: The Psychological Corporation.
Wechsler, D., and Naglieri, J. A. (2006).Wechsler Nonverbal Scale of Ability. San Antonio, TX: Harcourt Assessment.
Wilson, M., Bettger, J. G., Niculae, I., and Klima, E. (1997). Modality of lan-guage shapes working memory: evidence from digit span and spatial span in ASL signers.J. Deaf Stud. Deaf Educ.2, 150–160. doi: 10.1093/oxfordjour-nals.deafed.a014321
Wilson, M., and Emmorey, K. (2006). Comparing sign language and speech reveals a universal limit on short-term memory capacity.Psychol. Sci.17, 682–683. doi: 10.1111/j.1467-9280.2006.01766.x
Conflict of Interest Statement:The authors declare that the research was
con-ducted in the absence of any commercial or financial relationships that could be construed as a potential conflict of interest.