City, University of London Institutional Repository
Citation
:
Ferreira, M. A., Keswani, A., Miguel, A. F. and Ramos, S. (2012). The flow-performance relationship around the world. Journal of Banking & Finance, 36(6), pp. 1759-1780. doi: 10.1016/j.jbankfin.2012.01.019This is the accepted version of the paper.
This version of the publication may differ from the final published
version.
Permanent repository link:
http://openaccess.city.ac.uk/13634/Link to published version
:
http://dx.doi.org/10.1016/j.jbankfin.2012.01.019Copyright and reuse:
City Research Online aims to make research
outputs of City, University of London available to a wider audience.
Copyright and Moral Rights remain with the author(s) and/or copyright
holders. URLs from City Research Online may be freely distributed and
linked to.
City Research Online: http://openaccess.city.ac.uk/ [email protected]
The Flow-Performance Relationship Around the World
*Miguel A. Ferreira†
Universidade Nova de Lisboa
Aneel Keswani‡
Cass Business School - London
Antonio F. Miguel§
ISCTE - Lisbon University Institute
Sofia B. Ramos**
ISCTE - Lisbon University Institute
This Version: January 2011
*
We thank seminar participants at Cranfield University, Exeter University, Leeds University, LMU Munich University, and conference participants at the 2010 ISCTE Annual Finance Conference, 2009 Leading Lights in Mutual Funds Conference at Cass Business School, and the European Finance Association 2010 meeting (Frankfurt). We are also grateful to Vikas Agarwal, Susan Christoffersen, Keith Cuthbertson, Javier Gil-Bazo, Min Kim, Ian Marsh, Nick Motson, Dirk Nitzche, Lubos Pastor, Richard Payne, Ludovic Phalippou, Stefan Ruenzi, Lucio Sarno, Laura Starks, David Stolin, Ian Tonks, Scott Weisbenner, Russ Wermers and Mungo Wilson for helpful comments.
†
Faculdade de Economia, Universidade Nova de Lisboa, Campus de Campolide 1099-032 Lisboa, Portugal; Email:
Cass Business School; 106 Bunhill Row London EC1Y 8TZ, United Kingdom; Email: [email protected]
§
ISCTE-Lisbon University Institute – Lisbon, Av. Forcas Armadas 1649-026 Lisboa, Portugal; Email:
**
The Flow-Performance Relationship Around the World
Abstract
We use a new dataset to study how mutual fund flows depend on past performance across 28
countries. We show that there are marked differences in the flow-performance relationship
across countries, suggesting that U.S. findings concerning its shape do not apply universally. We
find that mutual fund investors sell losers more and buy winners less in more developed
countries. This is because investors in more developed countries are more sophisticated and face
lower costs of participating in the mutual fund industry. Higher country-level convexity is
positively associated with higher levels of risk taking by fund managers.
JEL Classification: G15; G23
1
1. Introduction
There are numerous papers that have studied how flows depend on past performance using U.S.
mutual fund flow data (e.g., Ippolito (1992), Sirri and Tufano (1998), and Del Guercio and Tkac
(2002)). Most concur that flows are highly dependent on past performance and that U.S.
investors chase winners more intensely than they sell poorly performing funds.
The interest in the flow-performance relationship stems from three main sources. First, fund
flows determine the assets under management of fund management companies and hence their
fees; this means that the flow-performance relationship is paramount for fund families to
understand. Second, the literature has also highlighted that if that the flow performance
relationship is convex that this may encourage fund manager risk taking to increase the
likelihood that they are winners. Third, the way flows respond to past performance also matters
as it has implications for fund persistence. This is because it will determine the degree to which
fund size is affected by past performance which conditions how a fund performs in the future
(Berk and Green (2004)).
The mutual fund industry has been influential in the U.S. financial market for some time, and
this is also now the case in many other countries around the world (Khorana, Servaes, and
Tufano (2005)).1 The far-reaching influence of the mutual fund industry in most economies
suggests that the dependence of flows on past performance will have implications for the risk
and return that investors experience in stock and bond markets. Yet we have little idea of how
1
2
this dependence varies around the world, as there is scant work on mutual fund flows beyond the
U.S. We aim to fill this void and to provide new insights into the flow-performance relationship
around the world, in particular, to understand what determines the shape that we observe.2
We use a worldwide sample of mutual funds to investigate why the intensity with which
investors buy past winners and sell past losers differs across countries. The focus is the role of
economic, financial, and mutual fund industry development in shaping the flow-performance
relationship around the world. Relating the nature of this relationship to the diverse development
levels across countries in our sample is important, because this sheds light on its likely evolution
within countries. This would be difficult to see using individual country data rather than a
sample of countries at different stages of development.
There are several possible explanations for why flow-performance sensitivities differ across
countries, and these can all be related to levels of development. Investors may chase past
favorable performance because they put more weight on the latest fund performance information
or fail to sell losers because they tend to shade the latest performance information upward when
a fund they have purchased underperforms (Goetzmann and Peles (1997)). Investors may also
buy into past winners and not sell past losers because fund families tend to advertise funds that
have recently outperformed rather than drawing attention to poorly performing funds (Sirri and
Tufano (1998)).3 This suggests that investor sophistication can explain the levels of
flow-performance sensitivities observed as more sophisticated investors will be less behaviorally
biased and will not be persuaded by advertising. Indeed, the U.S. literature has shown that not
2
There are a limited number of studies on fund flows outside the U.S. Dahlquist, Engström, and Söderlind (2000) study Sweden, while Keswani and Stolin (2008) study the U.K.
3
3
chasing winners and selling losers is a sensible thing for fund investors to do (Hendricks, Patel,
and Zeckhauser (1993), Brown and Goetzmann (1995), and Carhart (1997)). We confirm this is
also the case in our worldwide sample of mutual funds.4
We expect mutual fund investors in developed countries to be more familiar with financial
products owing to the greater development of their financial markets. In addition, these investors
should also have a better understanding of mutual funds, not only because the mutual fund
industry is typically older but also because it is larger and more pervasive in their countries.
Khorana, Servaes, and Tufano (2005) find larger fund industries in countries with wealthier and
more educated populations. Finally, we expect investors in countries with higher education
levels and more advanced development to be more able to process the information when dealing
with mutual funds. For these reasons mutual fund investors in more developed countries are
likely to be more sophisticated than investors in less developed countries.
Huang, Wei, and Yan (2007) discuss the role of mutual fund participation costs in shaping the
flow-performance relationship. They argue that the higher the participation costs (whether
transaction or information costs) the higher the rate of return a fund must earn before a large
number of investors choose the fund. As a result, funds with higher participation costs will have
a more convex flow-performance relationship at the upper end of the performance scale.
Translating these ideas from the fund level to the country level, when we compare countries with
different levels of average participation costs, we could expect to see more convexity in
4
4
countries with higher average participation costs. Huang, Wei, and Yan (2007) look at how
convexity has changed over time for U.S. mutual funds by comparing convexity in 1981-1989
and 1990-2001. They argue that as a result of investors becoming better informed over time that
we might expect average participation costs to decline over time. They therefore acknowledge
that the aggregate flow-performance relationship in a given country may be explained by the
average level of participation costs. This is the intuition we apply in our work.
How do we expect participation costs to vary with development? Khorana, Servaes, and Tufano
(2009) show that mutual fund fees are lower in more developed countries. In addition, we might
expect that in more developed markets, the convenience of obtaining information concerning
mutual funds might be lower as well. This would suggest lower costs of participating in the
mutual fund industry for investors in more developed countries. At the mutual fund industry
level, this would suggest that industries with higher participation costs will have greater
flow-performance convexity.
In summary, investor sophistication and participation costs arguments suggest a less convex
flow-performance relationship in more developed countries.5 In our analysis below we choose to
model their influence separately on the flow-performance relationship for two reasons. First,
they capture different elements of fund trading decisions. Investor sophistication captures the
ability of investors to process fund information while participation costs measure the
informational and transactional costs of trading funds. Second investor sophistication is
5
5
expected to influence the top and bottom of the flow-performance relationship while
participation costs are likely to be more influential for the middle and the top. As a result it
makes sense to model their impact on the way flows respond to past performance separately.
To examine these issues we use a large sample of equity mutual funds. The sample consists of
more than 16,000 open-ended and actively managed equity funds in 28 countries over
2001-2007. We find that there are marked differences in the flow-performance relationship across
countries, suggesting that U.S. findings to date do not apply directly to other countries.
We test the hypothesis that investors from more developed countries will show lower convexity
in their flow-performance relationship due to their higher sophistication, the lower participation
costs they face, and the greater maturity of their fund management industry. We find that
measures of economic, financial market, and mutual fund industry development aimed at
capturing these factors explain cross-country differences in convexity. Our findings support the
view that development reduces convexity levels. We also show that our results are robust to
other explanations of the flow-performance relationship such as taxes (Ivkovic and Weisbenner
(2009)), market volatility and dispersion of fund manager ability (Kim (2010)).
We go on to demonstrate that differences in convexity across countries have implications for
levels of fund manager risk taking. Specifically, we investigate whether fund managers respond
to different levels of convexity in the flow-performance relationship in their countries. Chevalier
and Ellison (1997) argue that greater flow sensitivity to performance is associated with greater
fund manager risk taking as fund managers stand to gain significant flow if they do well but do
not lose significantly if they perform poorly. We find that country-level convexity is positively
6
We make several contributions to the mutual fund literature. We believe we are the first study
on mutual fund flows to use a worldwide sample. While there are mutual fund cross-country
studies covering topics such as industry size (Khorana, Servaes, and Tufano (2005)), fees
(Khorana, Servaes, and Tufano (2009)), and performance (Ferreira, Miguel, and Ramos (2010)),
there are no cross-country studies on mutual fund flows. Second, our worldwide sample of funds
allows us to explore the role of economic, financial, and mutual fund industry development in
shaping the performance relationship around the world. Our results suggest that
flow-performance convexity is likely to decline as countries develop in a manner consistent with the
U.S. findings in Kim (2010).
Finally, we show how convexity differences across countries influence the levels of risk taking
we observe. To the best of our knowledge, we are the first to relate country-level convexity to
the degree of risk taking in fund management. This finding suggests that regulators and
investors should exert greater effort in monitoring mutual funds in less developed countries,
where mutual fund industries are less developed and participation costs are higher.
The paper is structured as follows. The next section describes the dataset and the variables
constructed to enable cross-country comparison of the sensitivity of mutual fund flows to
performance measures. Section 3 presents our results on the shape of the relationship between
flows and performance, and in Section 4 we investigate the role of a country’s development in
influencing that relationship. In Section 5 we study the implications of the flow-performance
relationship across countries for the risk taking behavior of fund managers. Section 6 reports the
7
2. Data and Methodology
Our survivorship bias-free data on mutual fund sizes and returns are drawn from the Lipper
Hindsight database. Lipper collects these data from fund management companies directly. Like
Kacperczyk and Seru (2007) and others, we begin by eliminating multiple share classes to avoid
double-counting funds and use the share class that Lipper identifies as the primary one.6
Although multiple share classes are listed as separate funds in Lipper, they have the same
holdings, the same manager, and the same returns before expenses and loads. The initial sample
includes 37,910 primary equity funds (both active and dead funds) in the 2001-2007 period. It
includes both domestic funds (funds that invest primarily in stocks of the country of domicile)
and international funds (funds that invest primarily in stocks of countries different from the
country of domicile). We restrict the sample to actively managed equity funds and exclude
funds-of-funds, and closed-end, index tracking, and offshore funds which reduces the sample to
25,110 funds.7
We use aggregate statistics on mutual funds from the European Fund and Asset Management
Association (EFAMA) and Investment Company Institute (ICI) to check the coverage of funds
by Lipper. At the end of 2007, Lipper and EFAMA/ICI reported respectively, 26,800 and 26,950
equity funds. As of December 2007, EFAMA/ICI reported total net assets (TNA) of equity
funds summed across all share classes of $12.5 trillion, while the Lipper Hindsight database
reported a corresponding figure of $10.9 trillion. Thus, our initial sample of equity funds covers
87% of the total net assets of worldwide equity funds, despite some variation in coverage across
6
The primary fund is typically the class with the highest total net assets (TNA). The primary class represents more than 80% on average of the total assets across all share classes.
7
8
countries and years. In some countries, including Canada, Germany, Sweden, the U.K., and the
U.S., the coverage is above 90%, while the coverage in Australia and France is about 60% and in
Japan only 40%.
We use quarterly data for fund sizes and monthly data for returns. A minimum of 24 monthly
observations of fund returns are required for inclusion in the final sample. This is to ensure that
we have sufficient observations to calculate risk-adjusted performance measures. To be able to
draw meaningful conclusions from our analysis for different countries, we impose a minimum of
ten funds per quarter in each country which leads to a final sample of 16,135 open-ended
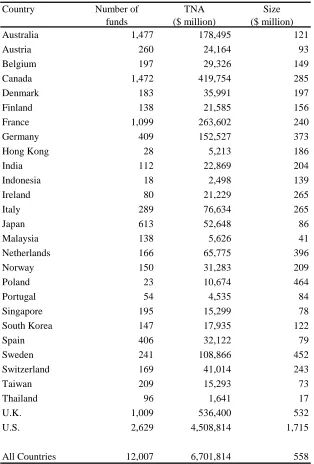
actively managed equity funds in 28 countries over 2001-2007. Table I presents the number and
total net assets (TNA) of funds across countries at the end of 2007. TNA is given by the sum of
all share classes (in $ million) when there are multiple share classes.
One can see considerable variation in the number of funds and fund TNA across countries in our
sample. As of the end of 2007 there are 12,007 funds, representing a TNA of $6.7 trillion. The
U.S. has the highest number of funds and the greatest amount of assets under management by
far. U.S. funds represent 67% of the sample in terms of TNA but only 22% of the total number
of funds. Australia and Canada have the second and third highest number of funds, each
representing about 12% of the total number of funds in the sample. The U.K. and Canada have
the second and third highest fractions of TNA, representing 8% and 6% of TNA, respectively. A
country’s weight in terms of number of funds is greater than its weight in terms of TNA for all
countries except the U.S. Overall, the average U.S. fund is approximately seven times the size of
9 2.1. Fund Flows
Following previous research, we define the the new money growth rate as the net growth in total
net assets (TNA), not due to dividends and capital gains on the assets under management but to
new external money.8 Fund flow for fund i in country c at quarter t is calculated as:
1 , , , , 1 , , , , , , ) 1 ( t c i t c i t c i t c i t c i TNA R TNA TNA
Flow , (1)
where TNAi,c,tis the total net asset value in local currency of fund i in country c at the end of
quarter t, and Ri,c,tis fund i’s raw return from country c in quarter t. Equation (1) assumes flows
occur at the end of each quarter, as we have no information regarding the timing of new
investment.9 To ensure that extreme values do not drive our results, we winsorize fund flows by
country at the bottom and top 1% level of the distribution.
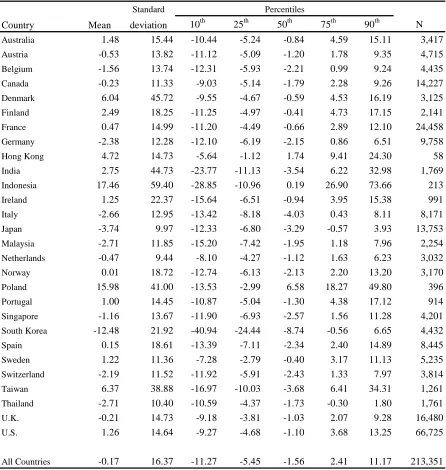
Table II presents descriptive statistics on flows measured as money growth rates by quarter for
funds within each country and region during the sample period. Indonesia and Poland enjoy by
far the highest average quarterly flows during the period, while South Korea has the lowest
average quarterly outflows averaged across funds. The average money growth rate across the
European countries in our sample is -0.16%; for Asian countries, the average quarterly fund
growth rate is -3.03%. The U.S. enjoyed growth rates of 1.26% per quarter on average.
2.2. Performance Measurement
Mutual fund performance is measured using raw returns and risk-adjusted returns in local
8
See, for example, Chevalier and Ellison (1997) and Sirri and Tufano (1998).
9
10
currency. The calculation of total returns assumes that dividends are immediately reinvested. As
in U.S. studies, our raw returns are gross of taxes and net of total expenses (annual fees and other
expenses).
Risk-adjusted performance is calculated using two approaches: (1) Jensen’s alpha, and (2)
Four-factor alpha model using market, size, value, and momentum Four-factors. Jensen’s alpha is
calculated in different ways for domestic and international funds. For domestic funds we first
regress the previous 36 months of fund excess returns on the local (fund domicile) market excess
returns, and store the estimated beta. We then use the estimated beta and the realized excess
market return to predict the return of the fund in the next quarter. The quarterly alpha is the
difference between the predicted return and the realized fund return.10
For international funds, we calculate alphas the same way except that we use the investment
region market excess return factor in the regressions (calculated as the value-weighted average of
market excess returns for all countries in the region in which the fund invests) and the rest of the
world market return factor (calculated as the value-weighted average of market returns for all
countries outside the region in which the fund invests). Like Bekaert, Hodrick, and Zhang
(2009), to avoid the inclusion of a large number of country factors, we take a region-based rather
than country-based approach to risk adjustment. The fund investment region is based on the
Lipper geographic focus field, which can be a single country, a geographic region, or global. We
map the geographic focus into four regions: Europe, Asia-Pacific, North America, Emerging
Markets, and World.
10
11
We calculate four-factor alphas for domestic funds the same way we calculate Jensen’s alpha,
except that we use the domestic market, size, value, and momentum factors instead of a single
market factor. For international funds, we calculate market, size, value, and momentum factors
for each region. Size, value, and momentum factors are calculated as value-weighted averages
of the corresponding factor for all countries in the region. The Appendix explains in detail how
we calculate the four risk factors for each country in our dataset.
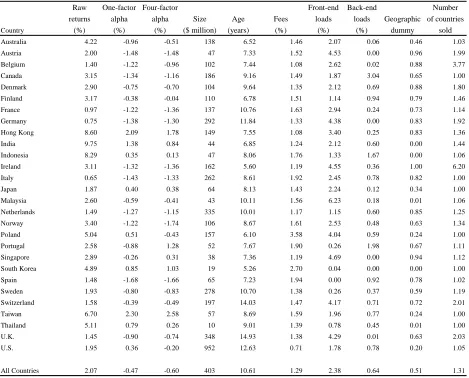
Panel A of Table III contains fund performance statistics by country. India, Hong Kong, and
Indonesia turned in the highest average raw returns, and Italy, Germany, and France the lowest.
The average Jensen’s alphas and four-factor alphas in Table III provide us with a better
understanding of the value of active management in each country. We can see that in Spain and
Austria managers have most underperformed the market, while in Taiwan and Hong Kong
managers have outperformed the most. The average one-factor alpha in our sample is -0.47%
per quarter and the average four-factor alpha is -0.60%. Asia-Pacific countries, on average,
performed better than the other regions according to the three measures of performance. We
emphasize that the differences we observe in fund performance across countries are not due to
survivorship-bias as our dataset includes dead funds as well. Overall, the fund performance
figures here are consistent with evidence in other studies that find fund managers do not have the
ability to beat the market after fees (e.g., Malkiel (1995) and Gruber (1996)).
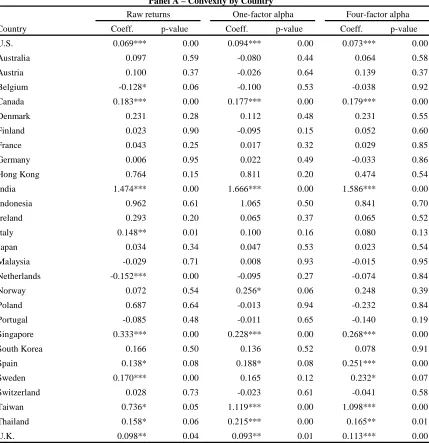
It is informative to measure degrees of performance persistence by country. To examine this, we
sort funds in each country into quintiles based on one-factor and four-factor alphas, and then we
calculate the equally weighted return of the bottom and top quintiles over the next year. We then
12
and top quintiles, we regress these monthly returns on appropriate risk factors. The top and
bottom fund quintile portfolios formed here for each country contain both domestic and
international funds. We therefore calculate their one factor alpha using the market factor for the
country concerned together with the markets factors for all the regions in which funds from that
country invest. We do likewise for four factor alpha and use the domestic four factors plus the
four factors of all the country-relevant regions to risk adjust performance.
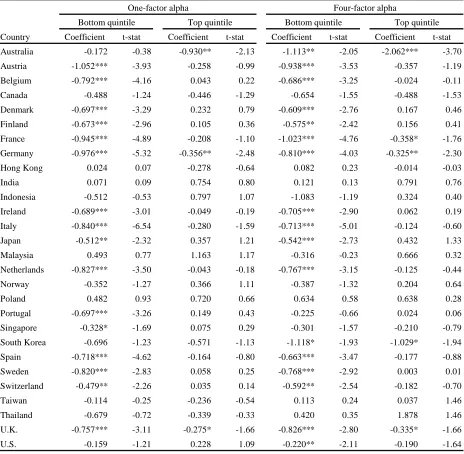
The intercepts, representing monthly abnormal returns, generated for the bottom and top quintile
regressions and their associated t-statistics are presented in Table IV. We see in the table that in
most countries buying past winners does not result in abnormal returns measured using either
one-factor alpha or four-factor alpha. Only in Denmark and Norway chasing winners result in
significantly positive one-factor alpha abnormal performance, and it is only in Norway that it
results in significantly positive four-factor abnormal performance. In 16 countries out of 28
using one-factor alpha and in 14 countries using four-factor alpha, we find statistically
significant negative abnormal performance to buying past losers suggesting that selling past
losers is generally advisable for countries in our dataset.
2.3. Control Variables
Researchers have documented that non-performance-related variables are also important in
explaining flows and their sensitivity to performance, so we introduce a large number of
non-performance-related fund attributes. Larger funds are expected to capture more money, and
hence we include fund size as an explanatory variable (Chevalier and Ellison (1997), Sirri and
Tufano (1998), and Barber, Odean, and Zheng (2005)). Most of these studies also use fund age
13
shown that these fees explain fund flows, including Barber, Odean, and Zheng (2005), Huang,
Wei, and Yan (2007), and Gil-Bazo and Ruiz-Verdú (2009). We also include front-end and
back-end loads as control variables.
We include two additional control variables that are particular to this study. To capture the
impact of geographic investment style, we introduce a dummy variable that equals zero if the
fund is a domestic fund or one if the fund is an international fund. International funds are
expected to offer wider investment diversification opportunities to their investors, and this may
lead to higher flows. The other control variable is the number of countries where a fund is
registered to sell. We include this variable to control for the possibility that an increase in the
number of countries where a fund is sold may influence the flows that it attracts.
Panel A of Table III presents summary statistics of control variables by country averaged across
fund quarters. As we would expect, funds in developed countries (particularly the U.S. and the
U.K.) are the oldest and also the largest, on average. Fees are lowest in the U.S. and highest in
Poland. Malaysia and Singapore charge the highest front-end loads and Canada and Portugal the
highest back-end loads. Spain and South Korea have the lowest front-end loads, while Austria,
Germany, Singapore, and South Korea are countries where funds tend not to charge back-end
loads. Funds from India, Indonesia, and South Korea invest only in their own market in our
dataset, while all funds from Ireland are international funds. Irish funds are registered to sell in
by far the greatest number of countries. Funds in Canada, Italy, Japan, Poland, South-Korea,
Taiwan, Thailand, and the U.S. sell generally only in their own country. The pairwise
correlation matrix among fund control variables is presented in Panel B of Table III.
14
correlation coefficients are low, suggesting that these variables may be included together in our
flow-performance regressions.
3. The Flow-Performance Relationship
In this section we measure both convexity across all countries in our worldwide sample and the
level of convexity at the individual country level. Our aim is to document how differently flows
in each country respond to past performance.
3.1. Measuring Worldwide Convexity
First we measure the level of convexity across all countries in the sample. Our aim is to measure
the relationship between favorable fund performance and flows and between poor fund
performance and flows. We use a piecewise-linear specification in the manner of Sirri and
Tufano (1998) and several others, which allows for different flow-performance sensitivities at
different levels of performance. We allow slopes to differ for the lowest quintile, middle three
quintiles, and the top quintile. The slopes are estimated separately for the bottom quintile (Low),
the three middle quintiles (Mid), and the top quintile (High) of the fractional fund performance
ranks.
In each quarter and for each country fractional fund performance, ranks ranging from zero
(poorest performance) to one (best performance) are assigned to funds according to their past
performance in the past year (measured by raw returns, one-factor alpha or four-factor alpha).
The coefficients on these piecewise decompositions of fractional ranks represent the marginal
fund-flow response to performance. This procedure assigns performance ranking variables for
15 ) ,
2 . 0
min( , , 1
1 ,
,ct ict
i Rank
Low
) ,
6 . 0
min( ,, 1
1 ,
,ct ict
i Rank Low
Mid (2)
)
( , , 1 , , 1
1 ,
,ct ict ict
i Rank Low Mid
High .
We pool our data across countries and regress quarterly fund flows on piecewise past
performance as well as control variables. We could use the Fama-Macbeth approach to run our
regressions but we are prevented from doing so as we only have 28 countries in our dataset. We
use weighted least squares, weighting each fund by the inverse of the number of funds in that
country-quarter. This is to avoid giving excessive weight to countries in our sample that have a
greater fraction of the number of funds, such as the U.S., and also to avoid giving greater weight
to the latter part of the sample when there are more funds.11 By comparing the slope of the
flow-performance function in the Low region with the slope in the High region we can examine
whether there is convexity in the flow-performance relationship in aggregate for all countries.
The regression results, with country and time fixed effects and standard errors adjusted for
clustering by fund, are presented in Table V for the three different performance measures (raw
returns, one-factor alpha, and four-factor alpha). To test for convexity, we conduct a Wald test
to see whether there is a significant difference in the slope of the flow-performance function
between the Low and the High regions.
Table V indicates that whatever performance measure we use and whatever specification we
choose, there is statistically significant convexity in the flow-performance relationship for our
11
16
worldwide sample of funds. The level of convexity is also economically significant. For
example, using the High coefficient in column (9) of Table V, an improvement in performance
ranking in a given quarter from the 80th percentile to the 90th percentile is associated with an
increase in fund flows of 2.48% (= 0.248 x 0.1).
Regarding the coefficients of the control variables, we find that larger and older funds get less
flow consistent with Chevalier and Ellison (1997) and Sirri and Tufano (1998). To control for
autocorrelation in fund flows, we include lagged flows in columns (3), (6), and (9), and like
Cashman, Deli, Nardari, and Villupuram (2007) we find that this enhances explanatory power.
Interestingly, we find that international funds receive more money and that the number of
countries that a fund is distributed in also enhances its flows.
3.2. Measuring Individual Country Convexity
We have found that the flow-performance relationship is non-linear for our worldwide sample of
mutual funds when we do not allow for differential performance sensitivities by country. To
examine whether there are differences in the way that investors from different countries respond
to funds that do well and those that do poorly we do the following. For each country in the
sample, we sort funds into quintiles each quarter on the basis of their raw return performance in
the past year and we calculate the average fund flow by quintile.
Figure I plots average fund flow by performance quintile for each country in our dataset. The
graphs show how fund performance ranks are related to percentage fund flow. As the range of
fund flow is different across countries, we customize the scales for each country. Our graphs
17
graphs have three pieces and are therefore comparable with the previous U.S. literature which
characterizes the flow-performance function by a bottom, middle, and top (e.g., Gruber (1996),
Sirri and Tufano (1998), and Huang, Wei, and Yan (2007)).
The U.S. flow-performance relationship has been shown to be performance-sensitive at the
bottom, flat in the middle, and the most sensitive at the top. If we examine the behavior of flows
across performance quintiles, it is evident that most countries have three pieces in their
relationship. Interestingly, however several countries have two pieces, including Austria, Hong
Kong, Indonesia, Portugal, Spain, and the U.K. This preliminary evidence suggests that there are
clear differences in the flow-performance relationship across countries.
We next estimate the flow-performance relationship for each individual country in the sample
using weighted least squares regression. Specifically, we regress fund flows on piecewise past
performance, but we now allow coefficients on past performance to vary by country.
Regressions include the same control variables as in Table V, and we also allow coefficients on
control variables to vary by country. We also include country fixed effects and time fixed effects
and the standard errors are adjusted for clustering by fund. For brevity purposes, we limit our
focus to Low (the performance slope for the bottom quintile of funds) and High (the
flow-performance slope for the top quintile of funds) past flow-performance variables only.
Table VI presents the results. Panel A is divided into three parts depending on whether past
performance is measured using raw returns, Jensen’s alpha, or four-factor alpha. As the results
are similar for the three measures of performance, we discuss only the four-factor alpha case
here. The pairs of columns present the difference between High and Low coefficients for each
18
performance of a country is significantly different for Low and High performance levels.
There is a wide variation in convexity levels across countries, as is evident from the High-Low
columns. There are eight countries in our sample with statistically significant convexity (plus
the U.S.), and all these countries display greater convexity than the U.S. Our analysis highlights
marked differences in the behavior of fund flows across countries and furthermore that fund
flows in many countries do not behave like U.S. flows.
In Panel B of Table VI we present the difference between the sensitivity of fund flows to Low
and High performance between a given country and the U.S. (using the U.S. as the base country)
and the associated t-statistics of these differences in parentheses.
It is clear from looking at both fund flow sensitivities to top and bottom performance that there is
considerable variation in the magnitude of these variables across countries, and that frequently
these sensitivities differ from those of the U.S. in a statistically significant manner. In the case of
sensitivity to poor performance, only two countries exhibit significantly greater sensitivity than
the U.S., suggesting that U.S. investors are at the top of the scale when it comes to selling losers.
In contrast, U.S. investors are at the middle of the country scale when it comes to chasing
winners. Overall our results indicate that there are substantial variations in the flow-performance
relationship across countries that we will explain in the next section.
4. Explaining the Flow-Performance Relationship across Countries
How much can we explain these flow-performance sensitivity differences across countries? We
19
countries to manifest themselves in differences in flow-performance sensitivity. The literature
that relates to the U.S. along with our Table IV suggest that not chasing winners but selling
losers is a “sophisticated” thing to do as performance persists for poor performers but not for top
performers. Accordingly, we expect investor sophistication to be negatively correlated with
convexity. Additionally, the higher the costs of participating in the mutual fund industry are, the
higher the rate of return a fund must earn before seeing a large number of investors switching
into the fund (Huang, Wei, and Yan (2007)).12 Thus, fund industries with higher participation
costs are expected to exhibit a more convex flow-performance relationship at the upper end of
the performance scale.
We therefore use two types of variables to explain convexity. The first type is based on proxies
for investor sophistication, and the second type is based on proxies for participation costs.
Variables in both categories are drawn from three indicators of development in a country,
namely, economic development, financial development, and mutual fund industry development.
As certain variables proxy for both investor sophistication and participation costs, we group
variables according to the development characteristics.
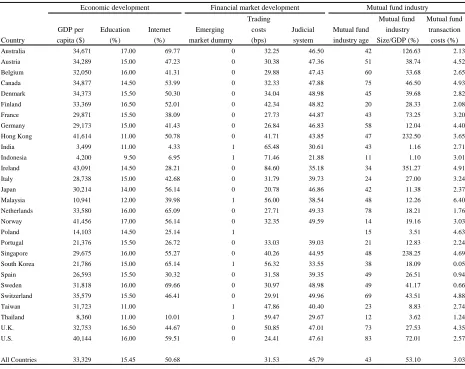
We proxy for economic development using three variables: GDP per capita (GDPC); education
measured as average number of years of education (averaged for men and women); and
percentage of population that uses the internet. These variables are obtained from the World
Development Indicators (WDI) database. We expect investor sophistication to increase with
12
20
economic development, and therefore to increase not only with a general proxy for development
such as GDP per capita but also with specific indicators of development such as education and
internet usage. Incidentally, internet usage could also proxy for participation costs as greater
internet use is likely to lower the informational participation costs of investing in mutual funds.
We measure financial market development using two proxies for investor sophistication and a
proxy for participation costs. To measure investor sophistication, we use a dummy variable that
equals one if the country is considered an emerging market country (following MSCI Barra
criteria), and stock market trading costs, as we expect these costs to be lower in more financially
developed countries. Stock market trading costs are given by the annual average transaction cost
in basis points (including commissions, fees, and price impact) from the Global Universe
Data-ElkinsMcSherry database.
La Porta, Lopez-De-Silanes, Shleifer, and Vishny (1997) have shown that investor protection is a
major determinant of a country’s financial development. We use quality of the judicial system
variable to measure the level of investor protection to capture participation costs faced by mutual
fund investors. The quality of judicial system is measured as the sum of five variables from La
Porta, Lopez-De-Silanes, Shleifer, and Vishny (1998): (1) efficiency of the judicial system; (2)
rule of law; (3) corruption, (4) risk of expropriation; and (5) risk of contract repudiation.13 We
treat this investor protection variable as a measure of participation costs, as we would expect
investors in environments with less protection to require quite high levels of performance to
induce them to invest in financial instruments such as mutual funds. Khorana, Servaes, and
Tufano (2005) show that mutual fund industries prosper in stronger legal environments, which is
13
21
consistent with the idea that mutual fund investors are sensitive to the level of investor protection
provided them. As this variable displays little variation across most countries, we use a dummy
variable approach instead of using the raw variable itself. We set the dummy variable for
judicial system equal to one if a particular country’s judicial system offers greater investor
protection than the median country.
We proxy for mutual fund industry development using the age of the mutual fund industry, the
ratio of the size of the mutual fund industry (from ICI) relative to the size of the economy (as
measured by GDP from WDI), and the average transaction costs incurred in buying and selling
mutual funds. We expect investor sophistication to increase with the span of time that investors
have had to invest in mutual funds and with the mutual fund industry size relative to the size of
the economy. We gather data on the start year of the mutual fund industry in each country in our
sample from Khorana, Servaes, and Tufano (2005) and use that to calculate fund industry age.
Transaction costs capture the effect of the costs of participating in the mutual fund industry (at
the country level) on the observed flow sensitivity to performance. Huang, Wei, and Yan (2007)
investigate whether transaction costs affect the flow-performance relationship by testing whether
class C mutual fund shares display more convexity than other classes of mutual fund shares.
Across the three main share classes, class C shares are viewed as having lower transaction costs
(either buying or selling) because they have no front-end load (in contrast to class A shares) and
have a short-lived back-end load (in contrast to class B shares). As share classes are likely to be
different across countries, we take a more direct approach to measuring the costs of trading
mutual fund shares at the country level by summing front and back-end loads by fund and then
22
development indicators that we use to explain flow-performance sensitivities by country.
Figure II graphs the potential of these variables to explain the relationship between flows and
past performance. We sort our countries on the basis of each proxy for investor sophistication
and participation costs. We then plot the flow-performance relationship for the top five and
bottom five countries sorted by each of these variables.14 Panel A is based on economic
development, Panel B is based on financial market development, and Panel C is based on mutual
fund industry development.
When our country variables proxy for investor sophistication, we expect countries with higher
sophistication to be less sensitive to top performance and more sensitive to poor performance.
For all the economic development variables and all the financial market and mutual fund
industry development variables that proxy for investor sophistication, the flow-performance
relationship is affected in exactly the way hypothesized.
When our country variables proxy for participation costs (transaction costs and judicial system
quality), we expect countries with higher participation costs have higher convexity at the top of
the flow-performance relationship. We do find that countries with higher participation costs in
the form of higher mutual fund transaction costs have greater convexity at the top of their
flow-performance relationship, confirming our predictions. This is due primarily to the effect of
higher transaction costs on the slope of the high section of the flow-performance relationship.
We also find some evidence that investor protection affects convexity due to its impact on the
14
23 middle section of the flow-performance relationship.
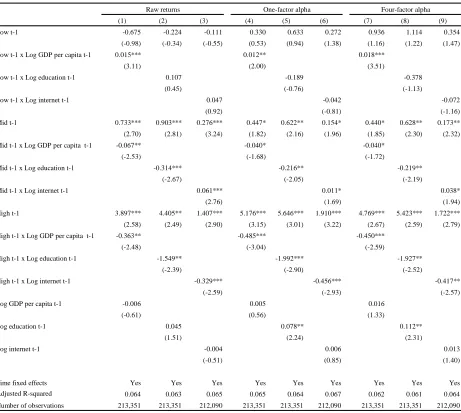
To estimate the contribution of these country-level variables to flow-performance sensitivity
more precisely while controlling for the determinants of fund flows, we regress flows for all
funds on piecewise lagged performance and piecewise lagged performance interacted with the
proxies for investor sophistication and participation costs. We use weighted least squares,
weighting each fund observation by the inverse of the number of funds in each country-quarter
as before. Regressions also include the same set of control variables (for brevity coefficients are
omitted from the table).
In each regression we also separately include the country-level variables that we are using to
explain flow-performance sensitivity. This is to ensure that our estimates of the role of these
variables in determining flow sensitivity are not driven by their contribution to the level of flows
in the country concerned. Tables VIII-X present the results of the regressions using proxies for
economic development, financial market development, and mutual fund industry development to
explain flow-performance sensitivity.
We use GDP per capita and level of education to capture investor sophistication. Results in
Table VIII show that investors chase winners less intensely in countries with higher GDP per
capita and higher education. GDP per capita also increases the sensitivity of fund flows to poor
performance. Interestingly, internet usage reduces the sensitivity of flows to high performance
and increases the sensitivity to middle-range performance, but does not make a significant
contribution to the flow-performance relationship in the low range. The internet usage variable
thus behaves more like a proxy for investor participation costs than a proxy for investor
24
Table IX provides the regression results for financial market development variables. With a
stronger judicial system, participation costs fall, which should increase the slope of the middle
section and reduce the slope of the high section of the flow-performance relationship of
countries. The results for this variable are consistent with our expectations. Emerging market
dummy and trading costs proxy for investor sophistication, and hence should affect the
sensitivity of flow to low and high performance. When we look at whether these variables
influence convexity, they do so but only via their impact on the sensitivity of fund flows to high
performance.
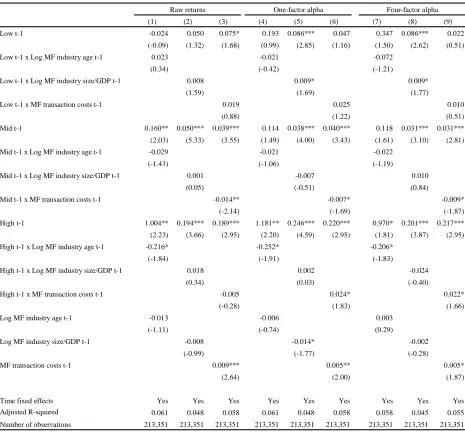
Table X presents the results for the mutual fund industry development variables. Our hypothesis
is that the more developed the fund industry in country, the more financially sophisticated its
mutual fund investors are, and the lower the level of participation costs they face.
We begin by considering the two variables that measure investor sophistication. When we look
at mutual fund industry age, we find robust evidence that investors in countries with older mutual
fund industries buy winners less readily, but mutual fund industry age has no significant effect
on sensitivity to poor performance. The mutual fund industry size relative to the size of the
economy variable affects the sensitivity to poor performance but does not affect the sensitivity to
top performance. We find that investors from countries with larger mutual fund sectors (relative
to the size of their economy) sell losers much more vigorously, but we find little evidence that
they chase winners less.
Table X also presents the results for mutual fund transaction costs, with the aim of measuring
participation costs. As these costs affect the top of the flow-performance relationship alone, our
25
relationship. As conjectured, we do find evidence that the costs of buying and selling funds
reduce sensitivity to mid-range performance and increase sensitivity to top performance.
Overall, the shape of the flow-performance relationship around the world does appear to be
determined by levels of investor sophistication and participation costs. The flow-performance
relationship is more convex in countries with less sophisticated investors and where investors
face higher costs of participating in the mutual fund industry.
To measure the economic significance of our results we look at India, a developing country with
a large number of funds. We examine the impact on Indian convexity of bringing the level of
sophistication and participation costs of Indian investors to U.S. levels. To do this, we raise the
level of Indian measures of development to the U.S. levels of these variables; the results are
presented in Table XI.
As an example, let us consider the case of one particular proxy for investor sophistication,
namely GDP per capita. Indian average GDP per capita in Table VII is $3,499. We raise this to
the U.S. GDP per capita level given in the same table of $40,144. We then calculate the impact
of this on the Low flow-performance sensitivity of India (using alpha as the performance
measure) by multiplying the change in the log of GDP per capita with the interaction coefficient
between log GDP per capita and Low. We do the same for High, and use these two estimates to
calculate the effect of raising Indian GDP per capita to U.S. levels on Indian convexity. In this
case, Indian’s convexity changes from 1.586 (see High-Low in Panel A of Table VI) to 0.444,
which represents an economically substantial reduction in convexity of 72%.
26
to U.S. levels. Altering education or internet usage (assuming internet usage proxies for investor
sophistication) to U.S. levels results in a reduction in convexity of a substantial 46% and 69%,
respectively. Making India a non-emerging market country reduces its convexity by 33%, and
changing its trading costs to U.S. levels reduces its convexity by 27%. Raising the Indian
judicial system to U.S. levels also leads to a reduction in Indian convexity of 18%.
These are all sizeable changes in convexity. Less marked are the impacts of mutual fund
industry age, fund industry size relative to GDP, or fund transaction costs. Overall, it is clear
that investor sophistication and participation costs can have a considerable impact on observed
convexity levels around the world.
5. Implications of the Flow-Performance Relationship across Countries
One might ask whether fund managers respond to different levels of convexity in the
flow-performance relationship in their countries. Chevalier and Ellison (1997) show that U.S. fund
managers toward the end of a performance evaluation period have an incentive to take additional
risk if there is a chance that by doing so they will get to the top of the performance scale.
According to their hypothesis, intra-year fund-level risk shifting is affected by the past
performance and the level of convexity that the fund faces. As we have access to only monthly
fund return data, it would be noisy to estimate measures of intra-year risk shifting. What we do
examine is whether the general level of risk taking is influenced by the level of convexity in a
country.
To test this idea we relate tracking error, a proxy for the level of risk taking by managers of
27
error in countries with more convex flow-performance relationships, as fund managers in these
countries have more incentive to deviate from the behavior of their peer group in an attempt to
ascend the performance scale.
Tracking error is measured as the annualized standard deviation of the difference between the
return on a given fund and the domestic market index return over a 12-month window. If the
fund is an international fund, we use as a benchmark the value-weighted return on all countries
in the fund investment region. To maximize the number of observations available, we measure
tracking error using a 12 months window and roll this window forward one quarter at a time.
We test whether tracking error is related to country-level convexity, measured as the difference
between high and low coefficients from our usual piece-wise linear regression of country-level
flows lagged performance over the previous four quarters. Like Chevalier and Ellison (1997),
we include as control variables the lagged value of tracking error to allow for mean reversion in
manager risk taking; lagged fund size; and also convexity interacted with lagged fund size.
Chevalier and Ellison (1997) use the latter variable to recognize that it may be more difficult for
larger funds to change the riskiness of their portfolios. In some specifications, we also include
fund age in the same manner as fund size, recognizing that younger funds with less established
track records stand to gain more by risk taking. Both Chevalier and Ellison (1997) and Huang,
Sialm, and Zhang (2010) find that younger funds engage in more risk taking behavior. Our
risk-taking regressions also include time fixed effects to capture time variation in risk risk-taking
unexplained by our control variables. We use Newey-West adjusted t-statistics to correct for
overlapping observations.
28
measures of fund performance to estimate country-level convexity. The first two specifications
for these regressions use alternately fund size and age as explanatory variables. The third
specification uses both. As expected, larger and older funds take less risk and respond less to
changes in convexity. More importantly, it is clear that there is robust evidence across
specifications that convexity increases risk taking in a statistically significant way. To illustrate
our results, in keeping with Table XI, we measure the impact on average fund manager tracking
error in the U.S. of an increase in convexity from the level in the U.S. to the level in India (using
convexity measured using the difference between High and Low coefficients and four-factor
alphas). Moving from the U.S. to India increases convexity from 0.073 to 1.586 (see Panel A of
Table), which translates to an increase in average annualized U.S. mutual fund manager tracking
error by 10 percentage points using the estimates in column (9) in Panel B of Table XII. Hence
the impact of convexity on risk taking is not only statistically but is also economically
significant. This effect holds using as a risk measure the standard deviation of fund returns as
well.
We conclude that the level of convexity in the flow-performance relationship has implications in
terms of the incentives for fund managers to take risk. Fund managers take more risk in
countries with higher levels of convexity, which suggests that regulators and investors should
monitor the behavior of fund managers in these countries more closely.
6. Robustness
Ivkovic and Weisbenner (2009) highlight the importance of capital gains taxes in influencing the
outflow-performance relationship in the U.S. We examine whether differences in capital gains
29
taxes from the Organization for Economic Cooperation and Development (OECD) tax statistics
database. We then re-run our main tests in Tables VIII-X including not only our development
variables interacted with fund performance but also mutual fund capital gains taxes rates in each
country interacted with Low, Mid, and High range performance measures. Our results remain
largely unchanged.
Recent work by Kim (2010) relates convexity in U.S. mutual funds to market volatility and the
dispersion of managerial ability. We examine whether the variables in this study are responsible
for our results. To this end, we re-run our analysis in Tables VIII-X including two additional
variables namely, the interaction of past performance (Low, Mid and High) with lagged market
volatility and the interaction of past performance with a proxy for the dispersion of managerial
ability in the country concerned. Market volatility is calculated using monthly market returns for
domestic funds and using the investment region market returns for international funds over the
prior 12 months. The dispersion of managerial ability is measured (using a similar approach to
Kim) as the residual from a regression of the cross sectional standard deviation of fund returns
(over 12 months across funds in each country) on the mean and standard deviation of the market
index return in the case of domestic funds and the mean and standard deviation of the relevant
investment region market for international funds. We find that the impact of using these
additional variables has little bearing on our results.
We conduct a number of further tests to examine the robustness of our results. First, we examine
the impact of using a different measure of fund flows. Our initial tests work with raw fund flow
scaled by fund size. However, it is clear from Table II, that countries have very different average
30
might inhibit our ability to compare flow-performance sensitivities. To test whether controlling
for differences in the mean and volatility of money growth rates makes a difference in our
results, we try two normalized measures of our flow variable. The first is simply a
mean-adjusted version of our raw measure, where we subtract from our initial flow variable, the
average new money growth rate in the same country-quarter. The second is a mean-adjusted
version of the raw measure scaled by the standard deviation of money growth rates across funds
calculated using fund flows in the same country-quarter. Whichever normalization procedure we
use, our results are little affected.
Second, we address the concern raised by the fact that certain countries’ fund flows do not
always increase with fund performance (see Figure I). This may be because in these countries, at
certain times, non-performance variables are dominant in explaining fund flows. To investigate
whether these observations are influential, we drop country-years with negative
flow-performance sensitivities and rerun the tests. This has little effect on the results.
Third, we investigate whether using alternative performance measures makes a difference in the
results. To check this possibility, we measure fund performance using Sharpe ratios and
benchmark-adjusted returns. The benchmark adjusted returns are obtained from Lipper.15 We
find that using either of these performance measures has little impact on our findings.
Fourth, we drop the U.S. from the sample to see whether our findings are driven by the large
number of U.S. funds in the dataset. When we repeat the analysis excluding the U.S., our results
remain largely unchanged. Finally, we test whether our results hold separately for domestic and
international funds. We find the results are robust in both samples.
15
31
7. Conclusion
Our understanding of what drives the buying and selling decisions of mutual fund investors is
based primarily on the behavior of U.S. investors. To fill this gap in the literature we use data on
a large sample of equity mutual funds in 28 countries. We show that there are substantial
differences in flow-performance relationship across countries, meaning that U.S. findings do not
map directly onto other countries.
We hypothesize that investor sophistication and participation costs, proxied by economic,
financial, and mutual fund industry development variables, explain the cross-country differences
in the flow-performance relationship that we observe. Investor sophistication and participation
costs capture different elements of fund trading decisions and they have different implications
for the flow-performance relationship. When we compare how investors react to top
performance in more developed countries and less developed countries, we find that reactions are
more restrained in more developed countries. When it comes to selling losers, however,
investors in more developed countries are generally more pro-active than elsewhere. Our
findings support the view that the more sophisticated investors are and the lower participation
costs they face, the less convex the flow-performance convexity we observe.
Understanding how fund flow convexity is likely to evolve across time as countries develop is
difficult because of the short time span of data typically available and because the variables that
explain convexity are slow-moving. It is an advantage to use a sample of countries which are at
very different stages of development to show how convexity relates to different dimensions of
development. We thus shed light on the likely evolution of convexity in a given country, which
32
We also demonstrate that there are important implications of the convexity of the
flow-performance relationship for the risk-taking behavior of mutual fund managers. One would
expect managers faced with greater flow-performance convexity to take more risk, as they have
more to gain if they perform well and less to lose if they perform poorly. Our evidence shows
that managers in countries with more convex flow-performance relationships take more risk, as
measured by tracking error. This suggests that in less developed countries, which usually have
less developed mutual fund industries, investors and regulators should pay particular attention to
33
Appendix – Calculation of Factors for Risk Adjustment of Fund Performance
We construct the monthly benchmark factors for each individual country except the U.S. using
all stocks included in the Datastream/Worldscope database. For the U.S. we use the factors
constructed by Fama and French.16 The local market return is computed using the
value-weighted average return in local currency of all stocks in each country in each month. The
investment region market factor is computed using the value-weighted average return of all
countries’ market returns in the region. The regions are Europe, Asia-Pacific, North America,
Emerging Markets, and World.
To form the size and book-to-market equity portfolios, we follow the procedure described in
Fama and French (1992). For each country, we calculate the small-minus-big (SMB) and
high-minus-low (HML) factors from July of year t through June of year t + 1 using six
value-weighted portfolios formed at the end of June of year t on the intersection of two size portfolios
(market equity capitalization, ME) and three book-to-market equity (BE/ME) portfolios. The
size breakpoint is the median market capitalization of each country as of the end of June of year
t. Half of the firms are classified as small market capitalization and the other half as big market
capitalization. For the BE/ME classification, the breakpoints are the 30th and 70th percentiles of
BE/ME in each country for the fiscal year end in t - 1. The bottom 30% are designated as the
value portfolio, the middle 40% as neutral, and the highest 30% as growth.
The SMB factor is the monthly average return of the three small portfolios minus the average
return of the three big portfolios:
SMB = (Small Value + Small Neutral + Small Growth - Big Value - Big Neutral - Big Growth)
16
34
The investment region SMB is the monthly value-weighted average of all countries’ SMB
factors in the region.
The HML factor is the monthly average return of the two value portfolios minus the monthly
average return of the two growth portfolios:
HML = (Small Value + Big Value - Small Growth - Big Growth)/2
The investment region HML factor is the monthly value-weighted average of all countries’ HML
factors in the region.
The momentum factor (MOM) for month t is calculated using six value-weighted portfolios
formed at the end of month t - 1, as a result of the intersections of two portfolios formed on size
(ME) and three portfolios formed on prior (2-12) month returns. The ME breakpoint is the
median market equity in each country as of the end of month t - 1. For the return classification,
the 30th and 70th percentiles of the prior returns (2-12) in each country are the breakpoints. The
bottom 30% are designated as the down-month prior return portfolio, the middle 40% as
medium, and the highest 30% as up. The MOM factor is the monthly average return in local
currency on the two high-prior return portfolios minus the monthly average return on the two
low-prior return portfolios:
MOM = (Small High + Big High - Small Low - Big Low)/2
The investment region MOM factor is the monthly value-weighted average of all countries’
35
References
Barber, B., T. Odean, and L. Zheng, 2005, Out of sight, out of mind: The effects of expenses on
mutual fund flows, Journal of Business 78, 2095-2120.
Bekaert, G., R. Hodrick, and X. Zhang, 2009, International stock return comovements, Journal
of Finance 64, 2591-2626.
Berk, J., and R. Green, 2004, Mutual fund flows and performance in rational markets, Journal of
Political Economy 112, 1269-1295.
Brown, K., W. Harlow, and L. Starks, 1996, Of tournaments and temptations: An analysis of
managerial incentives in the mutual fund industry, Journal of Finance 51, 85-110.
Brown, S., and W. Goetzmann, 1995, Attrition and mutual fund performance, Journal of Finance
50, 679-698.
Carhart, M., 1997, On persistence in mutual fund performance, Journal of Finance 52, 57-82.
Cashman, G., D. Deli, F. Nardari, and S. Villupuram, 2007, Investor behavior in the mutual fund
industry: Evidence from gross flows, Working Paper, Arizona State University.
Chevalier, J., and G. Ellison, 1997, Risk taking by mutual funds as a response to incentives,
Journal of Political Economy 105, 1167-1200.
Dahlquist, M., S. Engström, and P. Söderlind, 2000, Performance and characteristics of Swedish
mutual funds, Journal of Financial and Quantitative Analysis 35, 409-423.
Del Guercio, D., and P. Tkac, 2002, The determinants of the flow of funds of managed
portfolios: Mutual funds versus pension funds, Journal of Financial and Quantitative
36
Fama, E., and K. French, 1992, The cross-section of expected stock returns, Journal of Finance
47, 427-465.
Ferreira, M., A. Miguel, and S. Ramos, 2010, The determinants of mutual fund performance: A
cross country study, Research Paper Series, Swiss Finance Institute.
Gil-Bazo, J., and P. Ruiz-Verdú, 2009, The relation between price and performance in the mutual
fund industry, Journal of Finance 64, 2153-2183.
Goetzmann, W., and N. Peles, 1997, Cognitive dissonance and mutual fund investors, Journal of
Financial Research 20, 145-158.
Gruber, M., 1996, Another puzzle: The growth in actively managed mutual funds, Journal of
Finance 51, 783–810.
Hendricks, D., J. Patel, and R. Zeckhauser, 1993, Hot hands in mutual funds: Short run
persistence relative performance, 1974-1988, Journal of Finance 48, 93-130.
Huang, J., C. Sialm, and H. Zhang, 2010, Risk shifting and mutual fund performance, Working
paper, McCombs School of Business, The University of Texas at Austin.
Huang, J., K. Wei, and H. Yan, 2007, Participation costs and the sensitivity of fund flows to past
performance, Journal of Finance 62, 1273-1311.
Investment Company Institute, 2009, Mutual Fund Factbook, 49th Edition.
Ippolito, R., 1992, Consumer reaction to measures of poor quality: Evidence from the mutual
fund industry, Journal of Law and Economics 35, 45-70.
Ivkovic, Z., and S. Weisbenner, 2009, Individual investor mutual fund flows, Journal of
37
Kacperczyk, M., and A. Seru, 2007, Fund manager use public information: New evidence on
managerial skills, Journal of Finance 62, 485-528.
Keswani, A., and D. Stolin, 2008, Which money is smart? Mutual fund buys and sells of
individual and institutional investors, Journal of Finance 63, 85-118.
Khorana, A., H. Servaes, and P. Tufano, 2005, Explaining the size of the mutual fund industry
around the world, Journal of Financial Economics 78, 145-185.
Khorana, A., H. Servaes, and P. Tufano, 2009, Mutual fund fees around the world, Review of
Financial Studies 22, 1279-1310.
Kim, M., 2010, Changes in mutual fund flows and managerial incentives, Working paper,
University of Southern California.
La Porta, R., F. Lopez-De-Silanes, A. Shleifer, and R. Vishny, 1997, Legal determinants of
external finance, Journal of Finance 52, 1131-1150.
La Porta, R., F. Lopez-De-Silanes, A. Shleifer, and R. Vishny, 1998, Law and finance, Journal
of Political Economy 106, 1113-1155.
Lynch, A., and D. Musto, 2003, How investors interpret past fund returns, Journal of Finance
58, 2033-2058.
Malkiel, B., 1995, Returns from investing in equity mutual funds 1971-1991, Journal of Finance
50, 549-573.
Sirri, E., and P. Tufano, 1998, Costly search and mutual fund flows, Journal of Finance 53,