City, University of London Institutional Repository
Citation
:
Maiden, N., Schubmann, M., McHugh, M., Lai, A.Y. & Sulley, R. (2016).
Evaluating the Impact of a New Interactive Digital Solution for Collecting Care Quality
In-formation for Residential Homes. Paper presented at the 30th British Human Computer
Interaction Conference, 11-15 Jul 2016, Bournemouth, UK.
This is the accepted version of the paper.
This version of the publication may differ from the final published
version.
Permanent repository link: http://openaccess.city.ac.uk/15127/
Link to published version
:
Copyright and reuse:
City Research Online aims to make research
outputs of City, University of London available to a wider audience.
Copyright and Moral Rights remain with the author(s) and/or copyright
holders. URLs from City Research Online may be freely distributed and
linked to.
Evaluating the Impact of a New Interactive
Digital Solution for Collecting Care Quality
In-formation for Residential Homes
Max Schubmann City University
Lon-don Cass Business School, London max.schubmann@
city.ac.uk
Rebecca Sulley [email protected].
uk
Michael McHugh Evalucom Consulting,
London, UK michael.mchugh@
evalucom.co.uk
Alex Lai Movement Strategies,
London, [email protected]
m
Neil Maiden City University
Lon-don Cass Business School, London N.A.M.Maiden@
city.ac.uk
Collecting and analysing timely and accurate information about the quality of care that is delivered to older people in residential homes is a challenge. Most current approaches to collecting this in-formation are manual, and add time, cost and human error to them. Interactive digital technologies have the potential to reduce the time consumed, cost and errors in these processes, which in turn can support resolution of an important social challenge. However, designing these interactions can be problematic. In this paper we report the use of a new interactive digital solution that was de-signed to improve the completeness and timeliness of care quality data that was collected from 233 residential nursing and care homes for older people in and around London. Use of the digital solution led to a significant increase in the numbers of residential homes that submitted the cor-rect care quality information by each quarterly deadline. However, qualitative evidence from the residential homes revealed low-level usability problems experienced by care staff that might be in-dicative of continuing usability issues in the care sector. The paper ends with lessons drawn to improve uptake of digital technologies in residential care.
Care quality monitoring, Interactive digital Solution, Formative evaluation, Summative evaluation.
1. CARE QUALITY MONITORING
Delivering care of sufficient quality to the increasing numbers of older people in need of it has become a pressing issue for advanced societies. Older peo-ple with dementia increasingly require specialist and residential care, and the number of people with the condition worldwide is estimated at 47.8 million, a figure expected to double in the next 20 years. Moreover, the wider societal cost of dementia worldwide has been estimated to be US$818 billion annually, rising to US$2 trillion by 2029 (Prince et al. 2015). Most established strategies to manage the quality of care of older people have relied on greater regulation, for example the UK Care Quality Commission’s 2014 Care Regulations (CQC 2014). However, as the numbers of older people in care grows faster than the national budgets that are available to deliver such care, alternative and more cost-effective strategies are needed. One such strategy is intelligence-led oversight that monitors digital information directly from residential homes about the quality of care delivered in these homes.
New applications of interactive digital technologies can collect and analyse care information to reveal, more quickly than currently, not only where and how care is falling below required standards (e.g. how poor personal hygiene is leading to healthcare associated infections) but also, and perhaps more importantly in the future, to enable agencies to pre-dict care problems before these problems impact on the lives of individual older people.
hoc forms that have not fully exploited the capabili-ties of digital.
In this paper, we report the user-centred design and the subsequent evaluation of a new digital so-lution to collect and report care quality information from residential homes that operate across London. The paper uses the term residential home to refer to a range of forms of nursing and care facilities that provide permanent homes and care to older people. The digital solution was designed with the involvement of stakeholders from the care sector and evaluated over 12 months of care quality data collection. As such, it provides one instance of the user-centred design of new digital technologies for widespread uptake in the UK’s residential care sec-tor – one that initial lessons can be learned from. The remainder of the paper is in 4 sections. The next describes a manual process to collect care quality information developed by an organisation called Evalucom, and the limitations that were in-herent in it. Section 3 describes the architecture of a new digital solution for care quality information collection and validation, example interactions with it, and outline results from formative evaluations of the solution. Section 5 then reports first summative evaluation results from use of the solution by 233 residential homes over a 6-month period compared to use of the manual process over the preceding 6-month period in the same homes. The paper ends with a critical assessment of the new digital solu-tion, reports lessons learned, and outlines future di-rections for the use of interactive digital technolo-gies to improve quality management of care ser-vices.
2. CURRENT APPROACHES TO CARE QUALI-TY MONITORING AND TECHNOLOGIES USE IN RESIDENTIAL CARE
Improved care quality monitoring is a critical re-quirement of care agencies. Better quality care costs less due to reductions in illnesses, hospital admissions and resource-consuming treatments, so detecting poor care can deliver both care and cost benefits. For example, each healthcare ac-quired infection and hospital admission cost the health service on average about £3,000 (Plowman et al. 2000) and £1,700 (Tian et al. 2012) respec-tively in the London area – considerable savings to be made if these infections and admissions can be reduced by better care quality in residential homes prior to hospitalization.
New standards for this care quality monitoring have been developed. One example is the EU-funded PROGRESS project, which developed a set of re-sult-oriented indicators of care quality to enable the benchmarking of residential care across Europe – a total of 94 different indicators, each specified with a definition, operationalisation and metric/calculation
formula that imposed a precise measurement on the collected care information (PROGRESS 2010). Some of example indicators and metrics are listed in Table 1.
Table 1. Examples of established measureable care quality indicators from the EU-funded PROGRESS
pro-ject [PROGESS 2010]
Percentage of residents who suffer from de-cubitus ulcers stage 2‐4 that began in a care home
Percentage of residents who have displayed signs of challenging behaviour towards staff members and/or other residents during the past 7 days
Number of hours of direct care provided by professionals to each resident (by type of profession)
Percentage of staff who agree with the statement that the decisions in their care home are made based on the quality of care rather than purely on financial resources
However, although the development of these care quality indicators has enabled new models of care quality to be developed, a tension remains between more complex models with large numbers of indica-tors, which provide more care quality information, and simpler models with fewer indicators that re-source-starved residential homes can complete without impinging on the care services being moni-tored. To seek to resolve this cost-benefit trade-off, a new care quality model was developed out of the NHS Outcomes Framework (Department of Health 2014) by Evalucom with NHS consumers, clinicians and service provider representatives who seek to monitor and manage residential homes that care for older people in the London region more cost-effectively. The model was developed to optimize the collection of key care quality information without over-burdening the residential care being moni-tored. The model only asks 35 questions with dif-ferent results-oriented quality indicators every 3 months. Two of these questions are shown in Table 2.
Table 2. Examples of care quality questions developed by Evalucom in its new care quality model – example
that refer to NHS Continuing HealthCare (CHC) and Funded Nursing Care (FNC)
Q17
During the assessment period how many Health Care Associated Infections did CHC and FNC service users develop whilst in the home? Please do not include Urinary Tract Infec-tions (UTIs) in the total
Q18
During the assessment period, how many Ve-nous Thromboembolisms did CHC and FNC ser-vice users develop while in the home?
pan-London contract for continuing healthcare in resi-dential homes that contractually obligated homes to return a completed questionnaire each quarter – so that clinical care commissioners can use this infor-mation to gain intelligence about and hence im-prove care quality in these homes. In the paper we refer to these residential homes as AQP homes. Furthermore, commissioners responsible for select-ing care services also requested care quality infor-mation to be collected from a selection of residen-tial homes that are not signed up to the contract – homes that are referred to as non-AQP homes in this paper. These homes were not contractually ob-ligated to participate in the process.
Evalucom rolled out the care quality model to resi-dential homes using a simple information collection process. Each quarter, a questionnaire of 35 ques-tions requiring simple quantitative responses was distributed to each monitored residential home. The questionnaire was sent as an MS Excel Spread-sheet attached to an email sent to each designated manager or equivalent at each home. The spread-sheet was populated with automated data valida-tion rules that applied corresponding business rules to validate the correctness of the answer to each question, and to flag incorrect information to the user. Once completed, each user returned the signed updated spreadsheet to Evalucom either via email or as a scanned printout. Every second quar-ter, the questionnaire included a 36th question that requested 3 examples of engagements with care service users or their families that resulted in quali-ty improvements in the preceding 6 months. However, the process was discovered to be time-consuming and resource-intensive to operate, and open to human error. Many home designates did not respond to the emails, so multiple telephone calls were required by Evalucom to chase up the missing questionnaire information. Homes also of-ten returned incomplete or incorrect information, in spite of the automated validation rules that flagged incorrect information to users, which then required Evalucom to transfer questionnaire information to a digital tracker file to calculate these omissions and inconsistencies, in order to be able to communicate back to the home to request the more correct and complete information – a cycle that continued until all questionnaire information was correct and com-plete. The scanned questionnaire printouts also re-quired Evalucom staff to enter the information manually, which requires time and resources, and introduced further scope for human error.
Therefore, the project team explored different new digital solutions to increase the timeliness and ac-curacy of care quality information, as well as to re-duce the costs of its collection and subsequent analysis, whilst still operating within strict technolo-gy and resource constraints imposed by and on most residential homes.
There has been surprisingly little research into computing technologies for use directly by staff in residential homes. Hayden et al. (2012) reported that professionals in residential homes encounter substantial obstacles of access, cost, and time that inhibits their use of computer technologies to edu-cate themselves and receive support – constraints that can also apply to digital care quality monitor-ing. Olsson et al. (2012) reported that the use of computing technologies in residential homes has to meet the needs of older people and their carers, hence digital monitoring needs to align with mean-ingful work practices of carers and managers, and provide valuable feedback to these carers. Powell et al. (2010) reported the challenges perceived by carers about the introduction of computer technolo-gies into residential care – challenges that included the need to balance power and autonomy whilst maximising safety, ensuring continued personal contact with older people, and the need to com-plement rather than replace care activities. De-ployments of mobile devices for daily care note re-cording have led to positive changes to carer work practices and greater information access for care managers (Pitts et al. 2013), but use of such tech-nologies is rare, and most care information is still recorded in non-digital form. Indeed, in the view of the project team, the existing software tools provid-ed surprisingly little care quality information for care managers, the commissioners of that care, and other potential consumers of such information such as the relatives of residents in homes.
In light of these limitations, the project team de-signed and implemented CarePulse, a new digital solution with which to collect and analyse care quality information. CarePulse and its user-centred design are described in the next section.
3. THE CAREPULSE DIGITAL SOLUTION
The project team undertook a user-centred design process with care domain experts to create Care-Pulse’s underpinning architecture, to design the wire-frames of its interactions, to prototype the in-teraction styles, and to develop a functioning ver-sion. Each is described in turn.
3.1 The User-Centred Design Process
discovered new opportunities for digital solutions. From these observations, the team then inter-viewed the stakeholders to discover and specify a set of key functional and quality requirements on one new digital solution. Key requirements specific to the care sector included being operational on much older web browser technologies such as IE7, as well as solutions that are learnable and usable by care professionals – often older nurses – with no or minimum technology use skills. Key functional requirements included the automated implementa-tion of the business rules to validate for complete and correct questionnaire information.
[image:5.595.63.273.321.479.2]Subsequent design of the digital solution by the de-sign team combined a rich context diagram devel-oped by the project team (e.g. Maiden et al. 2008), shown in Figure 1 with 3 distinct user personas (Cooper 1999) constructed from the observation data to describe the personal needs, constraints and attitudes of different expected groups of users of the new solution.
Figure 1. The rich context diagram, revealing all key stakeholders in the digital care quality monitoring solution
The rich context diagram identified the strategic ac-tors that the introduction of CarePulse was de-signed to change the work of, as well as actors that the introduction of CarePulse sought to influence indirectly, and actors that communicate with Care-Pulse but are not changed by its introduction. The personas described a head nurse who has to fill out the questionnaire and sees no point in it, even though her manager tells her that she has to, a
home manager who is willing to fill out the ques-tionnaire but has difficulties with it as she does not understand what the questions are asking, and a
home manager who is willing to fill out the ques-tionnaire and always engages, and strives to im-prove his homes quality. The last of these personas is shown in Figure 2. Each directly contributed to the design of sketched then interactive wireframes that described each interaction in the use of the so-lution and enabled stakeholders to provide feed-back on these interaction designs. The team then undertook regular formative evaluations of new
versions of the digital solution with future end-users from the same lead residential homes to ensure the usability and the effectiveness of the solution. Fi-nally a functional version of CarePulse was forma-tively tested with residential home employees at their places of work.
Name: David Robertson Age: 52
Sex: Male
Quote: “I ensure the quality of care to be outstanding. I strive to continuously improve the quality of care for service users.” About David
David has been a care home manager for 20 years. He is fully engaged with the AQP contract and is part of the provider repre-sentative group. He is always looking to improve the quality of care and to monitor the quality of care that his home provides. He wants his care home to do exceptionally well compared to other care homes as he is very ambitious and a perfectionist. Background
David is a married man with five children. He grew up in Man-chester and moved to London after finishing university. He com-pleted training to be a registered nurse and also comcom-pleted a BSc in Health and Social Studies at the University of Winches-ter. He has worked in many areas including hospitals, communi-ty and different care homes. He really feels passionate about his work as it allows him to improve the lives of elderly people and their families. David is very familiar with the patients in his care home and always finds time in his schedule to walk around and connect with them.
David is familiar and knowledgeable with technology and uses his iPhone 6 on a daily basis. He uses it to check his business mails and appointments. He has a PC in his office and makes sure that it’s always up-to-date as he is aware of security risks and the confidentiality status of the files. He uses a modern computer system to record all information about the care home and its residence. It is supposed to be used by all staff members of the care homes, but he is aware that not everybody has the required knowledge to operate such a complex system. Be-cause of that, he performs regular checks of the data stored in the system to ensure that no false information was entered by the staff.
AQP template
David ensures that he completes and sends out the template in a timely manner before the deadline. He starts collecting infor-mation and preparing to complete the template at the end of each quarter. He partially fills in the template and prints it out for his staff to complete. Once completed, David error checks it again to avoid any mistakes and sends the completed form. Once he receives the draft dashboard, he checks if the infor-mation looks correct and compares it with the dashboard from last quarter to identify any areas that require investigation.
Figure 2. One example residential home carer persona, used to inform design of the digital care quality
monitor-ing solution
3.2 The Resulting CarePulse Architecture
data-base backups. Use of the third-party Sendgrid software as an SMTP gateway allowed use of email templates that are easy to maintain and edit by Evalucom’s administrative staff. The web appli-cation was developed in Django, a high-level Py-thon web framework. All framework components were created and analysed using object-oriented principles, and a first version consisted of object classes for homes, providers, questions, answers,
questionnaires and a responsible person. These
classes were defined in a standard way and de-scribe all attributes and relationships between the models of the system. The home model, for exam-ple, has a name, address and postcode attribute and a foreign key to provider, which indicates that each homes has exactly one associated provider. In the same way, a provider can have multiple
homes connected to it, a home can have multiple
questionnaires, a questionnaire has multiple
ques-tions and a question has answers. This design
de-cision rendered CarePulse open to be adapted to collect information specific to different care quality models and users – different questions could be asked simply and easily to different care service providers. After all of the models had been defined, Django was used to generate automatically the necessary SQL commands and execute them to create tables and store all object instances in the PostgreSQL object-relational database. The web framework allowed webpages to access, display and modify models directly through views – Python functions that received web requests and returned web responses in form of files or html pages. The architecture was implemented with 3 important new capabilities that were either not part of the original manual care quality monitoring system, or enhanced existing features of that system:
1. Validation of the care quality information prior to its final submission to CarePulse. The require-ment was to reduce the volume of incorrect in-formation submitted by care homes – incorrect information that consumed Evalucom resources and time to transfer information to a digital tracker file to detect and manage errors and in-consistencies. Automatic validation was imple-mented using pre-defined formulae that deter-mined if the entered information is possible or not, for example if the number of service users on a specific day was equal or smaller to the to-tal amount of service users in the assessment period. Unlike with the manual system, this fea-ture required residential home users to be re-sponsible for entering all and not just some of the information correctly – when CarePulse de-tected incorrect information using automated validation checks, it sent the users an error message with examples of and rationale for the error under each erroneous care quality infor-mation entry. As such, the introduction of Care-Pulse shifted the responsibility for validating
en-tered care information from Evalucom to each home’s responsible person;
2. A new online glossary that enabled the Care-Pulse users to look up the definitions of care terms in the context of the questionnaire, rather than with a standalone guide in the form of a PDF document that defined key care terms, to support the shift in responsibilities for validating information to residential homes. The decision to include the glossary was based on observa-tions that users often did not understand all of the care-specific terms in the questionnaire, and hence was a recognised source of invalid infor-mation. Implementation of the glossary into the questionnaire was intended to reduce entry er-rors associated with misunderstood terms; 3. No user management system – during the
de-sign process, stakeholders reported that user management with passwords would create bar-riers to care quality information reporting, as care staff turnover in many residential homes is high, and the home identifiers and passwords would be easily forgotten in each intervening 3-month period. Therefore, the requirement was to reduce social barriers to access to manage-ment of care quality information, and the archi-tecture rendered each questionnaire accessible from a link sent directly to the email address of the home’s registered user.
3.3 A Quick Walkthrough of CarePulse
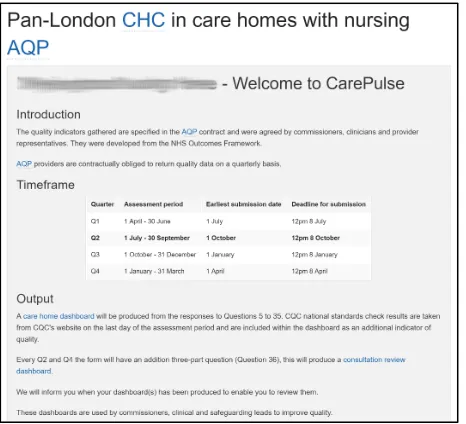
At the end of each quarter, CarePulse sent 2 auto-matically generated emails to each registered user in a residential home, each with the same individu-alized link composed of the CarePulse URL and the UUID of the home’s individualised care quality monitoring questionnaire. The first email was sent to provide an early alert to each home to prepare to collect and submit the required care quality infor-mation. The second email was sent up to 3 weeks later, and requested the user to complete the ques-tionnaire by the deadline. When the user clicked on the link in the email, the application opened a page in the local client web browser containing the care quality monitoring questionnaire that was com-posed of a header and introduction that explained the purpose of the questionnaire and required as-sessment period, the 35 or 36 questions depending on the quarter, and a sign-off section. Some ele-ments of this page are shown in Figure 3.
the questionnaire that were introduced earlier in Table 2 are shown in Figure 4.
Figure 3. An example of the individualised CarePulse welcome page of the online care quality information
[image:7.595.55.285.566.696.2]col-lection questionnaire
Figure 4. Examples of CarePulse’s care quality infor-mation questions and online linked glossary definitions
Figure 5. Examples of CarePulse’s online glossary defi-nitions linked to question Q17.
An example of the context-specific care terms glos-sary is shown in Figure 5. The Figure depicts the pop-up window of care terms that are related to
question 17 in Figure 4, providing a clear and con-cise definition of a Health Care Associated Infec-tion, the event that the questionnaire asks the user to provide a measure for the current quarter. Once the user has validated logical and correct an-swers to all of the questions, s/he signs off the questionnaire, then CarePulse locks the answers and redirects the user to a new page to complete the return.
3.4 Formative Evaluations of CarePulse
Formative evaluations of the first functioning ver-sion of CarePulse were undertaken by lead 10 res-idential homes that volunteered to provide their quarterly responses to the care quality model using the web application instead of using the existing spreadsheet and manual process. To encourage participation in the evaluation, each home was of-fered priority telephone support for their use of CarePulse.
Of the 10 homes, 5 were able to submit the ques-tionnaire within 2 weeks without encountering any problems. Managers of 2 of these care home man-agers reported that CarePulse was a big improve-ment in the process of care information collection. For the other homes, the most problematic ques-tion to answer was about staffing levels in the home – several needed additional time to provide a correct response. Two of these homes also sought assistance to answer the new 36th question that re-quired a qualitative answer – each struggled to provide 3 different examples required to make the submission, which delayed their submission of the complete questionnaire. This finding indicated that successful use of CarePulse depended not only on the tool’s interaction design but also on the forms of care quality data that the design was intended to facilitate collection of.
Revisions were made to CarePulse’s question for-mats, design and implementation to improve its us-ability. For example, the online questionnaire for each residential home was extended with the an-swer to the same question submitted by the home in the previous quarter, as shown in Figure 4, to enable managers to see if the values for their home for the current quarter were changed compared to the last one. Moreover, some questionnaire an-swers that were unlikely to change in 3 months, such as the home name, address and responsible person, were also automatically prefilled by the ap-plication. And the online glossary that linked care-specific terms in questions depicted in Figure 5 was implemented.
4. A SUMMATIVE EVALUATION OF THE RE-VISED VERSION OF CAREPULSE
To evaluate the effectiveness of CarePulse’s sup-port for the care quality monitoring process, the re-vised version of the application was rolled out to 233 new residential homes to collect care quality information in place of the manual spreadsheet-based system used in 2 quarters. Information col-lected using the application was then analysed and compared to information collected with the manual process from the same 233 homes in the 2 preced-ing quarters, in order to seek answers to 2 research questions:
RQ1 Compared to the existing process, did use of CarePulse associate with the collection of the first care quality information by the dead-line?
This question was asked to investigate whether the use of CarePulse would engage residential homes in care quality data collection earlier than with the current process – a need deemed important be-cause of an aim to collect care quality information from each residential home monthly in future, in or-der to provide more up-to-date care quality intelli-gence. However, this question did not explore the accuracy of the collected information, so a second, more important research question was asked: RQ2 Compared to the existing process, did use of
CarePulse associate with the collection of more care quality information that was more correct by the submission deadline?
This question was asked because of care commis-sioner requirements to have both timely and accu-rate care quality information to enable the most ef-fective decision-making about where to provide ad-ditional care resources to support residential care services. For each research question, we investi-gated the effect of compulsory participation in the AQP contract or not on the provision of timely and complete care quality information, in order to inves-tigate whether a contractual obligation influenced effective application use.
4.1 Evaluation Method
Data were collected during the 4 quarters from res-idential homes that did not change substantially over these quarters. The evaluation only collected data from homes that did not participate in the ear-lier formative evaluations, did not change provider and/or names or their AQP status did not close, and returned care quality information in the 4 quar-ters. Information from the selected 233 residential homes was then analysed to determine whether each home in each quarter submitted:
•Timely information: care quality information that was first submitted before the deadline set for the completion of the questionnaire in the CarePulse email sent to the home;
•Correct information: at the submission deadline for the care quality information, information that did not contain one or more logical errors
accord-ing to the same set of codified business rules im-plemented in each spreadsheet of the manual system for quarters Q1 and Q2, and in CarePulse software for quarters Q3 and Q4. CarePulse im-plemented 3 additional error-checking rules, to validate the correctness of the user’s name, whether each answer to question Q36 contained 3 examples of good practice, and predefined val-ue types such as integers and text with character limitations. As such, the results compare a slightly less-strict measure of correct information with the manual system to a more strict measure with CarePulse.
The project team also collected and analysed quali-tative feedback across the 12-month period from the 233 residential homes about problems encoun-tered with requests for additional support to use the manual and CarePulse processes.
4.2 Evaluation Results
Of the 233 residential homes that reported the care quality information across the 4 quarters, 172 were AQP homes contractually required to provide the care quality information to Evalucom each quarter, and 61 volunteered to provide the same information without the contractual obligation.
We analysed the total of residential homes that had submitted timely information and had submitted complete information in the 2 quarters before and the 2 quarters after the implementation of Care-Pulse. First of all, we analysed timeliness – the homes that did and did not return any care quality information by the required submission deadline. Results reported in Table 3 revealed little overall change arising from the introduction of CarePulse in the total numbers of all of the 233 residential homes that made their submissions of care quality information by the required deadline. A Fisher Ex-act Test revealed no significant increase in the res-idential homes that submitted any information by the submission deadline in quarters Q3 and Q4 compared to Q1 and Q2, F=0.948, p>0.05.
Table 3. Totals of residential homes by quarter that did and did not return any care quality information by the
submission deadline
Number of residential homes that
Existing CarePulse Q1 Q2 Q3 Q4 Returned any care quality
information by submis-sion deadline
123 103 122 102
Did not return any care quality information by submission deadline
110 130 111 131
Percentage that returned care quality information
Although the introduction of CarePulse in quarter Q3 was associated with a 7.5% rise in the number of submissions by the deadline, the totals of homes that submitted by the deadline in quarter Q4 had fallen back to a similar number in quarter Q2. The results for the AQP homes reported in Table 4 revealed little overall change arising from the intro-duction of CarePulse in the numbers of all of the 172 AQP homes that made their submissions of any care quality information by the required dead-line. Again, a Fisher Exact Test revealed no signifi-cant increase in the residential homes that submit-ted any information by the submission deadline in quarters Q3 and Q4 compared to Q1 and Q2, F=1, p>0.05.
Table 4. Totals of AQP residential homes by quarter that did and did not return any care quality information by the
submission deadline
Number of residential
homes that Q1 Existing Q2 CarePulse Q3 Q4
Returned care quality in-formation by submission
deadline 98 83 96 85
Did not return care quali-ty information by submis-sion deadline
74 89 76 87
Percentage that returned care quality information by submission deadline
57.0 48.3 55.8 49.4
Table 5. Totals from all 233 residential homes by quarter that did and did not return care quality information cor-rectly by the deadline in the questionnaire by the end of
the assessment period
Number of residential
homes that Q1 Existing Q2 CarePulse Q3 Q4
Returned care quality in-formation correctly by
deadline 87 87 122 102
Did not return care quali-ty information correctly by deadline
146 146 111 131
Percentage that returned care quality information correctly by deadline
37.3 37.3 52.4 43.8
In contrast, the results reported in Table 5 revealed that the introduction of CarePulse in Q3 was asso-ciated with an increase in the number of residential homes that submitted care quality information with-out any logical errors by the submission deadline. A Fisher Exact Test revealed a significant increase in the correctness of the information by the submis-sion deadline in quarters Q3 and Q4 compared to Q1 and Q2, F=0.001, p<0.05. A similar result was found for the 172 AQP homes, as shown in Table 6, and a Fisher Exact Test revealed a significant
increase in the correctness of the information by the submission deadline in quarters Q3 and Q4 compared to Q1 and Q2 for homes on the AQP contract, F=0.005, p<0.05. More residential homes submitted care information quality correctly before the deadline, independent of their contractual sta-tus to provide this information.
Table 6. Totals from all AQP residential homes by quar-ter that did and did not return care quality information correctly by the deadline in the questionnaire by the end
of the assessment period
Number of residential
homes that Q1 Existing Q2 CarePulse Q3 Q4
Returned care quality in-formation correctly by
deadline 70 74 96 85
Did not return care quali-ty information correctly by
deadline 102 98 76 87
Percentage that returned care quality information correctly by deadline
40.7 43.0 55.8 49.4
[image:9.595.314.543.537.715.2]Although the introduction of CarePulse was associ-ated with an increase in the number of homes re-turning correct care quality information, the number of residential homes returning correct information in each quarter was still not high. Therefore, to under-stand better the possible effects of the introduction of CarePulse on the submission of timely and accu-rate care quality information at the level of individu-al residentiindividu-al homes, we anindividu-alysed submitted infor-mation in the 4 quarters by home. The results indi-cate a more complex picture that is summarised in Table 7.
Table 7. Totals of all 233 residential homes that submit-ted timely and correct care quality information in different
patterns across the 4 quarters of the evaluation period.
Number of
residen-tial homes with by submis-Submitted sion
dead-line
Submitted correctly by submission deadline Target met in Q1, Q2,
Q3, Q4 30 21
Target unmet in Q1,
Q2, Q3, Q4 45 52
Target unmet in Q2
then met in Q3 55 63
Target met in Q2 then
unmet in Q3 36 28
Target unmet in Q1, Q2 then met in Q3,
Q4 10 18
quali-ty information by the deadline for Q2 then submit-ted care quality information for the deadline in Q3, and 63 residential homes that did not submit cor-rect care quality information by the Q2 deadline then submitted correct care quality information by the Q3 deadline. This result indicates a positive ef-fect from the introduction of CarePulse in Q3. How-ever, other residential homes that submitted timely or correct care quality information in Q2 failed to do so in Q3 – 36 homes submitted care quality infor-mation after the deadline in Q3, and 28 homes submitted incorrect care quality information in Q3, albeit in smaller numbers. Qualitative data collected from the residential homes in quarters Q3 and Q4 identified possible explanations for this negative re-sult, which was also observed for the homes signed up to the AQP contract, see Table 8. Qualitative feedback from residential homes revealed barriers to effective CarePulse use. Some of these barriers were technical. For example, some participating residential homes that were owned by a national care service provider were unable to access the bespoke URLs provided to each home due to the provider’s internal network configuration, while an-other 3 independent homes were also unable to access the provided URLs for diverse technical reasons. Many of the residential homes also tried to complete the questionnaire with versions of web browsers that were not up-to-date, in particular with IE7 that did not support all CSS functionalities and JavaScript libraries that generated different unex-pected layouts of the questionnaire, missed fea-tures such as the glossary, or for some homes, no questionnaire at all. Furthermore, in quarter Q4, the email address used to send the care quality infor-mation request to each residential home was changed, and there is evidence that users in some homes did not recognise this new email address, and hence did not forward or action it. This problem might have contributed to the observed decrease in the number of residential homes that did not submit care quality information between quarters Q3 and Q4, although the effect of the additional 36th ques-tion in quarter Q4 also cannot be discounted.
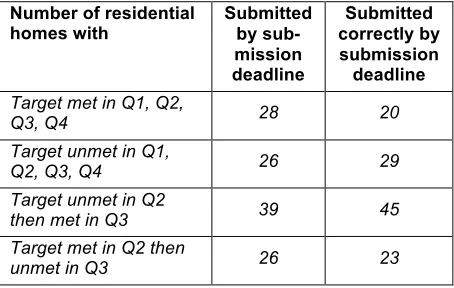
Table 8. Totals of all AQP residential homes that submit-ted timely and correct care quality information in different
patterns across the 4 quarters of the evaluation period.
Number of residential
homes with Submitted by sub-mission deadline
Submitted correctly by submission deadline Target met in Q1, Q2,
Q3, Q4 28 20
Target unmet in Q1,
Q2, Q3, Q4 26 29
Target unmet in Q2
then met in Q3 39 45
Target met in Q2 then
unmet in Q3 26 23
Target unmet in Q1, Q2
then met in Q3, Q4 5 12
The lack of digital expertise in many residential homes also contributed to delays that impeded the timeliness of the returned care quality information. For example, some users misinterpreted the Care-Pulse rejection of invalid information as software errors. Others misunderstood how to use a web application online, and sought to mimic the manual system by saving the CarePulse webpage as a HTML file to the local desktop then sent this file as an attachment to the sending email address. Some even developed creative workarounds to avoid use of the web application – for example retrieving the manual process’s spreadsheet file from previous quarters, copying the current quarter information in-to it, and sending this spreadsheet as an attach-ment to the sending email address. Feedback re-vealed that many residential homes were sensitive to small changes in digital technologies that im-pacted on their abilities to collect and deliver com-plete and timely care quality information text – sen-sitivities that interaction design for care home users needs to consider in future development work for the sector.
The results reported in Table 7 also revealed that another 45 of the 233 residential homes did not submit care quality information for the deadline in any of the 4 quarters, and 52 of the 233 residential homes were still unable to submit correct care qual-ity information by the submission deadline for all 4 quarters. Although the evaluation did not surface concrete evidence of the reasons for this behav-iour, care domain experts at Evalucom hypothe-sised that some homes that have been part of the AQP contract for a longer time have identified that failing to meet the requirements imposed by the contract each quarter did not result in sanctions.
5. CONCLUSIONS AND LESSONS LEARNED
This paper reports the first evaluation of a new web application called CarePulse to collect care quality information from over 200 residential homes. The web application was developed to extend digital technologies into a UK sector with little current digi-tal support, and in particular to enable care agen-cies to predict care problems before these prob-lems impact on the lives of individual older people with conditions such as dementia. Results were analysed to answer 2 research questions:
RQ1 Compared to the existing process, use of CarePulse was not associated with a greater number of homes submitting care quality in-formation from both AQP and non-AQP resi-dential homes by the deadline, but;
that was logically correct by the submission deadline from both AQP and non-AQP resi-dential homes.
Indeed, results revealed that the need for users to ensure that the care quality information entered into CarePulse was accurate required time, and might have contributed to the lack of increase in residen-tial homes that submitted correct information by the deadline. Some residential homes also reported technical reasons for late and/or incorrect infor-mation collection – web browsers with the incorrect configurations and networks that inhibited access to specific URLs – as well as usability-based prob-lems – web applications such as saving the webpage to the local desktop in order to complete the questionnaire that are experienced regularly in the care sector. To overcome these problems, some users in residential homes implemented nov-el but ineffective workarounds to use of the web application that appeared to be based on a very limited understanding of the current spreadsheet-based process – workarounds that led to delays in the submission of care quality information.
There is indirect evidence that CarePulse’s 2 new features to reduce incorrect care quality information – the online glossary to improve user understand-ing of quality model questions, and the automated validation of information entered in response to questions – might have contributed to the more ac-curate and timely collection of information. The marked reduction of residential home questions about the care quality model in Q3/Q4 offers weak evidence for the effectiveness of the glossary. However, in spite of the limited successes reported in this paper, sector-wide technical challenges re-main – challenges that will require new research to resolve. The lack of the digital expertise of the named contacts in the residential homes was one of the most resource-consuming problems, as most of the contacts required training then hands-on guidance to use CarePulse over the telephone. We anticipate that this challenge will remain difficult to resolve while there is high staff turnover in residen-tial homes – turnover levels that require the training and guidance to be repeated several time in the same home in a 12-month period. A related prob-lem is the lack of influence that CarePulse has over the Internet and information technology policies of the larger social care providers. As the results re-ported in the paper reveal, these policies impose diverse URL restrictions such as disabled browser settings that are needed for updates, cookies, and JavaScript needed to use even basic web applica-tions, and limited access to online applications that can support professional work in these service pro-viders. The development of new technologies such as CarePulse needs to be accompanied by sector-wide changes in these policies to enhance rather than inhibit the use of information technologies in residential homes.
These conclusions are drawn from an evaluation based on information collected under complex real-world conditions that pose several potential threats to the validity of the results. One such threat per-tains to the results from Q1/Q2 and Q3/Q4 to an-swer RQ2. In Q1/Q2, care quality information sub-mitted by the deadline might have included illogical and/or missing data, but in Q3/Q4 CarePulse re-quired submitted information to be both logical and complete, except for 9 residential homes in Q3 who were able, for technical reasons, to submit the form with errors. As such, submission by the deadline in Q3/Q4 required more validation work to be under-taken by each residential home.
This first evaluation of the CarePulse web applica-tion with 233 UK residential homes has led the pro-ject team to identify tentative lessons learned with which to design for and to deploy digital solutions to the UK’s care sector more effectively:
A. Design and implement the simplest conceivable digital solution that operates on hardware with software that might have been installed and not updated for up to 10 years. Remove all identi-fied barriers to uptake of the solution by care users – a barrier such as individual user man-agement that was avoided in CarePulse; B. Adapt user-centred design processes to
recog-nise that some care professionals who use digi-tal solutions have no or very limited technology usage skills. Develop specific user personas and usability evaluation procedures adapted to the specific constraints of the UK care sector; C. During user-centred design, do not assume that
care services such as residential homes will al-ways comply with the procedures – contractual and otherwise – imposed on them. Instead, de-sign on the assumption that procedures can be ignored and worked around, due to extreme re-sourcing pressures on care services;
D. Accept that learning to make more effective use of new digital solutions can take time. Since the end of the reported evaluation, Evalucom have gathered more care quality information that indi-cates that the number of residential homes that submit accurate and timely care quality infor-mation is higher than reported in this paper for quarters Q3 and Q4. Build this longer learning into a project’s design procedures.
The project team are now implementing these les-sons to extend CarePulse for decision support with collected care quality information for both residen-tial homes and commissioners of care services us-ing information visualisation techniques.
6. ACKNOWLEDGEMENTS
7. REFERENCES
Cooper A., (1999), The Inmates are Running the Asylum, SAMS, ISBN 0-672-31649-8
CQC (2014). Regulations for service providers and managers. URL: http://www.cqc.org.uk/content/r egulations-service-providers-and-managers (visited on 11/25/2015).
Department of Health (2014), The NHS Outcomes Framework 2015/16, NHS Group, Department of Health, FN-NHSG-NHSCPS-17185, available at: https://www.gov.uk/government/uploads /system/uploads/attachment_data/file/385749/N HS_Outcomes_Framework.pdf
Hayden L. J., Glynn S. M., Hahn T. J., Randall F. and Randolph E. (2012). “The use of internet technology for psycho-education and support with dementia caregivers”, Psychological Ser-vices 9(2), 215-218.
Maiden N.A.M., Ncube C. & Lockerbie J.L. (2008) ‘Inventing Requirements with Use Cases: Expe-riences with a Complex System’, Proceedings 14th International Working Conference, REFSQ’2008 Lecture Notes on Computer Sci-ence LNCS 5025, 58-72.
Olsson A., Engström M., Skovdahl K. and Lampic C. (2012). “My, your and our needs for safety and security: Relatives’ reflections on using in-formation and communication technology in dementia care” Scandinavian Journal of Caring Sciences 26(1), 104-12.
Pitts, K., Pudney, K., Zachos, K., Maiden, N., Krogstie, B., Jones, S., Rose, M., Macmanus, J.
and Turner, I. (2015). Using mobile devices and apps to support reflective learning about older people with dementia. Behaviour and Infor-mation Technology, 34(6), 613-631.
Plowman R., Graves N., Griffin M., Roberts J.A., Swan A.V., Cookson B. & Taylor L., (2000), ‘The Socio-economic Burden of Hospital Ac-quired Infection: Executive Summary’, UK Pub-lic Health Service Laboratory.
Powell J., Gunn L., Lowe P., Sheehan B., Griffiths F., and Clarke A. (2010). “New networked tech-nologies and carers of people with dementia: An interview study” Ageing and Society 30(6), 1073-1088.
Prince M., Wimo A., Guerchet M., Ali G-C., Wu T-Z. and Prina M., (2015), ‘World Alzheimer Report 2015; The Global Impact of Dementia: An anal-ysis of prevalence, incidence, cost and trends, Alzheimer’s Disease International, London. PROGRESS, (2010), Measuring Progress:
Indica-tors for Care Homes, Report from European Centre for Social Welfare Policy and Research, Berggasse 17, A-1090 Vienna, Austria.
Tian Y., Dixon A. & Gao H., (2012), ‘Emergency Hospital Admissions for Ambulatory Care-sensitive Conditions: Identifying the Potential for Reductions’, Kings Fund Data Briefing, URL: http://www.kingsfund.org.uk/sites/files/kf/field/fiel d_publication_file/data-briefing-emergency-