Study on interaction between temporal and spatial information in
classification of EMG signals for myoelectric prostheses
Radhika Menon, Gaetano Di Caterina, Heba Lakany, Lykourgos Petropoulakis, Bernard A. Conway,
John J. Soraghan
Abstract—Advanced forearm prosthetic devices employ classifiers to recognize different
electromyography (EMG) signal patterns, in order to identify the user's intended motion gesture. The
classification accuracy is one of the main determinants of real-time controllability of a prosthetic limb
and hence the necessity to achieve as high an accuracy as possible. In this paper, we study the effects
of the temporal and spatial information provided to the classifier on its offline performance and
analyze their inter-dependencies. EMG data associated with seven practical hand gestures were
recorded from partial-hand and trans-radial amputee volunteers as well as able-bodied volunteers. An
extensive investigation was conducted to study the effect of analysis window length, window overlap
and the number of electrode channels on the classification accuracy as well as their interactions. Our
main discoveries are that the effect of analysis window length on classification accuracy is practically
independent of the number of electrodes for all participant groups; window overlap has no direct
influence on classifier performance, irrespective of the window length, number of channels or limb
condition; the type of limb deficiency and the existing channel count influence the reduction in
classification error achieved by adding more number of channels; partial-hand amputees outperform
trans-radial amputees, with classification accuracies of only 11.3% below values achieved by
able-bodied volunteers.
I. INTRODUCTION
People with upper-limb amputation or congenital limb deficit are benefitted by the use of prostheses
to restore some functions of the lost arm [1]. Surface electromyography (EMG) is recorded from the
residual muscles in the forearm to control the prosthesis. The state of the art in the field of forearm
to recognize specific features in forearm EMG signals and predict one of several gestures to be
performed by the prosthetic hand. The technology offers a more intuitive and dexterous control of
prosthetic forearm devices and is being researched worldwide, in order to develop robotic limbs that
could possibly mimic the functionality of the human arm [2]–[6]. A major challenge to achieving this
goal is the difficulty in accurately identifying the user's intended motion. In any prosthetic arm
development project, the parameters affecting classification accuracy are firstly analyzed in an offline
set-up, before the selection of ideal parameters for real-time tests. In this paper, we explore the
parameters related to the temporal and spatial information contained in the EMG data stream, which is
fed to the classifier, and examine the effect of their interactions on classification accuracy in offline
experiments.
EMG pattern classification is influenced by an intricate interplay of factors, which could be broadly
categorized as those relating to the complex nature of the EMG signal, the practical limitations of data
acquisition and the signal processing techniques employed. Several studies have been done to address
these factors and explore means to minimize classification errors caused by them. The non-stationary
nature of EMG signals has been accounted for in previous studies [7], [8]. Optimization of data
acquisition parameters such as the number of gestures and handling misclassifications [9]–[13] and
limb positions [14], [15] used to train classifiers in a research environment, have been reported.
Research has also been done on the effect of electrode number, size, orientation, configuration and
inter-electrode distance on the classification error produced by the displacement of surface electrodes
[16], [17]. Various aspects of the signal processing techniques that optimize EMG data analysis have
been explored, such as effective feature extraction [2], [18] and the type of classifier employed [19].
However, the body of work investigating the temporal information provided to the classifier, and its
interactions with spatial information, is very minimal. The temporal information is determined by the
EMG signal processing procedure. Since instantaneous EMG is not useful [12], a window of EMG
samples is used to extract features that are fed to the classifier. Also, the overlapped windowing
technique [20] is often adopted and a degree of overlap exists between adjacent windows. These two
information that is discussed in this paper. The selection of an appropriate length of the analysis
window is governed by the tradeoff between classification error and controller delay. These two
factors in turn determine the real time controllability of the prosthetic limb [20], [21]. Hence a
calculated decision must be made in selecting the analysis window length for improved performance.
Shorter windows can be processed faster and hence produce shorter delays. However, features
extracted from shorter analysis windows are more closely situated in the feature space making it more
difficult to classify them and therefore leading to more classification errors. Nevertheless, most
researchers select the window length and overlap empirically, and hardly any formal studies have
been done on their optimization, as discussed in Section II.
The spatial information refers to the EMG data collected from multiple muscle sites on the forearm,
i.e., number of electrode channels. Since a combination of muscles are activated to achieve flexion
and extension of multiple joints, it is intuitively advantageous to collect EMG signals from as many
muscle sites as possible for accurate classification of gestures. However practical limitations are
placed on the maximum density of surface electrodes that can be positioned over a muscle site due to
the presence of crosstalk from adjacent muscles [6]. Moreover, higher number of electrodes escalates
processing demands that result in longer controller delays and increased power consumption. But
since commercial electric powered prosthetic devices are battery powered, it is imperative to
minimize power consumption. Hence several studies have been done to find the optimum number of
electrode channels as discussed in Section II. The focus of our investigation on the number of
electrode channels is motivated by the findings of Smith et al. [21] that a relationship exists between
spatial and temporal information. In offline analysis of classification error, they observed that in cases
where spatial information was increased, the temporal information could be reduced, i.e., increasing
the number of electrodes from two to four, allowed the use of a shorter analysis window without
significantly reducing the classification accuracy. Since their study involved only able-bodied
participants and gestures not involving finger movements, we sought to extend their observations by
We conducted a formal investigation of the relationship between the analysis window length, window
overlap and the number of electrode channels in the case of able-bodied, partial-hand and trans-radial
amputee volunteers performing hand gestures with practical finger movements on offline classifier
performance. The paper is organized as follows. Section II discusses previous research outcomes
concerning the optimization of temporal and spatial information parameters and the limitations of
these studies. Section III explains the EMG data acquisition and processing methods adopted in our
study and the analysis of temporal and spatial information. Section IV reports the results, which are
then discussed in Section in V. Finally, Section VI concludes the paper.
II. BACKGROUND
A. Temporal Information
Zardoshti-Kermani et al. [18] recommended that class separability be used as a means to find the
optimal window length and experimentally determined 100ms to be sufficient to classify elbow joint
movements using 2 pairs of electrodes. Englehart and Hudgins [20] have also discussed the inverse
relationship between the analysis window length and classification error. A formal study to determine
the relationship between window length and classification accuracy and the controllability of the
prosthetic device has been conducted by Smith et al. [21]. They concluded that the optimum window
length in their experimental set-up with able-bodied volunteers was 150-250ms. This range of values
was selected after computing the corresponding controller delays [22] and ensuring they were
maintained within the acceptable range of 100-125ms [23], while simultaneously achieving
satisfactory classification accuracy. All these studies, however, dealt with the classification of arm
motions without the inclusion of any finger movements, which involve the most intricate combination
of muscle activations. Earley et al. [15] reported the inclusion of finger movements in their
investigation on window length, which however, was done using classifiers trained with EMG data
acquired from forearm (extrinsic) muscles as well as hand (intrinsic) muscles. In this paper, the
experiments were conducted using only forearm muscles as used in [20], [21]. We sought to
more temporal information, i.e., longer window lengths, for obtaining better classification accuracy.
Interestingly, this has been observed in the case of spatial information where increasing the number of
electrodes from 6 to 10 was found to be beneficial for classifying finger movements [24].
The overlapped windowing scheme was introduced by Englehart and Hudgins [20] to maximally
exploit the processing power of the prosthetic device. In this technique, every analysis window is
incremented by the processing delay, which is the time taken to extract feature vectors and for the
classifier to make a decision. This results in more frequent decisions output by the classifier than in
the case where disjoint windows are used. They reported that the dense decision stream was
advantageous to increase the classification accuracy when it was post processed using a majority vote
scheme such that one decision was selected from a set of consecutive decisions to actuate the limb.
This scheme was particularly beneficial in the case of short window lengths wherein more
classification errors were produced, but an averaging of the errors could be achieved using majority
vote post-processing. Several studies have adopted this technique although in most reports, the
selection of the window overlap has not been justified. Moreover, the extent of overlap, when
expressed in relation to the window length, is quite variable between studies as shown in Table 1.
Since this representation of overlap provides a measure of the proportion of current and past data
present in the analysis window, it would be beneficial to know if the extent of overlap, as a parameter
in the offline analysis of classification accuracy, has any effect on it, regardless of its influence on
post-processing outcomes. As there appears to be no formal study reported on this topic, we have
investigated the effect of window overlap on classification error and its interaction with the number of
channels used and the analysis window length.
B. Spatial Information
The recommendation for number of channels for trans-radial amputees is in the range of 4-6 channels
for robustness to electrode shift [17] and 6-8 channels for 10 limb motions that include finger
movements [24]. Studies have shown that an upper limit exists on the usefulness of adding electrodes.
accuracy when the number of channels was increased from 10 to 15. We aim to compare our results
with these findings and also explore the influence of temporal factors on spatial information. In order
to adequately explore this, we have used high density surface EMG recording techniques.
III. METHODOLOGY
A. Data acquisition
Surface EMG was recorded from the forearms of 9
able-bodied and 13 amputee volunteers using protocols approved by the University of Strathclyde
Ethics Committee. Informed consent was received prior to the experiments. The amputee participants
included 5 partial-hand and 8 trans-radial amputees (including three congenital cases). Table 2
provides information about the level of amputation and time since amputation of the volunteers. The
partial-hand amputees had all five fingers amputated to some extent (represented as 5PH in Table 2)
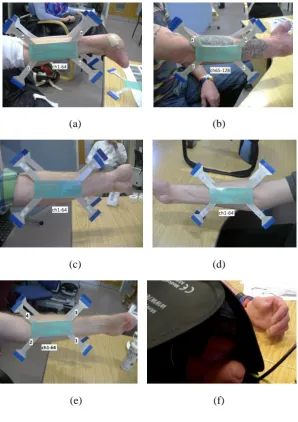
while the wrist joint was kept intact as seen in Fig. 1.
The data collected from the participants was categorized as follows for analysis:
• able-bodied participants
• partial-hand amputees
• trans-radial amputees
One high density electrode array consisting of 64 channels [25] was placed over the flexor
compartment muscles and another identical electrode array was placed over the extensor compartment
muscles, as shown in Fig. 1a and 1b, and connected to an EMG-USB2 bioelectrical signal amplifier
(OT Bioelectronica, Italy). The electrodes were placed on the proximal forearm in approximately the
same position for all the participants. A sampling frequency of 2048 Hz was used, and built-in
hardware filters of 3 Hz for high-pass, and 900 Hz for low-pass, were employed. A gain of 500, 1000
or 2000 was selected depending on the EMG signal strength at the time of recording. Recording was
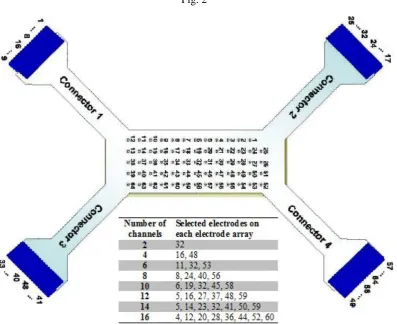
done using a floating monopolar configuration. The pin out diagram of the electrode matrix is
illustrated in Fig. 2. The electrodes had a diameter of 2mm and were spaced at a distance of 8mm
sites and in doing so allows for accurate temporal and spatial imaging of the underlying muscle
activation patterns produced during motion. In the field of myoelectric prosthetics, high density EMG
recording can be invaluable in aiding the prosthetist or prosthetic technician in the identification of the
optimal sites to be used for residual muscle EMG pickup when considering both the number and
locations of conventional electrodes to use in a socket/prosthesis design. In this study, HD EMG
recording was used to acquire EMG data as it was a convenient method to ensure that consistently
sampled EMG configurations could be achieved from the forearm or stump of our research
participants. The selection of electrodes sites for the different number of channels sampled from each
electrode grid is illustrated in Fig. 2 and was determined empirically to ensure that an invariant
configuration of electrodes was sampled from each electrode array across all subjects.
Participants were seated comfortably and rested their forearms on a desk with their elbows flexed.
They were requested to perform bilateral hand gestures when prompted by text displayed on a monitor
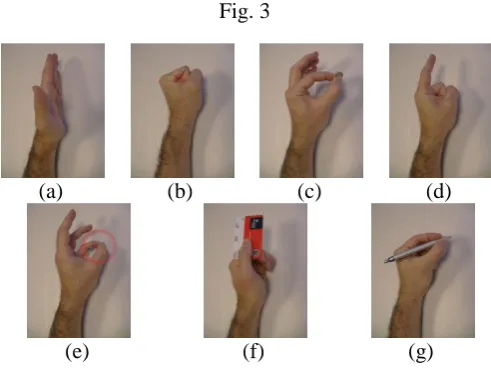
placed directly in front of them. The gestures are shown in Fig. 3 and include open, close, pinch, point,
opposition, lateral grip and tripod (see Fig. 3a to 3g, resp.). The gesture cues were randomized with
each gesture cue being repeated 5 times. Participants were instructed to imagine the action being
carried out and contract their muscles at their normal strength. For unilateral amputees, a mirror box
was positioned over the amputated arm in order to hide that arm from the amputee’s field of view, as
seen in Fig 1f. By mirroring the gesture formed by their sound hand, the mirror box assisted the
amputee to visualize the required gesture occurring on the side of their amputation. All gestures were
formed from rest, in an interval of 3s and maintained for 4-5s, followed by a rest period of 3-4s. The gesture ‘hold’ and ‘rest’ periods were randomly varied. At least two recording sessions were
conducted for all participants.
B. Data processing
The EMG data from each participant was processed offline in MATLAB. Depending on the number
of electrodes being analyzed, the data pertaining to one gesture repeat from all the channels included
1.5s of data after the onset of gesture formation. The EMG signals were filtered in software, with
three 3rd order Butterworth filters, with the following characteristics: 1) a 48-52 Hz stop-band to
remove the 50 Hz mains interference; 2) a 20 Hz high-pass to remove motion artifacts; 3) a 400 Hz
low-pass to discard unwanted frequency content. Then time domain features were extracted from the
resultant EMG signal of length 5.5s-6.5s using the overlapped windowing technique [20]. Time
domain features, i.e., mean absolute value (MAV), slope sign change (SSC), waveform length (WFL)
and zero crossings (ZC) were computed [26] and are the same as that used in [21]. Features from the
same analysis window and pertaining to different channels were concatenated to form a single feature
vector. Given 4 features and N channels, the length of a feature vector in each analysis window is
therefore L=4N.
The classifier employed in this study was the Linear Discriminant Analysis (LDA) classifier because
it performs accurately despite its ease of implementation and training [20] and has been used
extensively in EMG studies. The training and testing procedure was essentially a shortened 5-fold
cross-validation. In this procedure, the training data at each iteration consisted of 4 of the 5 repeats of
each gesture (~80% of the data), selected randomly, and the remaining repeat of a gesture was used
for testing. This process was iterated a thousand times such that the classifier was trained afresh every
time. At each iteration, the current classification outputs were concatenated with all the previous
classification outputs, so as to compute an overall classification accuracy for all completed iterations.
The process converged when the difference between the overall classification accuracies of two
consecutive iterations was less than 0.0005, i.e. when the overall accuracy did not change
significantly over two consecutive iterations. This usually occurred around the 500th iteration. The
reason behind using a convergence criterion was to automatically cut down the number of unrequired
classifications in the cross-validation procedure. In fact, for 7 recorded gestures with 5 repeats each,
the total number of classifications to perform in a 5-fold cross-validation would be 75=78125.
After training, the classifier was tested by classifying 7 hand gestures (excluding 'rest' position).
Firstly, the classification error was calculated for a fixed window overlap of 25ms as applied in [21]
for 2 and 4 electrode channels for all window lengths (50 - 550ms). However, our experimental
set-up differed from [21] in the type of hand gestures acquired since finger movements have been
included in our study. Following this, the effect of window length, overlap and number of recording
channels on the accuracy of classifying hand gestures into one of 7 motion classes was determined, by
calculating the classification error in all combinations of the following cases for each participant: • for window lengths 50, 100, 150, 200, 250, 300, 350, 400, 450, 500 and 550ms,
• for 0%, 10%, 20%, 30%, 40%, 50%, 60%, 70%, 80% and 90% window overlap,
• when using 2, 4, 6, 8, 10, 12, 14 and 16 electrodes from the electrode matrices (half the
number of electrode channels being taken from the electrode matrix placed over the flexor muscles
and the other half from the extensor matrix).
Descriptive statistics, i.e., the mean and standard deviations of the classification errors of each
participant data group, i.e., able-bodied, partial-hand and trans-radial amputees, for each of the above
cases were then calculated and analyzed.
IV. RESULTS
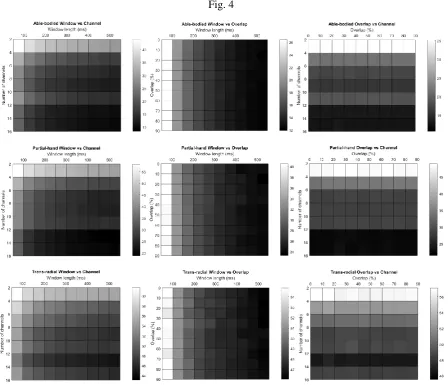
The interaction between the various factors for all participant groups can be visualized using the
surface plots in Fig. 4. It is observed that the surface patterns of the able-bodied and partial-hand
groups are mostly similar, while the trans-radial category has some differences. For all participant
groups, the increase in temporal information, produced by increasing the window length, results in
lower classification error. However, the degree of reduction of the error is influenced by the number
of electrode channels and is independent of the degree of overlap. Increasing the spatial information
by adding more electrodes does not guarantee lower classification error. Therefore, the same
classification error can be achieved with different sets of parameter values. These interactions are
explained in detail in the following sub-sections.
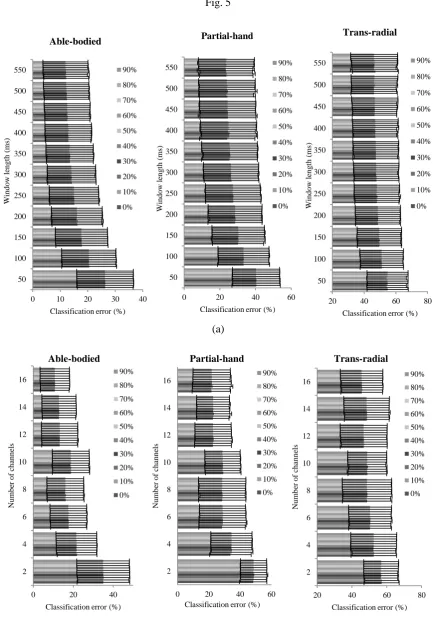
The degree of overlap was not responsible for variation in classification error, irrespective of window
length, number of channels or limb deficiency. Fig. 5(a) illustrates the interaction between the
analysis window length ranging from 50ms to 550ms and the window overlap ranging from 0% to
90%. For any given window length, the mean classification error remains the same across all window
overlaps. Similarly, Fig. 5b shows that the classification error does not vary for any given number of
channels from 2 to 16, when the overlap is increased from 0% to 90%. These results are consistent
between all participant groups. Since the degree of overlap is thus proven to be independent of the
classification error, the analyses in the following sections were carried out with an overlap of 50%,
except in one experiment in Section IV B, where a fixed overlap of 25ms has been used for all
window lengths.
B. Effect of analysis window length
The classification error decreased when the analysis window length was increased as shown in Fig. 4,
5, 6 and 7. This trend was consistent across different number of recording channels and degrees of
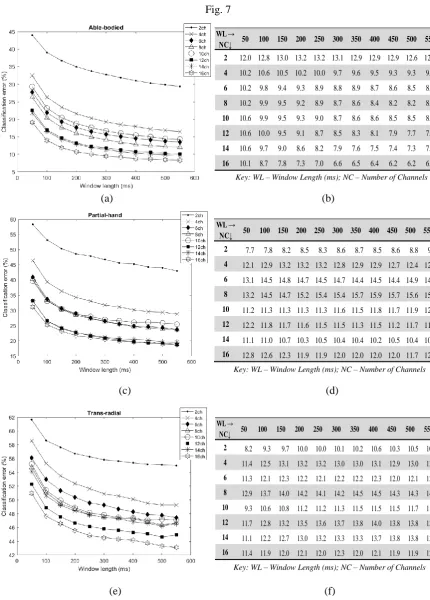
overlap, irrespective of limb deficiency. Fig. 6 depicts the results for able-bodied participants where a
comparison is made only for the 2-channel and 4-channel cases for the first and second recording
sessions, using a fixed window overlap of 25ms. This value of overlap was determined by [21] based
on the controller delay deemed acceptable in their real-time experiments and was employed in their
offline computation of classification error for all analysis window lengths. For purposes of comparing
the trend in the change in classification error associated with different window lengths, we employed
the same degree of overlap of 25ms in this experiment of our study. In terms of the length of the
overlap relative to the analysis window length, this resulted in overlaps of 50% for 50ms window,
16.67% for 150ms, 10% for 250ms, 7.14% for 350ms, 5.56% for 450ms and 4.55% for 550ms. The
results provided in Fig. 6 show that in each case, the classification error reduces with longer analysis
window lengths. We infer that the inclusion of finger movements in the gesture set has not resulted in
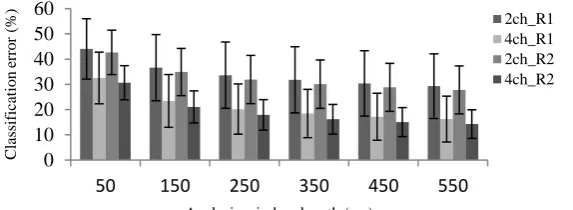
Fig. 7 and Fig. 8 depict the interaction between the window analysis length and the number of
electrode channels and the condition of the limb. Fig. 7 provides the classification error computed for
analysis window lengths ranging from 50ms to 550ms with 50% overlap and for different number of
electrode channels 2, 4, 6, 8, 10, 12 and 16. In the case of able-bodied participants (Fig. 7a) as well as
partial-hand (Fig. 7c) and trans-radial (Fig. 7e) amputee participants, the classification error reduces
with longer window lengths, irrespective of the number of channels.
Fig. 8 depicts the average reduction in classification error by step-wise increments of the window
length by 50ms. It can be observed that the maximum average reduction in classification error is
achieved by increasing the window length from 50ms to 100ms, for all participant groups. The
partial-hand group recorded the highest reduction in classification error of approximately 7%, which was
observed in the 4-channel case (classification error falling from 46% to 39%) and the 6-channel case (41% → 34%). For the able-bodied participants, this was observed to be approximately 6% with 4
channels (32% → 26%) and 10 channels (29% → 23%). The trans-radial amputee volunteers recorded 3.8% (55.2% → 51.4%) for the 10-channel case. Incrementing the window length from 250ms to
300ms and upwards provides no more than 1% average improvement in classification accuracy for
each step-wise increment of the window length, for all participant cases.
C. Type of limb deficiency
The amputee population was categorized as trans-radial and partial-hand amputees and the
classification error was computed separately, in order to compare their performance with that of the
able-bodied group. In all groups, the highest classification error was observed when using 2 channels
and 50ms window length, hereby referred to as the ‘worst case scenario’. As seen in Fig. 7e, the
minimum mean classification error for trans-radial amputees was 43.1%, which was achieved using
16 channels and an analysis window length of 550ms. This was an improvement of 18.6% over the
worst-case scenario, i.e., 61.7% error. However, the partial-hand amputees achieved a minimum mean
classification error of 18.75% using 12 channels and 550ms window length, which was an
improvement in performance is similar to that observed (35.7%) in the able-bodied group (44% →
8.3%) in Fig. 7a.
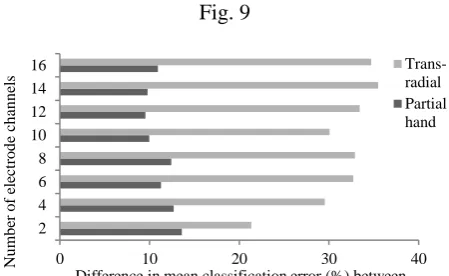
Furthermore, it is observed in Fig. 9 that in the case of 200ms analysis window and 50% window
overlap, for all electrode counts considered in this study, the mean classification error for partial-hand
participants was higher than that of the able-bodied group by 11.3% (±1.5%). However, similar
results are not observed for trans-radial amputees, for whom the mean classification error exceeds that
of the able-bodied group by 31.5% (±4.3%).
D. Effect of number of channels
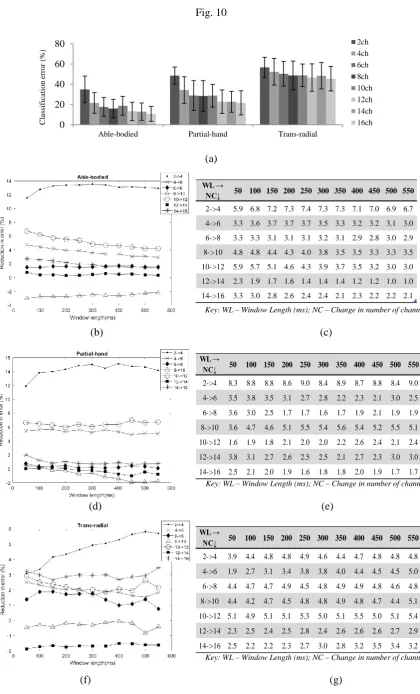
The results illustrated in Fig. 10a show that the type of limb deficiency dictates the benefits of adding
more electrode channels. When using a window length of 200ms and 50% window overlap, the
increase in the number of channels from 2 to 4 resulted in the mean classification error for trans-radial amputees falling by 4.3% (56.7% → 52.4%). However, the decrease in mean classification error was
more than 3 times higher for the able-bodied (13.4%, 35% → 21.6%) and partial-hand amputees (14.3%, 48.6% → 34.3%). By increasing the number of channels from 2 to 16, a total reduction of
11.2% (56.7% → 45.5%) is accomplished for trans-radial participants. The other two groups showed
more than double the reduction compared to the trans-radial case, i.e., error reduction was 24.3% (35% → 10.7%) for able-bodied participants and 26.9% (48.6% → 21.7%) for partial-hand volunteers.
Fig. 10b, 10d and 10f illustrate the average reduction in classification error achieved by incrementing
the channel count by 2 channels at a time, and its interaction with the analysis window length. A
generalized trend is not observed for any of the volunteer groups. Incrementing the number of
electrodes by 2 does not result in a uniform improvement in performance. For instance, increasing the
number of channels from 2 to 4 and 4 to 6, produces a reduction in error for all volunteer groups, with
the highest reduction being in the former case. However, incrementing the channel count from 8 to 10
and 12 to 14 produces no or negative effects on the classification accuracy. Moreover, the addition of
to longer window lengths. This is especially observed in the case of the trans-radial group where the
trend in error reduction is more variable than the other two groups for different window lengths.
V. DISCUSSION
The results observed in this study show that several factors affect classification accuracy and a
complex interplay exists between these factors. The observations on the effect of window length on
classification accuracy are similar to previous studies [18], [20], [21]. However, the effect of number
of electrode channels differs when compared to previous works as discussed later in this section. We
provide pair-wise interactions of the window length, the number of channels and the window overlap
on classification error using data from able-bodied and amputee participants. This has enabled the
analysis of classification error for three cohort groups, i.e., able-bodied, partial-hand amputations and
trans-radial amputations. Such a comparison is a novel part of our study. Moreover, our results are
also reported in terms of percentage reduction in classification error, as this is useful for optimizing
classification accuracy in configuring a prosthesis for a user and aids in the identification of the
optimal and individualized electrode location sites to incorporate in the design and fitting of the
socket for a myoelectric prosthesis.
Real-time studies have shown that the overlapped windowing technique is useful for reducing
controller delays and, when used with post processing schemes, for increasing classification accuracy
[20]. However, the first stage in the development of a prosthetic device involves the offline analysis
of classification accuracy for the selection of optimum parameters. Studies on the effect of window
overlap on classification accuracy in offline tests have not been reported to the best of our knowledge
and we therefore aimed to show this for any given window length, number of channels and limb
condition type. Our results in Fig. 4 and 5 show that the extent of window overlap when using an
overlapped windowing technique has no direct effect on the classification accuracy.
From the results on the effect of window length, it is seen that the reduction in error associated with
increasing the window length depends on the number of channels. This observation was reported by
increased channel count compensates for the reduced temporal information. For instance, in our
results for able-bodied participants (Fig. 7a), the advantage of increasing the window length from
50ms to 550ms is more for the 2-channel case (15% reduction, 44%→29%) than the 16-channel case (11% reduction, 19%→8%). However, the relation between the number of channels and the window
lengths varies, as shown in the case of 6 and 8 channels, both achieving a reduction in error of 14%
(27% → 13% and 26% → 12%, resp.). Moreover, from our results we infer that the optimal range of
150ms-250ms recommended by Smith et al. [21], is applicable to data acquired from able-bodied and
amputee subjects. Lastly, it is noticed that the classification error reported by Smith et al. [21] is less
than that observed in our study. This could be due to the inclusion here of tasks that include
fractionated finger movements. Such tasks have a higher dependency on the modulation of muscle
activity from the intrinsic hand muscles in able-bodied subjects than for tasks where differential finger
movement is not required, and accordingly presents a greater classification challenge when the EMG
is sampled exclusively from the forearm musculature alone [24]. Earley et al. [15], based on data
acquired from 3 forearm sited electrodes, reported classification errors of approximately 25% using a
500ms window length for hand grasps performed with the wrist held in a neutral posture, values
which are more comparable to those observed in our experiments.
The influence of limb deficiency on classification error when increasing the number of channels, as
seen in Fig. 4 and Fig. 10, highlights that amputee volunteers cannot be considered as a homogeneous
group particularly when both partial-hand and trans-radial amputees are recruited to a study. The
higher performance of partial-hand amputees compared to trans-radial amputees is understandable
given that they present with an intact forelimb free of the muscle resection necessary during surgical
trans-radial amputation or stump formation following trauma.
The effect of the number of recording channels also shows that selecting the optimum number for an
individual is essential to minimize classification error. For able-bodied subjects, a reduction of 13.4%
was observed in increasing the number of channels from 2 to 4 and a further 5% reduction on
incrementing the channel count from 4 to 6. This concurs with the results reported by Gajendran et al.
on the type of limb deficiency. Trans-radial amputees benefitted by only 4.3% reduction in error when
the number of channels was increased from 2 to 4, while partial-hand amputees showed 14.3% error
reduction, which is comparable to the reduction observed in the case of able-bodied participants. It
must be noted however, that a bias may exist in these results since the number of trans-radial
amputees is higher than that of the partial-hand amputees (8 vs. 5). The negative effect of increasing
the number of channels from 8 to 10 on classification accuracy, is a deviation from that reported in
literature [24] but may simply reflect similarity in the EMG activation patterns of the additional sites
recruited to those already sampled.
VI. CONCLUSION
In conclusion, an insight on the temporal and spatial factors affecting classification accuracy has been
provided in this paper. The investigation has brought to light the importance of considering the
interplay of these factors when attempting to achieve the highest possible classification accuracy for
grip gesture control by users of myoelectric prosthesis.
REFERENCES
[1] M. A. Oskoei and H. Hu, “Myoelectric control systems-A survey,” Biomed. Signal Process. Control, vol. 2, no. 4, pp. 275–294, 2007.
[2] K. Englehart, B. Hudgins, P. a. Parker, and M. Stevenson, “Classification of the myoelectric signal using time-frequency based representations,” Med. Eng. Phys., vol. 21, no. 6–7, pp. 431–438, 1999.
[3] M. Ortiz-Catalan, B. Hakansson, and R. Branemark, “Real-Time and Simultaneous Control of Artificial Limbs Based on Pattern Recognition Algorithms.,” IEEE Trans. Neural Syst. Rehabil. Eng., vol. 4320, no. c, pp. 756–764, 2014.
[4] A. J. Young, L. H. Smith, E. J. Rouse, and L. J. Hargrove, “Classification of simultaneous movements using surface EMG pattern recognition,” IEEE Trans. Biomed. Eng., vol. 60, no. 5, pp. 1250–1258, 2013.
[5] P. McCool, N. Chatlani, L. Petropoulakis, J. Soraghan, R. Menon, and H. Lakany, “Lower Arm Electromyography (EMG) Activity Detection Using Local Binary Patterns.,” IEEE Trans. Neural Syst. Rehabil. Eng., vol. 4320, no. c, 2014.
[6] L. Hargrove, Y. Losier, B. Lock, K. Englehart, and B. Hudgins, “A real-time pattern recognition based myoelectric control usability study implemented in a virtual environment,” Annu. Int. Conf. IEEE Eng. Med. Biol. - Proc., pp. 4842–4845, 2007.
[7] X. Chen, D. Zhang, and X. Zhu, “Application of a self-enhancing classification method to electromyography pattern recognition for multifunctional prosthesis control.,” J. Neuroeng. Rehabil., vol. 10, no. 1, p. 44, 2013.
[8] H. Zhang, Y. Zhao, F. Yao, L. Xu, P. Shang, and G. Li, “An adaptation strategy of using LDA classifier for EMG pattern recognition,” Proc. Annu. Int. Conf. IEEE Eng. Med. Biol. Soc. EMBS, pp. 4267–4270, 2013.
[9] E. J. Scheme, K. B. Englehart, and B. S. Hudgins, “Selective classification for improved robustness of myoelectric control under nonideal conditions,” IEEE Trans. Biomed. Eng., vol. 58, no. 6, pp. 1698–1705, 2011.
[11] S. Amsuss, P. M. Goebel, N. Jiang, B. Graimann, L. Paredes, and D. Farina, “Self-correcting pattern recognition system of surface EMG signals for upper limb prosthesis control,” IEEE Trans. Biomed. Eng., vol. 61, no. 4, pp. 1167–1176, 2014.
[12] L. J. Hargrove, E. J. Scheme, K. B. Englehart, and B. S. Hudgins, “Multiple binary classifications via linear discriminant analysis for improved controllability of a powered prosthesis,” IEEE Trans. Neural Syst. Rehabil. Eng., vol. 18, no. 1, pp. 49–57, 2010.
[13] R. Menon, G. Di Caterina, H. Lakany, L. Petropoulakis, B. a. Conway, and J. J. Soraghan, “Automatic misclassification rejection for LDA classifier using ROC curves,” Proc. Annu. Int. Conf. IEEE Eng. Med. Biol. Soc. EMBS, vol. 2015-November, pp. 482– 485, 2015.
[14] A. Fougner, E. Scheme, A. D. C. Chan, K. Englehart, and Ø. Stavdahl, “Resolving the limb position effect in myoelectric pattern recognition,” IEEE Trans. Neural Syst. Rehabil. Eng., vol. 19, no. 6, pp. 644–651, 2011.
[15] E. J. Earley, L. J. Hargrove, and T. a. Kuiken, “Dual window pattern recognition classifier for improved partial-hand prosthesis control,” Front. Neurosci., vol. 10, no. FEB, pp. 1–12, 2016.
[16] A. J. Young, L. J. Hargrove, and T. a. Kuiken, “The effects of electrode size and orientation on the sensitivity of myoelectric pattern recognition systems to electrode shift,” IEEE Trans. Biomed. Eng., vol. 58, no. 9, pp. 2537–2544, 2011.
[17] A. J. Young, L. J. Hargrove, and T. a. Kuiken, “Improving myoelectric pattern recognition robustness to electrode shift by changing interelectrode distance and electrode configuration,” IEEE Trans. Biomed. Eng., vol. 59, no. 3, pp. 645–652, 2012.
[18] M. Zardoshti-Kermani, B. C. Wheeler, K. Badie, and R. M. Hashemi, “EMG feature evaluation for movement control of upper extremity prostheses,” IEEE Trans. Rehabil. Eng., vol. 3, no. 4, pp. 324–333, 1995.
[19] Y. Huang, K. B. Englehart, B. Hudgins, and A. D. C. Chan, “A Gaussian mixture model based classification scheme for myoelectric control of powered upper limb prostheses,” IEEE Trans. Biomed. Eng., vol. 52, no. 11, pp. 1801–1811, 2005.
[20] K. Englehart and B. Hudgins, “A robust, real-time control scheme for multifunction myoelectric control.,” IEEE Trans. Biomed. Eng., vol. 50, no. 7, pp. 848–854, 2003.
[21] L. H. Smith, L. J. Hargrove, B. A. Lock, and T. A. Kuiken, “Determining the optimal window length for pattern recognition-based myoelectric control: Balancing the competing effects of classification error and controller delay,” IEEE Trans. Neural Syst. Rehabil. Eng., vol. 19, no. 2, pp. 186–192, 2011.
[22] T. R. Farrell and R. Weir, “Analysis Window Induced Controller Delay for Multifunctional Prostheses,” Myoelectric Control. Symp., pp. 225–228, 2008.
[23] T. R. Farrell and R. F. Weir, “The optimal controller delay for myoelectric prostheses,” IEEE Trans. Neural Syst. Rehabil. Eng., vol. 15, no. 1, pp. 111–118, 2007.
[24] G. Li, A. E. Schultz, and T. a. Kuiken, “Quantifying pattern recognition- based myoelectric control of multifunctional transradial prostheses,” IEEE Trans. Neural Syst. Rehabil. Eng., vol. 18, no. 2, pp. 185–192, 2010.
[25] OT Bioelectronica, “Adhesive matrix ELSCH064R3S pin out,” 2015. [Online]. Available: http://www.otbioelettronica.it/en/downloads/miscellanea.
[26] B. Hudgins, P. Parker, S. Member, N. Robert, and S. Member, “A new strategy for multifunction myoelectric control.pdf,” vol. 40, no. I, pp. 82–94, 1993.
TABLE & FIGURE CAPTIONS
Table 1: Window overlap used in previous studies
Table 2: Amputee participant information
Fig. 1. Experimental set up:
(a) and (b) Positioning of the two 64-channel electrode arrays on flexor compartment muscles and
extensor compartment muscles, resp.; (a) to (e) partial-hand amputation of participants C01, C02,
C03, C04 and C06, resp.; (f) Mirror box positioned over amputated arm
Fig. 2. Pin out of OT Bioelectronica adhesive 64 channel matrix ELSCH064R3S and the electrodes
selected on one matrix for obtaining required number of channels. For example, in a 4-channel case,
pins 16 and 48 are selected as the electrodes in each of the flexor and extensor electrode matrix to
achieve a total of 4 channels.
Fig. 3. Hand gestures recorded: (a) open, (b) close, (c) pinch, (d) point, (e) opposition, (f) lateral grip,
(g) tripod
Fig. 4. Surface plots illustrating interplay between factors: Classification error for able-bodied (top
row), partial-hand (middle row) and trans-radial (bottom row) participants in the case of: Column 1 -
50% overlap and window lengths from 50ms to 550ms and number of channels from 2 to 16, Column
2 - 8 channels and window lengths from 50ms to 550ms and window overlap from 0% to 90%,
Column3 - 200ms window length and overlap from 0% to 90% and number of channels from 2 to 16.
The variations in shading from white to dark gray correspond to decreasing classification error.
Fig. 5. Effect of overlap: Classification error for able-bodied, partial hand and trans-radial amputee
participants for EMG segmentation done with window overlaps of 0%, 10%, 20%, 30%, 40%, 50%,
60%, 70%, 80% and 90% (a) for window lengths from 50ms to 550ms when using 8 channels and (b)
for number of channels from 2 to 16 when using 200ms analysis window length. Error bars denote 1
Fig. 6. Effect of analysis window length on classification error using 25ms window increment for
able-bodied participants (overlap as a percentage of window length: 50% overlap for 50ms window, 16.67%
for 150ms, 10% for 250ms, 7.14% for 350ms, 5.56% for 450ms and 4.55% for 550ms). Results
generated over two recording sessions, R1 and R2, using 2 and 4 electrode channels are provided.
Fig.7. Mean classification error for various window lengths and number of channels: (a) able-bodied,
(c) partial-hand and (e) trans-radial amputee participant data for 50% window overlap and using 2, 4,
6, 8, 10, 12, 14 and 16 electrode channels. The error in figures (a), (c) and (e), expressed as 1 positive
or negative standard deviation, is provided in (b), (d) and (f), resp.
Fig. 8. The average reduction in classification error achieved by incrementing the window length by
steps of 50ms for (a) able-bodied, (c) partial-hand amputees and (e) trans-radial amputees. x-axis
provides step-wise increment in window length, i.e., the first tick labeled '100' on the x axis refers to
the window length being incremented from 50ms to 100ms, the tick labeled '200' refers to the
increment from 150ms to 200ms and so on. The standard deviations are provided in (b), (d) and (f).
Fig. 9. Effect of limb deficiency: difference in mean classification error for 200ms analysis window
with 50% window overlap between partial-hand and able-bodied volunteers and between trans-radial
and able-bodied volunteers.
Fig. 10. Effect of number of channels: (a) interaction with limb deficiency, showing the mean
classification error for different volunteer groups employing 200ms window length and 50% overlap
and number of channels ranging from 2 to 16; (b) to (g) interaction with window length – (b), (d) and
(f) showing the average reduction in classification error when electrode count is incremented by 2
channels at a time for able-bodied, partial-hand amputees and trans-radial amputees, resp. The
Table 1
Study
Analysis window length
(ms)
Window increment
(ms)
Overlap (% window
length)
Huang et al.[19] 256 32 87.5
Young et al. [16] 250 50 80
Amsuss et al. [11] 128 50 60.94
Table 2
Participant
ID Age Gender
Level of amputation
Time since amputation in years
B01 68 M Mid TR 36
B02 64 M Mid TR 31
B03 57 M Kruckenberg 40
B04 75 M Mid TR 74
B05 56 M Long TR 22
B06 57 F Short TR Congenital
B07 37 M Long TR Congenital
B08 17 M Long TR Congenital
C01 44 F 5PH 1
C02 41 M 5PH 3
C03 45 M 5PH 3
C04 45 M 5PH 1
Fig. 1
(a) (b)
(c) (d)
Fig. 3
(a) (b) (c) (d)
Fig. 5
(a)
(b)
0 10 20 30 40
50 100 150 200 250 300 350 400 450 500 550
Classification error (%)
W in d o w l en g th ( ms) Able-bodied 90% 80% 70% 60% 50% 40% 30% 20% 10% 0%
0 20 40 60
50 100 150 200 250 300 350 400 450 500 550
Classification error (%)
[image:25.595.79.514.76.703.2]W in d o w l en g th ( ms) Partial-hand 90% 80% 70% 60% 50% 40% 30% 20% 10% 0%
20 40 60 80
50 100 150 200 250 300 350 400 450 500 550
Classification error (%)
W in d o w l en g th ( ms) Trans-radial 90% 80% 70% 60% 50% 40% 30% 20% 10% 0%
0 20 40
2 4 6 8 10 12 14 16
Classification error (%)
N u mb er o f ch an n el s Able-bodied 90% 80% 70% 60% 50% 40% 30% 20% 10% 0%
0 20 40 60
2 4 6 8 10 12 14 16
Classification error (%)
N u mb er o f ch an n el s Partial-hand 90% 80% 70% 60% 50% 40% 30% 20% 10% 0%
20 40 60 80
2 4 6 8 10 12 14 16
Classification error (%)
Fig. 6
0 10 20 30 40 50 60
50 150 250 350 450 550
Cl
assific
at
io
n
e
rr
o
r
(%)
Analysis window length (ms)
Fig. 7
Key: WL – Window Length (ms); NC – Number of Channels
(a) (b)
Key: WL – Window Length (ms); NC – Number of Channels
(c) (d)
Key: WL – Window Length (ms); NC – Number of Channels
(e) (f) WL →
NC↓ 50 100 150 200 250 300 350 400 450 500 550 2 7.7 7.8 8.2 8.5 8.3 8.6 8.7 8.5 8.6 8.8 9.5
4 12.1 12.9 13.2 13.2 13.2 12.8 12.9 12.9 12.7 12.4 12.5
6 13.1 14.5 14.8 14.7 14.5 14.7 14.4 14.5 14.4 14.9 14.5
8 13.2 14.5 14.7 15.2 15.4 15.4 15.7 15.9 15.7 15.6 15.5
10 11.2 11.3 11.3 11.3 11.3 11.6 11.5 11.8 11.7 11.9 12.2
12 12.2 11.8 11.7 11.6 11.5 11.5 11.3 11.5 11.2 11.7 11.5
14 11.1 11.0 10.7 10.3 10.5 10.4 10.4 10.2 10.5 10.4 10.6
16 12.8 12.6 12.3 11.9 11.9 12.0 12.0 12.0 12.0 11.7 12.0
WL →
NC↓ 50 100 150 200 250 300 350 400 450 500 550 2 12.0 12.8 13.0 13.2 13.2 13.1 12.9 12.9 12.9 12.6 12.7
4 10.2 10.6 10.5 10.2 10.0 9.7 9.6 9.5 9.3 9.3 9.1
6 10.2 9.8 9.4 9.3 8.9 8.8 8.9 8.7 8.6 8.5 8.6
8 10.2 9.9 9.5 9.2 8.9 8.7 8.6 8.4 8.2 8.2 8.2
10 10.6 9.9 9.5 9.3 9.0 8.7 8.6 8.6 8.5 8.5 8.5
12 10.6 10.0 9.5 9.1 8.7 8.5 8.3 8.1 7.9 7.7 7.7
14 10.6 9.7 9.0 8.6 8.2 7.9 7.6 7.5 7.4 7.3 7.3
16 10.1 8.7 7.8 7.3 7.0 6.6 6.5 6.4 6.2 6.2 6.2
WL →
NC↓ 50 100 150 200 250 300 350 400 450 500 550 2 8.2 9.3 9.7 10.0 10.0 10.1 10.2 10.6 10.3 10.5 10.5
4 11.4 12.5 13.1 13.2 13.2 13.0 13.0 13.1 12.9 13.0 13.2
6 11.3 12.1 12.3 12.2 12.1 12.2 12.2 12.3 12.0 12.1 12.0
8 12.9 13.7 14.0 14.2 14.1 14.2 14.5 14.5 14.3 14.3 14.5
10 9.3 10.6 10.8 11.2 11.2 11.3 11.5 11.5 11.5 11.7 11.3
12 11.7 12.8 13.2 13.5 13.6 13.7 13.8 14.0 13.8 13.8 13.8
14 11.1 12.2 12.7 13.0 13.2 13.3 13.3 13.7 13.8 13.8 13.9
Fig. 8
Key: WL – Change in Window Length (ms); NC – Number of Channels
(a) (b)
Key: WL – Change in Window Length (ms); NC – Number of Channels
(c) (d)
Key: WL – Change in Window Length (ms); NC – Number of Channels
(e) (f)
WL → NC↓ 50-> 100 100-> 150 150-> 200 200-> 250 250-> 300 300-> 350 350-> 400 400-> 450 450-> 500 500-> 550
2 1.2 0.7 0.5 0.5 0.5 0.5 0.7 0.3 0.3 0.4
4 1.1 0.5 0.5 0.3 0.4 0.4 0.3 0.4 0.3 0.4
6 1.0 0.7 0.4 0.4 0.3 0.2 0.3 0.3 0.2 0.2
8 1.4 0.7 0.6 0.3 0.3 0.3 0.2 0.2 0.2 0.3
10 1.5 1.0 0.6 0.6 0.5 0.4 0.3 0.4 0.3 0.2
12 1.3 0.7 0.6 0.5 0.2 0.2 0.3 0.2 0.2 0.2
14 1.3 0.8 0.5 0.5 0.3 0.5 0.3 0.2 0.2 0.1
16 1.6 0.9 0.5 0.4 0.4 0.3 0.2 0.3 0.2 0.4
WL → NC↓ 50-> 100 100-> 150 150-> 200 200-> 250 250-> 300 300-> 350 350-> 400 400-> 450 450-> 500 500-> 550
2 1.3 0.5 0.5 0.5 0.6 0.4 0.8 0.7 0.5 0.3
4 1.5 0.8 0.6 0.2 0.7 0.3 0.5 0.3 0.6 0.5
6 1.2 0.4 0.7 0.4 0.4 0.4 0.4 0.5 0.4 0.7
8 1.1 0.6 0.8 0.4 0.4 0.7 0.5 0.4 0.5 0.4
10 1.6 0.6 0.5 0.5 0.3 0.5 0.6 0.4 0.5 0.7
12 1.2 0.6 0.5 0.5 0.4 0.5 0.7 0.4 0.4 0.5
14 1.5 0.7 0.6 0.7 0.5 0.5 0.6 0.4 0.5 0.5
16 1.0 0.4 0.4 0.3 0.5 0.5 0.5 0.6 0.3 0.4
WL → NC↓ 50-> 100 100-> 150 150-> 200 200-> 250 250-> 300 300-> 350 350-> 400 400-> 450 450-> 500 500-> 550 2 1.7 0.6 1.0 0.7 0.4 0.6 0.5 0.3 0.5 0.8
4 1.9 0.6 0.4 0.7 0.6 0.4 0.2 0.4 0.4 0.4
6 2.1 0.5 0.3 0.4 0.3 0.4 0.3 0.2 0.8 0.8
8 2.5 0.9 1.1 0.5 0.4 0.5 0.2 0.5 0.7 0.6
10 1.8 0.6 0.4 0.4 0.5 0.1 0.5 0.2 0.7 0.5
12 1.4 0.6 0.3 0.3 0.5 0.5 0.3 0.5 0.6 0.6
14 0.8 0.4 0.4 0.4 0.4 0.6 0.5 0.3 0.4 0.6
Fig. 9
0 10 20 30 40
2 4 6 8 10 12 14 16
Difference in mean classification error (%) between partial-hand/trans-radial group and able-bodied group
N
u
mb
er
o
f
el
ec
tr
o
d
e
ch
an
n
el
s Trans-radial
Fig. 10
(a)
Key: WL – Window Length (ms); NC – Change in number of channels
(b) (c)
Key: WL – Window Length (ms); NC – Change in number of channels
(d) (e)
Key: WL – Window Length (ms); NC – Change in number of channels
(f) (g)
WL →
NC↓ 50 100 150 200 250 300 350 400 450 500 550
2->4 5.9 6.8 7.2 7.3 7.4 7.3 7.3 7.1 7.0 6.9 6.7
4->6 3.3 3.6 3.7 3.7 3.7 3.5 3.3 3.2 3.2 3.1 3.0
6->8 3.3 3.3 3.1 3.1 3.1 3.2 3.1 2.9 2.8 3.0 2.9
8->10 4.8 4.8 4.4 4.3 4.0 3.8 3.5 3.5 3.3 3.3 3.5
10->12 5.9 5.7 5.1 4.6 4.3 3.9 3.7 3.5 3.2 3.0 3.0
12->14 2.3 1.9 1.7 1.6 1.4 1.4 1.4 1.2 1.2 1.0 1.0
14->16 3.3 3.0 2.8 2.6 2.4 2.4 2.1 2.3 2.2 2.2 2.1 0
20 40 60 80
Able-bodied Partial-hand Trans-radial
C la ssi fi ca ti o n e rr o r (%) 2ch 4ch 6ch 8ch 10ch 12ch 14ch 16ch WL →
NC↓ 50 100 150 200 250 300 350 400 450 500 550
2->4 8.3 8.8 8.8 8.6 9.0 8.4 8.9 8.7 8.8 8.4 9.0
4->6 3.5 3.8 3.5 3.1 2.7 2.8 2.2 2.3 2.1 3.0 2.5
6->8 3.6 3.0 2.5 1.7 1.7 1.6 1.7 1.9 2.1 1.9 1.9
8->10 3.6 4.7 4.6 5.1 5.5 5.4 5.6 5.4 5.2 5.5 5.1
10->12 1.6 1.9 1.8 2.1 2.0 2.0 2.2 2.6 2.4 2.1 2.4
12->14 3.8 3.1 2.7 2.6 2.5 2.5 2.1 2.7 2.3 3.0 3.0
14->16 2.5 2.1 2.0 1.9 1.6 1.8 1.8 2.0 1.9 1.7 1.7
WL →
NC↓ 50 100 150 200 250 300 350 400 450 500 550
2->4 3.9 4.4 4.8 4.8 4.9 4.6 4.4 4.7 4.8 4.8 4.8
4->6 1.9 2.7 3.1 3.4 3.8 3.8 4.0 4.4 4.5 4.5 5.0
6->8 4.4 4.7 4.7 4.9 4.5 4.8 4.9 4.9 4.8 4.6 4.8
8->10 4.4 4.2 4.7 4.5 4.8 4.8 4.9 4.8 4.7 4.4 5.1
10->12 5.1 4.9 5.1 5.1 5.3 5.0 5.1 5.5 5.0 5.1 5.4
12->14 2.3 2.5 2.4 2.5 2.8 2.4 2.6 2.6 2.6 2.7 2.9