This is a peer-reviewed, accepted author manuscript of the following research output: Nolan, S., Strachan, S., Rakhra, P., & Frame, D. (2017). Optimized network planning of mini-grids for the rural electrification of developing countries. Paper presented at 2017 IEEE PES PowerAfrica Conference, Accra, Ghana.DOI: 10.1109/PowerAfrica.2017.7991274
Optimized Network Planning of Mini-Grids for the
Rural Electrification of Developing Countries
Steven Nolan, Scott Strachan, Puran Rakhra, Damien Frame
Department of Electronic and Electrical EngineeringStrathclyde University Glasgow, Scotland
Abstract—1.2 billion people, predominantly living in remote rural regions in countries of the Global South, currently live without access to any modern source of energy. Options for electrification of these communities include extending existing national grid infrastructure, deploying mini-grids, and installing standalone home systems (SHS). Deriving the most cost effective means of delivering energy to these consumers is a complex, multi-dimensional problem that normally requires determination on a case-by-case basis. However, optimization of the network planning may help to maximize the socio-economic return of the installed energy system. This paper presents an optimization process that minimizes the installation cost of a mix of generation sources for a rural mini-grid using a multi-objective particle swarm optimization (MOPSO) technique. Minimizing the cost of distribution layout is first formulated as a capacitated minimum spanning tree (CMST) problem and solved using the Esau-Williams method. Multiple cable sizes and source locations are then added to create a multi-level capacitated minimum spanning tree (MLCMST) problem, solved via a Genetic Algorithm (GA) employing Prim-Pred encoding. The method is applied to a case study village in India.
Keywords—Network Planning, Mini-grid, Minimum Spanning Tree, Renewable Energy.
I. INTRODUCTION
Over a billion people live without access to electricity and the benefits it brings to everyday life. Most of these people live in rural areas of developing countries where extension of the national grid can be both expensive and technically challenging due to complex terrain and diffuse populations. Given the modest energy needs, and limited income, of these remote communities, extension of the national grid quickly becomes an unappealing prospect for governments and utility owners [1]. Without access to utility energy, rural communities are generally forced to rely on costly, carbon intensive fuels such as fuelwood and paraffin to meet their daily energy needs (i.e. cooking and lighting) [1]. COP 21 saw an international consensus that more investment in renewable energy solutions across the Global South could succeed in combatting the effects of climate change whilst addressing global energy access issues [2].
Historically, the off-grid market has been served by non-profit organizations and social enterprises (NGOs and ESCOs) deploying domestic single-home energy systems, energy kiosks and small community micro-grid infrastructure [3]. The reducing cost of solar photovoltaic technology, and the passive nature of the technology, means that it can provide clean solutions with low maintenance at increasingly affordable
capital costs. Despite this, the initial capital remains an issue for consumers and producers in the economically challenging developing countries market. While being able to support small domestic loads such as lighting and mobile phone charging, the inability to provide higher levels of power for productive uses (e.g. maize mills, agro-businesses and cooking), limits the impact of stand-alone SHS solutions on the broader community [4]. The concept of using a mini-grid that can interconnect multiple generation sources and loads to mobilize the combined resources of a community, has emerged as a potentially more effective and efficient community-based energy solution [5].
The 2012 Energy Access Practitioner Network report published at Rio+20 and the International Energy Agency, predict that achieving universal electricity access within the 2030 target timeframe of SE4ALL and Sustainable Development Goal (SDG) No.7 [6], will require 60% of new connections to be delivered via off-grid, renewable-based solutions (18% from stand-alone systems and 42% from mini-grids), with the remaining 40% delivered via main grid expansion [7]. The Overseas Development Institute and Oxfam America report that to achieve energy access for all by 2030 in Sub-Saharan Africa alone, will require a global investment of $11b per year in decentralized (off-grid) solutions [8].
Determining which solution (grid extension, mini-grids or standalone systems) are best suited to a community is a complex and multi-dimensional problem, which should consider various technical, economic, environmental and social factors. This paper focuses on an optimization-based approach to minimizing the overall installed generation and storage capacity, as well as the network cable lengths required of a mini-grid, hence minimizing the associated capital expenditure and optimizing system-operating efficiency. The ultimate aim is to provide insight into the economic viability of a mini-grid installation as a community-based energy solution.
II. GENERATION MIX OPTIMIZATION
Generation mix accounts for the vast majority of cost in both standalone and mini-grid systems, with [9] showing that PV-panels and batteries contribute to approximately 60% of a typical 25 kWp mini-grid’s budget. Because of this, sizing the generation system is vital as it can significantly affect both consumer satisfaction and ability to pay. Sizing generation appropriately requires intimate knowledge of the community’s energy demands and locally available energy resources: renewable or otherwise. The former can be ascertained through community meetings and surveys, as well as comparison with other, similar, electrified communities as this could provide an indication of how their demand might change over time [10]. In order to calculate the available resources the type of generation being used will need to be considered and a variety of techniques can be used to gather this information.
Once the local resource and demand data is gathered, many techniques can be used to size generation and storage systems. There also exists software packages such as HOMER [11]. In this paper, MOPSO is used to minimize the cost of generation and storage sources while ensuring power availability constraints are met. MOPSO is a social search method that utilizes swarm intelligence to converge on optimal solutions. This technique has been selected due to its ability to find good solutions for this problem in short periods [12, 13]. It also allows excellent flexibility with programming constraints.
MOPSO consists of a set number, swarm, of particles moving through a search space in which every location is a potential solution to the objective function that requires optimization. The objective function for this problem is given by equation (1):
𝐶𝑜𝑠𝑡 = ∑(1 + 𝐷)𝐶𝑖(𝑡) 𝑡+
20
𝑡=1
∑(1 + 𝐷)𝑀𝑖(𝑡)𝑡+
20
𝑡=1
∑(1 + 𝐷)𝐹𝑖(𝑡) 𝑡 (1)
20
𝑡=1
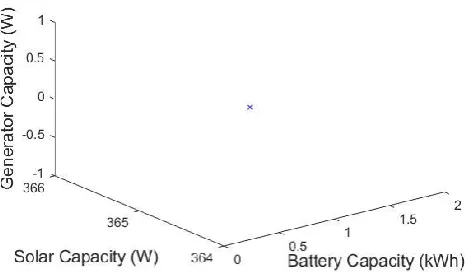
Where Ci is the capital cost of generation source i, M is the maintenance cost of generation source i, F is the fuel cost of generation source i. Upon initialization of this technique, particles are spawned at random locations within the search space (Fig. 1). Particles that are created outside the feasible search space break the constraints, and are deleted. This implementation considers the hybrid arrangement of solar PV generation, battery storage, and conventional diesel generation in order to meet power demand. Each energy source (PV, storage and diesel gen) is represented as a spatial dimension, leading to a three-dimensional search space in this instance, as shown in Fig. 1.
Following the initialization of MOPSO, the particles will evaluate the fitness of their current location in the search space. Each location corresponds to a specific capacity of a given source: the x-axis corresponds to solar power generation while the y-axis and z-axis correspond to battery storage and conventional generation capacity respectively. After this, and for every iteration of the technique, the particles will move around the search space, their position updated by equation (3), where X is the location of particle i in dimension j. As shown by
this relationship, the particle’s position is updated according to the velocity vector, V, which is calculated using equation (2).
The velocity vector uses the best-known location that the swarm has found, Gbest, and the best-known location that the individual has found, Pbest, when updating the particles movement. Where C1 and C2 are the cognitive and social capacity of the particles: particles tendency to search in the area of its personal best solution and the best solution globally. With the best solution being that which minimizes lifetime cost of the system. R1 and R2introduce random elements into the particle movements. This allows the particle to search in regions of the search space in which it has found good solutions while allowing convergence on global optima to occur (Fig. 2).
𝑉𝑖𝑗(𝑡 + 1) = 𝑉𝑖𝑗(𝑡) + 𝐶1 𝑅1(𝑃𝑏𝑒𝑠𝑡𝑖𝑗(𝑡) − 𝑋𝑖𝑗(𝑡))
+ 𝐶2 𝑅2(𝐺𝑏𝑒𝑠𝑡𝑖𝑗(𝑡) − 𝑋𝑖𝑗(𝑡)) (𝟐)
[image:2.595.326.555.78.208.2]𝑋𝑖𝑗(𝑡 + 1) = 𝑋𝑖𝑗(𝑡) + 𝑉𝑖𝑗(𝑡 + 1) (𝟑) The output of a solar array varies throughout the course of a year. As well as this, consumer demand is affected by seasonal changes in weather and light. For electrification to satisfy community needs, the generation system must accommodate these variations. To implement this feature, this approach takes the average hourly global horizontal radiation incident at a
Figure 1. Initialization of MOPSO swarm in the search space.
[image:2.595.312.545.556.692.2]specific location and calculates the output of a solar collector with a fixed tilt angle. This is calculated for every hour of the year so that an accurate prediction of solar generation potential can be obtained. A fixed tilt angle is assumed due to the reduced cost of these systems. The output of a solar panel is also temperature dependent. To ensure sizing is appropriate throughout the year, temperature data is incorporated using equation (4) where NOCT is the nominal operating cell temperature, Itot is the incident radiation, Tamb is the ambient temperature, and Tcell is the cell temperature [14]. The output of a solar panel is given by equation (5) where Pstcis the output power under standard testing conditions and k is the temperature coefficient of the cell [14].
𝑇𝑐𝑒𝑙𝑙 = 𝑇𝑎𝑚𝑏+
𝑁𝑂𝐶𝑇 − 20
800 𝐼𝑡𝑜𝑡 (𝟒)
𝑃𝑜𝑢𝑡(𝑡)= 𝑃𝑠𝑡𝑐
𝐼𝑡𝑜𝑡
1000 ( 1 − 𝑘(𝑇𝑐𝑒𝑙𝑙− 25)) (𝟓)
The constraints are implemented based on previous work conducted by the authors of [12]. It operates such that the program will always attempt to meet demand through solar generation in the first instance. If this is impossible then the model will attempt to use the battery storage backup to meet power requirements. The program will consider the connection of a diesel generator as a last resort back up. This approach is used to minimize the amount of fuel used, and the resulting cost. Fig. 2 shows the particles convergence on a solution.
III. NETWORK LAYOUT
While distribution equipment accounts for considerably less of the budget than generation sources, approximately 16% of overall spending in typical 25 kWp mini-grids according to [9], it is essential that the mini-grid is able to maintain appropriate power quality. In addition, in communities where income levels are typically less than $2 per day, it is necessary to reduce the cost to the end consumer wherever viable.
Minimizing the length and cost of a distribution network is analogous to the minimum spanning tree (MST) problem. However, the technical nature of a power network imposes additional constraints on the problem in the form of voltage regulation and cable current rating. Adequate voltage regulation is a requirement of any power distribution network due to the adverse effect voltage deviations can have on consumer appliances. This is no less true in a mini-grid, especially when consumers will likely lack the funds to repair damage caused by the violation of voltage constraints and any other potential power quality issues. To prevent poor voltage regulation, the MST produced must therefore obey the capacity constraints of voltage regulation and current rating while also connecting each node to the source. Adding these constraints causes the problem to become a capacitated minimum spanning tree (CMST), the optimal solution to which is NP-Hard. Two techniques are employed in this paper to find near optimal solutions to this problem.
A. Esau-Williams Heuristic
The first technique is called Esau-Williams Heuristic. While other methods exist for finding solutions, Esau-Williams Heuristic is commonly used due to its tendency to provide better
results [15]. In addition, its relatively simple procedure allows more time to be spent on programming constraints.
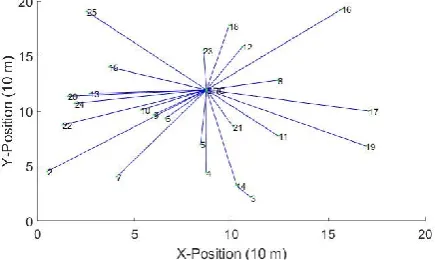
The procedure for Esau-Williams involves connecting each node to the source and then iteratively calculating the trade-off function. The trade-off function calculates the new connection between two nodes that minimizes the total length of line required by the network. For constraint evaluation, voltages are calculated at every node in the mini-grid network via the backward forward sweep method (BFSM) [16, 17]. The Esau-Williams implementation can quickly provide near optimal solutions with minimal computational effort as shown in Fig. 3 and Fig. 4.
B. Genetic Algorithm
[image:3.595.321.539.370.500.2]Solving the network-planning problem through the heuristic method alone allows near optimization of cable routing. However, this method assumes centralized generation at present, and does not consider the interconnection of distributed generation. It also does not allow different sizes of distribution cable cross-sectional area to be considered. When the latter feature is included, the problem becomes a multi-level capacitated minimum spanning tree (MLCMST), wherein connections can have different capacity constraints. The MLCMST problem is a generalization of the CMST and evolutionary algorithms, including Genetic Algorithms (GAs), are promising techniques for providing good solutions [18]. GA’s combine multiple known solutions called genomes to seed
[image:3.595.321.538.546.680.2]Figure 3. Initialization of Esau-Williams Heuristic.
new answers to the problem; such that the constituent parts (chromosomes) of two good solutions can be combined to create an answer that hopefully provides even greater fitness. However, there are a number of issues associated with the use of genetic algorithms for spanning tree problems. These result mainly because of the lack of inheritability and locality of the solutions created [19].
There are different types of encoding that can be used for MST GAs and [19] provides a good overview of the benefits and drawbacks of some popular methods. For this implementation Prim-predecessor encoding is used. Prim-predecessor encoding is based on Prim’s method and a predecessor based encoding scheme [20]. The method relies on encoding each edge in the genome by assigning each node a predecessor, storing the individual connections between loads in the network [20]. This means that the number of chromosomes within each genome is n-1 where n is the number of nodes in the network. Adapting Prim-pred to solve the MLCMST problem requires the use of an additional genome dimension. Each edge is assigned an additional value according to the distribution cable cross sectional area it corresponds to that is then encoded in the genome, creating a 2-dimensional structure to the genome. When two of the potential solutions are put together to create a new solution, prim’s method is used to select from the available edge-weighting combinations stored in the parent genomes [20].
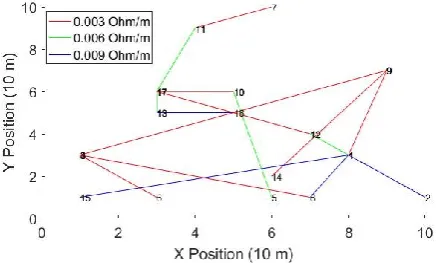
Through the application of this technique, the model is able to consider multiple line resistances and source locations. The evolution of solutions created through this method is demonstrated in Figs. 5, 6 and 7, where higher impedance cables offer a cheaper solution due to the lower amount of material. It can be seen that as the process goes on the successive generations produce lower cost results. Rather that producing one optimal solution, genetic algorithms can lead to a Pareto front of solutions that are equal in fitness. For a distribution network, this could give designers the opportunity to explore different system topologies and compare the relative benefits and drawbacks of each. While the use of a Prim-pred encoded GA allows many more variables to be considered during the optimization process, it is a much more computationally intensive process resulting in significantly increased processing times than the Esau-Williams heuristic. For this reason, it is more prudent to use the heuristic method for small interconnected systems with single sources and low variations in cables sizing’s. For mini-grids with potentially multiple source locations or a grid tie-in, the GA approach is more suitable.
IV. CASE STUDY
The methods described above have been applied to a case study consisting of a school campus (Pravaham) and a nearby town in rural India. Load data for six different building types in Pravaham were utilized to establish the following load profile types for each building:
• Lighting only
• Lighting plus small appliances • Electricity for all appliances
With each of the different levels of service, this produced 18 different demand profiles in total. Using the these load profiles the MOPSO and Esau-Williams optimization techniques were applied to the mini-grid design for the six node school campus and the thirty node town. These mini-grid options were then compared with the SHS alternatives.
A. Evaluation
[image:4.595.315.540.61.194.2]To evaluate the financial prospect of using a mini-grid in place of a solar home system the levelized cost of energy (LCoE) is calculated for the system. This allows inference into the amount that the consumers would have to pay per kWh of electricity. This in turn could be used in conjunction with community willingness-to-pay surveys to determine whether an electrification strategy is able to meet the community’s needs. Equation 6 shows the calculation for LCoE.
Figure 6. Best fitting solution found partway through GA search process.
[image:4.595.317.538.237.370.2]Figure 5. Best fitting solution at GA population initialization.
[image:4.595.45.266.569.700.2]𝐿𝐶𝑜𝐸 = ∑
𝐶𝑛+ 𝑀𝑛+ 𝐹𝑛
(1 + 𝑟)𝑛 𝑛=20
𝑛=1
∑ 𝐷𝑛
(1 + 𝑟)𝑛 𝑛=20
𝑛=1
(𝟔)
Where Cn, Mn, and Fn, are the capital, maintenance and fuel costs for year n, Dn is the demand for year n, and r is the discount ratio. A measurement that can be used to assess solar systems is performance ratio. The performance ratio is the ratio of power consumed by users of the system to the power generated. This gives an indication of how much power is being wasted which could be used to inform consumers of times during the year where additional loads could be connected, improving the net present value (NPV) of the system itself. B. Results and Discussion
MOPSO allows for a number of sensitivity studies to be conducted on how resource parameters can affect the generation sizing, mix, and ultimate cost to the end user. One particular issue with sizing solar systems is the potential for oversizing due to periods of extended low renewable energy availability. Sizing to meet stringent availability demands can make the system less economically feasible as shown on figure 8. This oversizing reduces the performance ratio of the solar panels, meaning that consumers on the network utilize a lower percentage of energy produced by the renewable energy source.
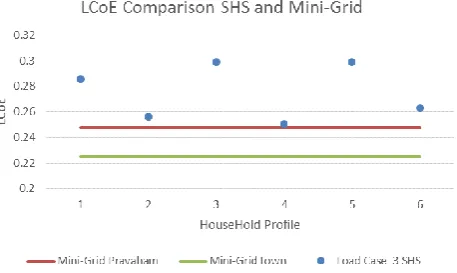
The case study load profiles provide three different level-of-service scenarios that were used to examine the impact of consumer demand on mini-grid LCoE and competitiveness with SHS. For each scenario the relevant set of six load profiles were used in the design of a mini-grid for the school and for design of six SHS. To design the town mini-grid, each of the thirty nodes in the town was allocated one of the six load profiles at random. The results of these cases are shown in Figs. 9, 10, and 11. It should be noted that because these load profiles come from a school, even the ‘lighting only’ case represents a demand profile much larger than a typical rural household does.
The lighting only case required a larger ratio of batteries owing to the use of devices exclusively at night. With the introduction of small day time loads a larger share of the budget was required for solar panels. The third scenario is the only one in which a diesel generator is included in the optimal solution
found by the particle swarm optimization program. The diesel generator runs for a marginal period of time (Inconsistent across four days) during extremely low PV availability. Its need could potentially be reduced through community awareness schemes. From these results, it can be seen that as the demand increases the LCoE of mini-grids decreases and becomes a more viable alternative to each household. The reason for this is due to improvements in both the performance ratio and load factor, which occurs due to the mini-grid generation being utilized more effectively across each successive demand scenario. This
0 0.05 0.1 0.15 0.2 0.25 0.3
100 99 98 95 90
LCoE(£)
A
vai
lab
ili
ty
R
e
q
u
ir
e
me
n
t (
%
)
[image:5.595.324.553.183.313.2]Impact of Power Availability on LCoE
[image:5.595.325.552.370.498.2]Figure 9. Comparison of SHS solution and using mini-grid for lighting only case.
Figure 10. Comparison of SHS solution and using mini-grid for lighting plus small appliances case.
Figure 11. Comparison of SHS solution and using mini-grid for all electrical appliances case.
[image:5.595.324.553.545.681.2] [image:5.595.41.276.545.696.2]increase in performance ratio is due to not only better sizing but also the increase in load factor between each of the demand profiles. An increase in load factor means that the power drawn from the generation sources is more sustained. This in turn has the effect of improving the performance ratio; demand is served more consistently and there are fewer periods of low demand concurring with high resource availability. A more sustained demand implies that the mini-grid contains productive loads during the day. This shows that not only are mini-grids capable of providing for capacity increasing loads, but that they are vital to reducing the cost to the end consumer.
V. CONCLUSION
This paper has demonstrated an optimization model used to reduce the cost of implementing mini-grid systems in developing countries. This was achieved through MOPSO for optimization of the energy generation mix and with an Esau-Williams heuristic to optimize the layout of a distribution network. Building on this it is shown how a genetic algorithm with Prim-Pred encoding can allow for a greater amount of variables to be included in the optimization of the distribution network layout. This gives the designer the opportunity to consider different cable sizing’s as well as source location. The benefits and drawbacks of these methods have also been discussed.
To demonstrate this approach, it is shown how these methods can be applied to a case study to perform LCoE studies. This is done by taking into account local resource availability and costs as well as consumer demand profiles and the location of each load. Through the application of this method, it is shown how demand profiles can affect the adoption of a mini-grid or a solar home system in a particular case.
Future work will study the efficiency gains of this optimized mini-grid design method over traditional design approaches. The inclusion of other renewable resources and grid interfaces will be considered; greatly expanding the number of cases this software tool is applicable too. As well as this, an assessment of the methods presented in carrying out sensitivity studies is required to determine the applicability of the tools to a wider array of cases. In addition, a thorough comparison between the two methods used for cable routing in terms of computational speed and applicability to given cases will be carried out. Ultimately, it is hoped that a tool such as this could be used to inform network planners of conditions favourable to adopt either grid extension, mini-grid or solar home system as the best solution for a given case study.
REFERENCES
[1] Jamal Saghir, “Energy and Poverty: Myths, Links and Policy Issues”, Worldbank, Energy Working Notes, May 2005, Available at:
http://siteresources.worldbank.org/INTENERGY/Resources/EnergyWor kingNotes_4.pdf
[2] United Nations, “Framework Convention on Climate Change (2015) Adoption of the Paris Agreement”, 21st Conference of the Parties, Paris: United Nations.
[3] Bloomberg, Light Global, and World Bank Group “Off-grid solar market trends report 2016”, Feb. 2016. [online] available at :
http://www.energynet.co.uk/webfm_send/1690
[4] “The implementation of Solar Home Systems as a poverty reduction strategy—A case study in Sri Lanka” Author: Dino Laufer Date Published: 20 August 2011 Available at:
http://www.sciencedirect.com/science/article/pii/S0973082611000482
[5] “Opportunities and Challenges for Solar Minigrid Development in Rural India” Author: N. Thirumurthy Date Published: September 2012, Available at: http://www.nrel.gov/docs/fy12osti/55562.pdf
[6] United Nations General Assembly, “Resolution adopted by the General Assembly on 25 September 2015“, United Nations, Sept. 2015 [online] Available at: http://www.un.org/ga/search/view_doc.asp?symbol=A/RES/70/1&Lang =E
[7] United Nations Foundation,“Energy Access Practitioner Network, Towards Achieving Universal Energy Access by 2030” UN. Foundation, June 2012, [online] available at: http://energyaccess.org/wp- content/uploads/2015/07/EAPN-Towards-Achieving-Universal-Energy-Access-by-2030.pdf
[8] Ryan Hogarth and Ilmi Granoff “Speaking truth to power: Why energy distribution, more than generation, is Africa’s poverty reduction challenge”, Oxfam,May 2015, [online] available at: https://policy-practice.oxfamamerica.org/static/media/files/FINAL_speakingpowertotr uth_SH.pdf
[9] “A techno-economic comparison of rural electrification based on solar home systems and PV-microgrids” Author: A chaurey Date published: 18 February 2010 Available at:
http://www.sciencedirect.com/science/article/pii/S0301421510000807
[10] Energy Sector Management Assistance Programme, UNDP/World Bank, “Mini-grid Design Manual”,Chap. 4. World Bank, Sept 2000, Available at:
https://www.esmap.org/sites/esmap.org/files/TR_minigriddesignmanual 21364.pdf
[11] "HOMER Pro - Microgrid Software For Designing Optimized Hybrid Microgrids". Homerenergy.com. N.p., 2017. Web. 10 Feb. 2017. [12] “Hanieh Borhanazad, Saad Mekhilef, Velappa Gounder Ganapathy,
Mostafa Modiri-Delshad, Ali Mirtaheri, “Optimization of micro-grid system using MOPSO, Renewable Energy”, Volume 71, November 2014, Pages 295-306, ISSN 0960-1481,
[13] Mohamed MA, Eltamaly AM, Alolah AI. PSO-Based Smart Grid Application for Sizing and Optimization of Hybrid Renewable Energy Systems. Du W-B, ed. PLoS ONE. 2016;11(8):e0159702. doi:10.1371/journal.pone.0159702.G.
[14] Ádám, K. Baksai-Szabó and P. Kiss, “Energy production estimating of photovoltaic systems” International Conference on Renewable Energies and Power Quality (ICREPQ’12),Santiago de Compostela (Spain), March, 2012
[15] Ayse Selin Kocaman, Woonghee Tim Huh, Vijay Modi, “Initial layout of power distribution systems for rural electrification: A heuristic algorithm for multilevel network design”, Applied Energy, Volume 96, August 2012, Pages 302-315, ISSN 0306-2619,
[16] S. Ghosh, D. Das, “Method for load-flow solution of radial distribution Networks”, IEE Proceedings Generation Transmission and Distribution, Vol. 146, No. 6, November 1999.
[17] M. Thomson, D.G. Infield, “Network Power-Flow Analysis for a High Penetration of Distributed Generation”, IEEE Transactions on Power Systems, Vol. 22, No. 3, August 2007.
[18] Ioannis Gamvros, Bruce Golden, S. Raghavan, “The Multilevel Capacitated Minimum Spanning Tree Problem” INFORMS Journal on Computing ,Vol. 18, No. 3, Summer 2006, pp. 348–365
[19] G. Carrano, C. M. Fonseca, R. H. C. Takahashi, L. C. A. Pimenta and O. M. Neto, "A preliminary comparison of tree encoding schemes for evolutionary algorithms," 2007 IEEE International Conference on Systems, Man and Cybernetics, Montreal, Que., 2007, pp. 1969-1974. [20] Lin Lin et al. “Node-Based Genetic Algorithm for Communication