A Variance-Based Estimation of the Resilience Indices in the Preliminary
Design Optimisation of Engineering Systems Under Epistemic Uncertainty
Carlos Ortega Absil
PhD candidate, Aerospace Centre of Excellence, Mechanical and Aerospace Engineering University of Strathclyde, James Weir Building, 75 Montrose Street, Glasgow, UK
E-mail: carlos.ortega@strath.ac.uk
Gianluca Filippi
Postgraduate Researcher, Aerospace Centre of Excellence, Mechanical and Aerospace Engineering University of Strathclyde, James Weir Building, 75 Montrose Street, Glasgow, UK
E-mail: gianluca.filippi@strath.ac.uk
Annalisa Riccardi
Lecturer, Intelligent Computational Engineering Laboratory, Mechanical and Aerospace Engineering University of Strathclyde, James Weir Building, 75 Montrose Street, Glasgow, UK
E-mail: annalisa.riccardi@strath.ac.uk
Massimiliano Vasile
Professor, Aerospace Centre of Excellence, Mechanical and Aerospace Engineering University of Strathclyde, James Weir Building, 75 Montrose Street, Glasgow, UK
E-mail: massimiliano.vasile@strath.ac.uk
Summary
This paper presents novel heuristics for the fast conservative approximation of resilience indices in the preliminary design optimisation of engineering systems under uncertainty. Since the uncertain in the early phases of the design process is mainly of an epistemic nature, Dempster–Shafer theory of evidence is proposed as the reasoning framework. The heuristics proposed in this paper are used to partition the uncertainty space in a collection of subsets that is smaller than the full set of focal elements but still provides a good approximation of Belief and Plausibility. Under suitable assumptions, this methodology renders the approximation of the Belief and Plausibility curves cost-effective for large-scale evidence-based models. Its application to the preliminary-design sizing of a small spacecraft solar array under epistemic uncertainty will be demonstrated.
Keywords: Optimisation, Uncertainty Quantification, Evidence Theory, Optimisation Under Uncertainty, Preliminary Design, Systems Engineering.
1 Introduction
Optimisation under Uncertainty has become a fundamental approach to improve design and decision making in systems engineering. Modern techniques in computational intelligence together with current computational power allow designers to model increasingly complex systems and give answers to questions that were out of reach a few years ago regarding the optimal operation of such systems in a variety of scenarios. Such an advancement has led to more exactly quantified design margins and reductions in design budgets without compromising robustness or safety. Nonetheless, the challenge remains as more and more complex problems are tackled better and better
conditions. With this in mind, one can see Robust Optimisation and Reliability-based Optimisation as two aspects of Resilience Optimisation.
Robust optimisation aims at minimising the impact of uncertainty on the prediction of the value of the quantity of interest while optimising its value at the same time. Once uncertainty is propagated through the system the variability of the budgets with respect to the uncertain parameters is quantified and one can aim for a good trade-off between predicted budget value and budget variability (expectation-variance methods), or the best budget value under the worst conditions possible (worst case approach).
On the other hand, Reliability-Based Optimisation aims at maximising the ability of a system to retain its operational capacity under uncertainty while maximising performance. The usual practice is to optimise the system budgets with a hard constraint on the probability of failure. A more comprehensive option is to simultaneously optimise the budgets and one or more risk indicators that relate to the probability and/or severity of failure.
Of course a mixed robustness and reliability approach can be envisaged if uncertainty impacts both the system budgets and the system’s capability to fulfil its requirements.
Most current methodologies to address these issues focus either on the application of margins and safety factors, or on the measurement of statistical moments over a sample of the space of uncertain parameters. Whereas these practices are widespread and can provide relevant information, they cannot incorporate all forms of uncertainty and do not account for imprecision. The uncertainties the designer needs to cope with in the early phases of the design cycle are often associated to a lack of knowledge, sparsity of background data and imprecise modelling of the system requirements, rather than to the occurrence of aleatory events that are due to nature’s inherent randomness. In other words, they lay in the realm of Epistemic Uncertainty.Helton(1997)In such a situation, the
application of system margins is still possible, but will often lead to overly conservative designs, since the process of devising optimal design margins is hitting the same wall of imprecise definitions and sparse background data.
On the other hand, modelling this uncertainty using standard probabilities can be difficult since it requires additional hypotheses on the probability distribution. A more natural way to tackle these engineering problemsOberkampf and Helton(2002) is offered by Imprecise Probability theories, and in particular by Evidence Theory (or Dempster-Shafer TheoryShafer(1976)Dempster(1967)), which operates on deductions from the available evidence instead of assuming complete knowledge of the probability distribution.
2 Evidence-Theoretic Design
In Evidence Theory, both input and model uncertainty are defined by means of basic probability assignments
(bpa) associated to elementary propositions in the space of possible events. BeingΘthe set of all possibilities, abpais a functionm: 2Θ→[0,1]verifying
m(/0) =0,
∑
A⊂Θm(A) =1.
There is a one to one correspondence between any A⊆Θ and the proposition the true value of θ is in A,
whereθ is the quantity of interest whose true value needs
to be determined. In model-based systems engineering, elementary propositions will often take the form of an uncertain quantity being within a set of intervals, i.e.
A={u∈[al,bl]}, 1≤l≤L,
and their associatedbpal =m([al,bl]). Note bpacan be
associated to potentially overlapping or disjoint intervals as well as to their union, the latter representing a degree of ignorance. If several uncertain variables are taken into account, one will consider propositions of the kind
A={u= (u1,u2,· · ·,unu)∈
nu
∏
j=1[alj,j,blj,j] =Hl},
wherel= (l1,l2,· · ·,lnu)is the multivariate index associated to hyperrectangular domainHl. This yields
Θ={Hl,1≤lj≤Lj,1≤j≤nu},|Θ|=
nu
∏
j=1Lj.
Assuming independent uncertainties, thebpaof every such possibility can be computed as the product of thebpaof the elementary propositions regarding eachuj,
m(Hl) =
nu
∏
j=1bpalj,j.
After combination of several, possibly conflicting, evidence sourcesDempster(1967)Zhang(1994)Sentz and Ferson(2002) , a map of probability masses is thus assigned to all elements in 2Θ. The Belief (Bel) on and Plausibility (Pl) of a given propositionA⊆Θare defined as
Bel(A) =
∑
B|B⊆A
m(B),
Pl(A) =
∑
B|B∩A6=/0
m(B),
i.e. Bel(A) collects the probability masses associated to possibilities satisfyingA, whereasPl(A)collects the masses of possibilities not contradictingA. Hence
Pl(A) =1−Bel(A)¯
Figure 1: Interpretation of the relation between Belief, Plausibility and (second-order) uncertainty onP(A).
[image:3.595.58.246.484.637.2]available on the imprecise probabilityP(A). The difference between Pl(A) and Bel(A) constitutes an indicator of the degree of second-order uncertainty associated to the assessment of P(A). This interpretation is illustrated in Figure 1.
From this point of view, Probability Theory can be viewed as the particular case of Evidence Theory in which Belief and Plausibility converge to the same quantity. Hence, an evidence-theoretic model allows one to treat epistemic and aleatory uncertainty in the same framework.
In the applications that concern this work, the formulation presented translates into considering a mapping ofbpaover a family of hyperrectangular subsetsHl of the space of uncertain variables. This family of subsets will from now on, be referred to asU, the uncertainty space, and needs to contain every focal elementΩ, this is every subset ofΘwith non-nullbpa:
U⊇[Ω,Ω⊂Θ,m(Ω)>0.
The bpa structure of U can then be used to calculate the lower (Belief) and upper (Plausibility) bounds on the probability that the value of the quantity of interestF(u)is as expected, e.g. under thresholdνby considering
A={u∈U|F(u)≤ν},
which gives
Bel(F(u)≤ν) =
∑
Ω m(Ω),
Pl(F(u)≤ν) =
∑
Ω m(Ω),
with
Ω={Ω⊂Θ| max u∈Hl⊆Ω
(F(u))≤ν},
Ω={Ω⊂Θ| min u∈Hl⊆Ω
(F(u))≤ν}.
Thus, in Robust Design Optimisation, the robustness of a design against the epistemic uncertainty in the system is usually characterised by the curves Bel(F(u) ≤ ν) and Pl(F(u)≤ν) against ν associated to that design – henceforth referred to simply as Belief and Plausibility curves. In particular if F is to be minimised, then A as defined above is the desirable hypothesis, and the robustness index is often chosen as Bel(F(u)≤ν) since
it can be interpreted as a conservative estimation of the
probability associated to the desirable hypothesis. In Reliability-Based Optimisation, propositionAcan instead represent the satisfaction of an operational constraint; the designer will then be interested in the reliability index Bel(A) and its variation against one or more conflicting system budgets.
The drawback of this comprehensive approach for uncertainty quantification is that it leads to an NP-hard problem with a computational complexity that is exponential with the number of epistemic uncertain variables. This is due to the fact that a global maximisation (resp.minimisation) of the quantity of interest is required over eachΩ⊂Θhaving non-nullbpa.
This work proposes a novel heuristic to produce a progressive approximation of the Belief and Plausibility curves at a reduced computational cost. This approach tries to minimise the estimation error at each iteration and converges faster, under suitable assumptions, to a more precise estimation of the Belief and Plausibility curves than previously proposed partitioning approachesVasile et al(2012)Vasile, Minisci, and Wijnands.
Such heuristics can yield huge cut-off in computational resources, allowing one to tackle the complete risk-budget trade-off Pareto front computation for simplified but high-dimensional system models within an affordable time budget. This application will be demonstrated in the last section of this paper by means of the preliminary design optimisation of the solar array of a small spacecraft.
3 Estimation of the Belief and Plausibility Curves
For an exact reconstruction of the Belief (resp. Plausibility) curve, the determination of the worst event (resp. best-case event) is necessary over every subset of the uncertainty space that has a non-nullbpa. In the general case, this translates into a number of global maximisations (resp. minimisations) of the quantity of interestF(u). This section will focus on the estimation of the Belief curve
Bel(F(u)≤ν) =
∑
Ω m(Ω),
Ω={Ω⊂Θ| max u∈Hl⊆Ω
(F(u))≤ν}
of a design over all possible values of ν. Note the exact computation of the entire curve can be conducted by cumulative sum ofbpaover the sorted maxima
F={ max
u∈Hl⊆Ω
F(u),Ω⊂Θ,m(Ω)>0}.
maximum of the quantity of interest. The heuristic that drives how the tree is built and explored is key to the rapid convergence to the correct Belief and Plausibility values. The overall procedure is schemed in Algorithm 1 and detailed in the following subsections.
3.1 Truncated estimation
The truncated estimation process begins with a global maximisation over the whole uncertainty spaceUas zeroth iteration
S0:=U,F¯0=max
u∈S0 0
F(u).
This allows to assert
Bel(F(u)≤ν) =1 ν≥F¯0,
Bel(F(u)≤ν)≥0 ν<F¯0,
and is equivalent to propagation of the vacuous Belief functionDempster(1967)to quantityFoverU.
Then as-subdivision of the search space is proposed, S11∪S12∪ · · · ∪Ss1=S00,
wheresis a hyperparameter of the process. Since this split happens recursively, at iterationi≥1 one has a set
Si={Ski,1≤k≤si}
of subsets under consideration. Global optimisation is used to obtain the maxima
¯
Fi={F¯ik=max
u∈Sk i
F(u),1≤k≤mi}.
Let us assume for the sake of simplicity that k is redefined here so that such list is sorted ¯Fk
i ≤F¯ik+1.Then it
stands
u∈Hl⊆
k [
κ=1
Sκ
i =⇒F(u)≤F¯ik
but not necessarily its reciprocal, which allows to compute themi-truncated approximation of the Belief curve
f
Bel(F(u)≤ν) =
∑
eΩ m(Ω),
e
Ω={Ω⊆
k [
κ=1
Sκ
i|F¯ik≤ν}
by cumulative sum of bpa over ¯Fi. This sum can
usually be simplified by considering degenerate bpa structuresHelton et al(2006)Helton, Johnson, Oberkampf, and Sallaberry . Such approximation is conservative by construction, i.e.
Bel(F(u)≤ν)≥Bel(Ff (u)≤ν),
and can indeed be interpreted as a second-order Belief under the evidence provided by ¯Fi. If the equality holds
U=[Ω,Ω⊂Θ,m(Ω)>0,
which is usually the case, then
Bel(F(u)≤ν) =Bel(F(f u)≤ν) =1⇐⇒ν≥F¯0.
Furthermore if it holds that
u∈Hl⊆
k [
κ=1
Sκ
i ⇐⇒max
u∈Hl(F(u))≤
¯ Fik
then
Bel(F(u)≤F¯k
i ) =Bel(Ff (u)≤F¯ik).
Assuming exactitude of the global optimisation, it is clear that ¯Fi⊂F¯i+1,it will nonetheless be assumed that it
is necessary to repeat these optimisations; this assumption will help contain the computational cost and is coherent with the conservative-approximation objective of this work. Thus, the cost of the overall process running for 0≤i<imax
is at mostsimaxs−1−1global maximisations. 3.2 Heuristics for minimisation of the error
The algorithm proposed in this paper stores in an archive ASthe pairs(u,F(u))evaluated by the optimisation process
every time it is run over a subdomainSto compute max
u∈S⊆UF(u).
The archive can include information of previous iterations too. In the case that a deterministic optimisation algorithm is employed, a pre-sample ofUcan be used to increase the information available during the first iterations.
After the optimisation, AS is used to decide on a
s-subdivision the current space. A functionσ is defined
σ:AS−→ {S1,S2,· · ·,Ss},S1∪S2∪ · · · ∪Ss=S.
An appropriate choice ofσ will lead to the construction of a tree such that it can be truncated at the desired depth with minimum approximation error of the Belief curve.
The heuristics proposed hereby will consider dividing S along one direction of uncertainty uj at a time.
Furthermore, it will be considered that Sk=[(Hl|Hl⊂S∧lj=k),
which is equivalent to subdivide S along all intervals [al,bl]|bpal,j >0 for one of the non-singleton variables
uj|Lj>1 . The statements in 3.1 stand by considering
s≥max
j (Lj).
This will from now on be referred to as breadth-first exploration of the truncated estimation tree.
Under such premises, defining σ reduces to selecting the direction uj along which next split will take
highest variability of the system budget with respect to the worst case in S. The idea of systematic partition along the uj by sensitivity analysis on F is introduced
inHelton et al(2006)Helton, Johnson, Oberkampf, and Sallaberry. Here we
consider, for each non-singletonujofS, the list of maxima
e
F={Fek= max
(u,F(u))∈AS u∈Sk
F(u),1≤k≤Lj},
which constitutes a prediction of the next-iteration maxima in S if that direction is selected for subdivision. Let us assume once again that kis redefined so that such list is sortedFek≤Fek+1. The direction selected will then be
uj|j=arg max j
∑Lj
−1
k=1 (FeLj−Fek)2 Lj−1
,
which, by analogy with a variance measure, gives the variance-baseddesignation.
This heuristics is designed as to favour a desirable estimated Belief curve overS, i.e. one that grows slowly in the high robustness values. If the maxima in Fe constitute a good approximation of the actual maxima over the Sk, which will be the case if the global optimiser
exploredSeffectively, this will compensate the conservative approximation of the truncated estimation. Otherwise, the possible effects of under-exploration of some regions during the previous global maximisations will be mitigated for subsequent iterations.
It is nonetheless noteworthy that the selection does not account for the bpa distribution among the Sk. If
subdivisions can be selected that are very heterogeneous in bpa, then other σ options are preferable for a fast
convergence ofBel(Ff ≤ν)to Bel(F ≤ν). The authors propose for instance maximising the area under the next-iteration prediction of the overall curve.
Note also that the purpose is here to obtain a precise approximation of the overall Belief curve at a given cost. The designer might be interested in a higher detail for the pessimistic cases, for example, or be only interested in Bel(F ≤ν) for a given ν; then one should explore the tree otherwise than breadth-first. Combining the ideas exposed inVasile et al(2012)Vasile, Minisci, and Wijnandswith a
σ(AS)subdivision function to accelerate convergence will
be the focus of future research.
4 Preliminary reliability-based design of the solar array of a small spacecraft
4.1 The problem
This section presents the application of the algorithm presented in Section 3 to the reliability-based sizing of the solar array of a small spacecraft power system, to be optimised in terms of construction cost and total power-generating surface. Three different formulations of increasing complexity will be proposed in the following sections, where each one is a particular case of the next.
Algorithm 1Variance-based breadth-first reconstruction of the truncated Belief curve
1: InitialiseS=U, S0={S}andi=0 2: whilei<imax do
3: F¯← {Ø}, Si+1← {Ø} 4: for allS∈Sido
5: F¯←F¯∪ {max
u∈SF(u)}
6: AS←global optimization history sample 7: Si+1←Si+1∪σ(AS)
8: end for
9: ReconstructBelf curve from sorted( ¯F) andbpa
10: Apply termination condition if any
11: i←i+1
12: end while
13: returnLastBelf curve
In all of them, a design will consist on a certain choice of the quantities:
• A∈[Amin,Amax], the power-generating surface of the
solar panel, [m2].
• µ∈[0,1], defines the proportion of cells of type I used
in the solar panel. Each type, I and II, has its:
– Best and worst-case solar efficiencies and failure profile, modeled as expert-provided probability assignments to efficiency intervals.
– Cost per square meter of power-generating surface.
Hence the construction cost of a designC(µ,A)can be
computed independently of the uncertainties. The sources of risk are, besides the solar cell efficiencies:
• Uncertainty on the power consumption of each of the subsystems, mostly due to lack of definition of the exact mission requirements, modeled as expert-provided probability assignments to power requirement intervals.
• Uncertainty on the power generation, mostly due to sparse background data on components recently adopted by the satellite provider, modeled as expert-provided probability assignments to power efficiency intervals.
The model considers 11 power consumptions of low design margin defined over an only interval, 14 power consumptions of high design margin defined over two intervals with distinct probability assignments, and 6 efficiency power ratios also defined over two intervals. Hence dim(U) =31 and there are δ =20 non-singleton
directionsuj. The uncertainty space is composed of 220
Note that it is the epistemic uncertainty that is predominant in all cases at this stage of the design. Hence all uncertainties have been modeled as epistemic and will be propagated through the system model by means of Evidence Theory. The reliability index selected is:
Bel(Pgen≥Preq)
Where Pgen is the power generated by the solar array
andPreq is the power level required by the system, both
uncertain. Thus,Bel(Pgen≥Preq)is the most conservative
probability estimation associated to the event ofsatisfying the power requirements of the systemthat can be inferred from the available evidence, and one will be interested in its maximisation or equivalently in the minimisation of the risk index
Pl(Pgen<Preq).
4.2 Risk assessment of the worst-case solution
With this formulation the worst-case-scenario optimum dwcs∗ is sought for the construction costC(µ,A)by solving the problem:
min
d∈DC(µ,A)
s.t.:Pgen≥Preq ∀u∈U
This is equivalent to requesting from the system a reliability index of 100% or risk index of 0% an can be solved analytically in this case by fixing A|Pgen ≥
Preq ∀u∈Uand minimising overµ.
For this design solution, the proportion of solar cells of each tipeµwcs∗ is fixed and a risk analysis is then conducted varying the power-generating surface A. The reliability index
Bel(Pgen≥Preq) =1−Pl(Pgen<Preq)
is presented against C(µwcs∗ ,A). This curve is estimated within 11 subsequent iterations of the variance-based algorithm proposed hereby. Since the maximisations are analytical over any subset of focal elements considered, a global optimisation log is not available and is hence mimicked with an initial latin hypersquare sample of cardinality 64. The curves thus obtained are compared to the exact curve computed in an exhaustive fashion requiring maximisation over all the focal elements of uncertainty – 220analytical maximisations in this case.
By construction this curve acts as a lower bound for the maximum reliability index of any design d∗ that lays in the risk-budget Pareto set. In other words, it constitutes a lower bound to the overall reliability-budget trade-off curve whose computation is presented in 4.3. Besides, its rightmost point corresponds to the worst case of the worst-case optimum and is thus assured to belong to the risk-budget trade-off Pareto front.
4.3 Bi-objective formulation
With this formulation the computation of the whole risk-budget trade-off Pareto front is tackled for the construction cost of the solar arrayC(µ,A). This can be
expressed as:
min
d∈D
C(µ,A)
Pl(Pgen<Preq)
This is analogous to solving the family of evidence-based reliability-constrained optimisation problems
minC(µ,A)
s.t.:Pl(Pgen<Preq)≤ε ε∈[0,1]
The problem above is solved by means of a single run of the multi-objective optimisation algorithm Multi-Agent Collaborative Search (MACSZuiani and Vasile(2013)), using 7 iterations of the variance-based algorithm proposed hereby for the approximation of the risk index at each function evaluation. No additional heuristics are added. Note that this formulation is as of today practically intractable without an approximation method for the risk index even for a problem that allows analytical maximisation over the focal elements, since it would require global optimisation over the design space on top of the exhaustive computation of the index over all the focal elements of uncertainty. 4.4 Three-objective formulation
With this formulation the computation of the whole risk-budget trade-off Pareto front is tackled for the construction cost of the solar array and its power-generating surface simultaneously. This can be expressed as
min
d∈D
C(µ,A)
A
Pl(Pgen<Preq)
and is analogous to solving the family of bi-objective evidence-based reliability-constrained optimisation problems
min
d∈D
C(µ,A)
A
s.t.:Pl(Pgen<Preq)≤ε ε∈[0,1]
5 Results
[image:7.595.308.531.222.390.2]5.1 Risk assessment of the worst-case solution
Figure 2 shows the increasing quality of the estimations obtained in 11 successive iterations of the variance-based approximation algorithm. The convergence to the exact curve on the conservative side is assured by construction of the algorithm, but it is still noteworthy that in this case the convergence rate is large enough as to obtain more precision than is necessary for the purposes that occupy the designer, while achieving a reduction of four orders of magnitude in the computational cost (wrt. its exact computation). The heuristics used constitute a model reduction technique in the sense that they compile information represented along some directions of uncertainty, deemed less relevant. Hence these results are not generic, but the convergence speed will be directly related to the reducibility properties of the index to estimate with respect to the problem uncertain variables in a given probability segment. In other words, the maximum estimation error will be obtained when the effect of every uncertain variable is homogeneous and there is no partitioning more significant than another amongst the considered. The problem defined hereby is found to be dominated by the effect of the uncertainty defined on the 6 power efficiencies, of which only the 3 of them corresponding to cells of type II are relevant hereby. Thus 7 iterations of the algorithm are henceforth deemed sufficient to capture most variability.
Figure 2: Progressive approximation of the exact reliability-budget curve of a design solution composed entirely of cells of type II (µ =0). Highlighted, the approximation corresponding to 7 iterations yielding 127 maximisations, i.e. 0.0121% of the computational cost of obtaining the exact curve.
5.2 Bi-objective formulation
Figure 3 illustrates the Reliability Pareto Front obtained for the problem in its bi-objective formulation. As discussed in section 4.2, the curve in figure 2 constitutes a lower bound for the complete reliability-budget trade-off curve
and its rightmost point is coincident. In this particular case, since cells of type II have lower construction cost per kW of power generated both in the best and worst case, the leftmost point is also coincident. In this situation one could expect the front to be completely coincident, nevertheless the results show that solving the evidence-based reliability-constraint optimisation problem with a requirement in the reliability index between 0.5 and 0.75 would lead to optimal solutions composed by around 50% of cells of each type.
Figure 3: Reliability Pareto front obtained for the design problem in its bi-objective formulation superposed to the exact Belief curve of the worst-case optimum (black line). Colours relate to the proportion of cells of type I and II.
Figure 4 proves that the reliability-budget curve varying A of a solution with µ =0.5 (dashed line) has both a
best case and worst case suboptimal to those of a solution with µ = 0 (solid line), but the former presents two plateaus instead of one and offers thus a higher lower bound on the cdf of the system at a lower construction cost in this reliability range. In this case the designers are more interested in the upper range of reliability and might focus their interest in the budget difference between worst-case cost, nonetheless the availability of this information provides a powerful decision-making tool in a generic scenario.
It can be noted that the quality of the approximation is worse for the design with mixed types of cells using the same estimation set-up. This is due to the fact that each of the maxima used to reconstruct the curve captures, in 7 iterations, the information as divided along 6 of theδ =20 non-singleton directions of epistemic uncertainty defined. For a design with µ=0.5, the indices will be more or
[image:7.595.63.284.431.590.2]to the uncertainties in the power consumptions, resulting in lower detail. Despite this fact, it has been shown that the quality of the approximation is enough for the bi-objective approach to spot the different behaviour of the solutions and attract attention towards a potentially interesting mixed-type solution.
Figure 4: Reliability-budget curves of design solutions with
µ =0 and µ =0.5. Both the exact curves and those obtained with 7 iterations of the variance-based estimation algorithm are shown.
5.3 Three-objective formulation
Figure 5 shows the family of optimal-budget Pareto fronts obtained in the three-objective formulation for every possible level of reliability requested from the design solution. Of course the fronts with a higher reliability associated are dominated by those that allow a higher risk index. The uppermost front corresponds to the worst-case Pareto optimal solutions. This front can be obtained at a reduced cost using multi-objective worst-case optimisation heuristics such as the ones integrated in MACSminmaxOrtega and Vasile(2017) . Note that, whereas low and high-reliability solutions constitute almost-linear fronts in the budget space, requesting reliability values between 25 and 75% will lead to more exotically shaped Pareto fronts. In particular, the front becomes non-convex under 50% reliability index, indicating an abrupt change in the properties of the problem landscape. Figure 6 presents the exact same information in a three-dimensional fashion, plus colours relate to the proportion of cells of type I and II used. It can be observed that, as predicted, there is one type of cell that will generally lead to reduction of the cost whereas the other will lead to reduction of the solar array power-generating surface.
6 Conclusions
A methodology has been presented for the fast and conservative estimation of the Belief and Plausibility curves associated to a system budget of quantity of
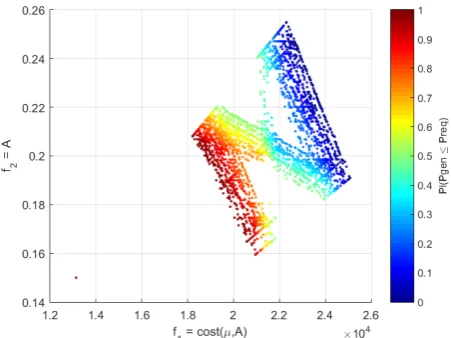
[image:8.595.69.278.172.342.2]Figure 5: Reliability-budget Pareto Front obtained for the design problem in its three-objective formulation projected to the budget axis, colours relate to the reliability index.
Figure 6: Risk-budgets Pareto front obtained for the design problem in its three-objective formulation, colours relate to the proportion of cells of type I and II.
interest. This finds application in Evidence-Theoretic Uncertainty Quantification. The proposed algorithm relies on breadth-first partitioning of the uncertain space and model reduction after analysis of data coming from a global optimisation history. Heuristics to relate the partitioning scheme to the optimisation archive have been proposed and discussed.
[image:8.595.309.532.336.498.2]system indices, even if simplified models are in use. The results show that the proposed methodology can, under suitable model reduction assumptions, provide a large cut-off in computational cost with respect to the exact computation of the Belief and Plausibility curves, while maintaining a minimal approximation error.
It is nonetheless noteworthy that to tackle some of the formulations presented, namely those that involve multi-objective optimisation, only a value of the curve is of interest to drive the search. A preliminary discussion on heuristics to further reduce the cost in such applications has been lead. A broader view on efficient robustness and reliability optimisation algorithms will constitute the focus of future research.
7 Acknowledgement
This work is partially supported by ESTECO Spa. and Surrey Satellite Technologies Ltd. through the project Robust Design Optimisation of Space Systems(European Space Agency - Innovation Triangle Initiative).
References
[Dempster(1967)] Dempster AP (1967) Upper and lower probabilities induced by a multivalued mapping. The Annals of Statistics 28:325–339
[Helton(1997)] Helton JC (1997) Uncertainty and sensitivity analysis in the presence of stochastic and subjective uncertainty. Journal of Statistical Computation and Simulation 57:3–76
[Helton et al(2006)Helton, Johnson, Oberkampf, and Sallaberry] Helton JC, Johnson J, Oberkampf WL, Sallaberry C (2006) Sensitivity analysis in conjunction with evidence theory representations of epistemic uncertainty. Reliability Engineering and System Safety 91 (10-11):1414–1434
[Oberkampf and Helton(2002)] Oberkampf W, Helton JC (2002) Investigation of evidence theory for engineering applications
[Ortega and Vasile(2017)] Ortega C, Vasile M (2017) New heuristics for multi-objective worst-case optimization in evidence-based robust design. In: 2017 IEEE Congress on Evolutionary Computation (CEC2017) [Sentz and Ferson(2002)] Sentz K, Ferson S (2002)
Combination of evidence in dempster-shafer theory. In: 6th World Multi-conference on Systemics. Cybernetics and Informatics
[Shafer(1976)] Shafer G (1976) A Mathematical Theory of Evidence. Princeton University Press
[Vasile et al(2012)Vasile, Minisci, and Wijnands]
Vasile M, Minisci E, Wijnands Q (2012) Approximated computation of belief functions for robust design optimization. In: 53rd
AIAA/ASME/ASCE/AHS/ASC Structures, Structural Dynamics and Materials Conference [Zhang(1994)] Zhang L (1994) Representation,
independence, and combination of evidence in the dempster-shafer theory