COMMUNICATION
Concomitant Solid Separation through Electric Field Enhanced
Crystallization
Wei W. Li,
[b]Norbert Radacsi,
[b]Herman J.M. Kramer,
[b]Antoine E. D. M. van der Heijden
[b]and Joop H.
ter Horst*
[a]Abstract: When applied to a pure component suspension in an apolar solvent, a strong inhomogeneous electric field induces particle movement and the particles are collected at the surface of one of the two electrodes. This new phenomenon was used to separately isolate two organic crystalline compounds, phenazine and caffeine, from their suspension of 1,4-dioxane. First, the crystals of both compounds were collected at different electrodes under the influence of the electric field. Subsequent cooling crystallization allowed the immobilization and growth of the particles on the electrodes, which were separately collected after the experiment with purities higher than 91%. This method can be further developed into a technique for crystal separation and recovery in complex multicomponent suspensions of industrial processes.
Crystallization is an effective and efficient separation technology that can, in a single process step, recover the desired compounds from solutions as high purity (>99%) crystalline solids [1,2,3,4]. However, such highly purified product is hard to
obtain from a multi-component solution by direct crystallization, such as the product stream from a type-I Multicomponent Reaction (MCR),[5,6] or a racemic mixture of chiral
pharmaceutical compounds,[7] since a mixed suspension is a
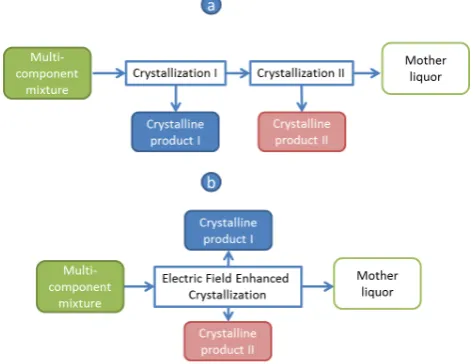
likely result. Further purification of the solid phase usually requires additional steps (see Figure 1 (a) for instance), which will inevitably lead to the loss of valuable products. Alternatively, a single crystallization step coupled with simultaneous particle separation could diminish the product loss while effectively recovering desired solute from the mixed solution.
Particle manipulation and subsequent separation can be achieved by the application of electromagnetic fields: a magnetic field could separate polymorphs, crystalline solids with different solid-state structures, to prepare seeds for large-scale crystallization, provided that a suitable paramagnetic medium can be found.[8] Alternatively, an electric field has been used in
the successful capturing or manipulation of desired nanoparticles[9] and the assembly of colloid particles for the
production of, for instance, optically tunable micropatterns, biosensors, and biofuel cells.[10-12] In all of these cases, the liquid
phases did not contain any dissolved particle materials. On the other hand, the electric field has been used to localize protein crystallization and control its nucleation rate from a clear solution, in absence of any seed crystals.[13,14] However, up till now, the
combination of particle manipulation by an electric field with the crystallization process for the in-situ product separation and recovery has, to our knowledge, never been attempted. In the present study, the experimental proof is given for an electric field enhanced crystallization (EEC) process by which the two solutes from a multi-component solution are separately recovered, as schematically demonstrated in Figure 1 (b).
Figure 1. Schematic demonstrations of solutes separation from a multi-component solution by direct crystallization (a) and Electric Field Enhanced Crystallization (b).
Subjected to an inhomogeneous electric field, particles in a suspension experience dielectrophoretic (DEP) and possibly electrophoretic (EP) forces: DEP originates from the difference in dielectric constants of the particles and the surrounding medium and drags the particles with larger dielectric constant towards the location of the electric field maxima,[15,16] while EP
forces, which work only on charged particles, are directed towards the electrode with the counter charge.[17] To prevent
electrochemical reactions, which would reduce the product yield, the current through a crystallizing suspension should be minimized. Meanwhile, the inhomogeneous field needs to be sufficiently strong and the dielectric constant of the solvent should be sufficiently small to ensure the effective manipulation of crystals by the DEP force. Therefore, the apolar and non-conductive solvent 1,4-dioxane was used in this study.
We first applied an inhomogeneous electrostatic field to a 6 mL isonicotinamide (INA) suspension in 1,4-dioxane (ca. 18 mg solid/ml solvent), generated by a Direct Current (DC) potential difference between two parallel rod-shape electrodes roughly 6 mm apart, which were immersed into the suspension. In the [a] Prof. dr. J. H. ter Horst,
EPSRC Centre for Innovative Manufacturing in Continuous Manufacturing and Crystallisation (CMAC)
Strathclyde Institute of Pharmacy and Biomedical Sciences (SIPBS) Technology and Innovation Centre
University of Strathclyde
99 George Street, Glasgow G1 1RD, U.K. E-mail: [email protected]
[b] Prof. Dr. ir. van der Heijden, Dr. ir. H. J. M. Kramer, ir. W.W. Li Pdeng, Dr. Radacsi,
Department of Process and Energy Delft University of Technology
Leeghwaterstraat 39, 2628 CB, Delft, the Netherlands
[image:1.595.307.544.308.490.2]COMMUNICATION
presence of a DC potential difference above approximately 2 kV,
INA crystals started to move around the electrodes. More crystals participated in this circular movement with increasing potential difference. In addition, INA crystals gradually accumulated on the anode (Fig. 2). Above around 5 kV DC potential difference the amount of crystals collected at the anode was so large that a crystal bridge formed between the electrodes. Upon switching off the electric field, the collected crystals detached from the anode and settled back to the bottom. When a similar potential difference was applied to an INA solution in absence of crystals, the solution-air interface was only slightly vibrating. No movement of liquid could be observed in pure dioxane. This indicates that the motion of INA particles is, for a large part, related to the interaction of the crystals with the electric field. During the course of the experiments, no current larger than the detection limit of 0.01 mA was observed. No gas formation could be observed on either of the electrodes indicating that the solute does not undergo significant electrochemical reactions.
Figure 2. An inhomogeneous static electric field induced fluid and particle dynamics above a DC potential difference of 2 kV in a suspension of INA in dioxane. The INA crystals were collected at the anode and above around 5 kV DC potential difference a crystal bridge was formed between the electrodes. Although a magnetic stirrer bar was present in the vial, it was not used to stir the solution.
Equivalent experiments were conducted using the suspension of other organic compounds in 1,4-dioxane. Table 1 reveals an interesting result: particle motion was induced in all cases and crystals accumulated on either the anode or the cathode. When the polarity of the two electrodes was reversed by changing the potential difference from +7.5 kV to -7.5 kV, crystals that had accumulated on one electrode migrated to the other one, e.g. INA crystals moved from the old anode to the new one, instead of being attracted by both electrodes, which were symmetrically the two locations of field maxima.
Table 1. The electrodes at which the crystals accumulated for the experiments in which inhomogeneous electric fields of +7.5 and –7.5kV were applied to the suspension of the organic compounds isonicotinamide (INA), niflumic acid (NIF), caffeine (CAF), phenazine (PHE) and 4-hydroxybenzoic acid (HBA) in the solvent 1,4-dioxane. When changing polarity the crystals accumulated on the electrochemically same electrode, i.e. when changing the polarity, INA crystals moved to the new anode.
Electrode Crystalline compound
Anode INA NIF CAF
Cathode PHE HBA
This selective accumulation of crystals on only one electrode indicates the involvement of both DEP and EP forces: the
non-uniform electrostatic field exerts a positive DEP on the crystals in the suspension which triggers their motion towards the two electrodes. Even in apolar solvents, particle surfaces can be slightly charged [18-20] but the EP forces on the crystals becomes
significant only in the vicinity of the electrodes. Crystals approaching the anode are further attracted until they settle on its surface while crystals close to the cathode are repelled. The repelled crystals continue to circulate until they eventually are captured by the anode. Subsequently the entire crystalline mass accumulates on the surface of the anode. Since particulate materials differ in their electronic properties such as dielectric constant and surface charge, the combined effect of DEP and EP forces can lead to the accumulation of corresponding crystals on different electrodes, which enables the development of particle separation methods.[21-24]
However, in order to be collected from the solution, the accumulated crystals need to be immobilized on the electrode. This immobilization of crystals was realized by slowly cooling the suspension in the presence of the electric field. Upon cooling the solubility decreased and the accumulated particles could further grow on and attach to the electrode surface. Two separate experiments (see Figure 5 as Experiment 1A and 1B) were performed on the pure component suspensions of model compounds PHE and CAF.
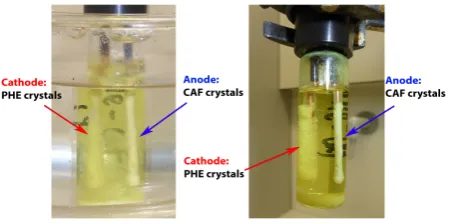
In experiment 1A a suspension of PHE (ca. 26 mg solid/ml solvent) was prepared at 30°C. (see details in ESI) A DC potential difference of -7.5 kV was then applied between the two electrodes and the PHE crystals accumulated at the cathode surface within 1 minute. In the presence of the electric field the suspension was slowly cooled down in an oil bath to 15°C in 3 hours and then kept at this temperature overnight to allow crystal growth to occur. After approximately 15 hours at 15°C, the electric field was turned off showing that most of the PHE crystals were attached to the cathode surface as is shown in Figure 3 (left) and could be directly removed from the solution by withdrawing the electrode. The same procedure was applied to a caffeine (CAF) suspension in experiment 1B and the corresponding crystals were collected from the anode (figure is not shown here).
Figure 3. Left: PHE crystals accumulated and then attached on the cathode in a PHE suspension in dioxane after cooling in the presence of an electric field (Experiment 1A); Right: Suspended CAF crystals in a solution containing both CAF and PHE accumulated and then attached on the anode during seeded cooling crystallization controlled by an electric field (Experiment 2A).
Additionally, the existence of another solute in the solution phase (see Figure 5 and ESI, Experiment 2A and 2B) did not influence the behavior of suspensions in the electric field. Similar to experiment 1B, CAF crystals in experiment 2A were collected from the anode, after cooling crystallization to 15°C under the
[image:2.595.49.287.305.378.2] [image:2.595.329.534.533.641.2] [image:2.595.42.290.669.725.2]COMMUNICATION
electric field, from a solution mixture with additional PHE present
below its saturation concentration (see Figure 3 (right)). The XRPD analysis of the crystalline product showed the presence of CAF crystals only (see ESI). These experiments verify that the electric-field-induced particle capturing combined with cooling crystallization can be used as an in-situ recovery technique for a target system where only one compound is present in the solid phase.
[image:3.595.325.531.302.427.2]Up until this stage, the EEC managed to collect crystals of PHE and CAF from their suspensions, with or without the presence of another solute in the liquid phase. The final step is to verify that the separation of PHE and CAF crystals during crystallization from their mixture can also be achieved by EEC. A 6 mL dioxane suspension containing both CAF (ca. 13 mg solid/ml solvent) and PHE (ca. 29 mg solid/ml solvent) crystals was prepared at 30°C (Experiment 3 in Figure 5, see details in ESI). In the presence of a -7.5 kV DC potential difference crystals accumulated on the surfaces of both electrodes at 30°C (see Figure 4, left). The suspension was then linearly cooled down to 15°C in 3 hours and kept at this temperature overnight, during which time the electric field was constantly applied. Crystal layers of different shape and color were formed on both electrodes reflecting the appearance of PHE (cathode) and CAF (anode) crystalline phases (Figure 4, right).
Figure 4. Crystals accumulated on both electrodes (left) upon applying an inhomogeneous electric field to a mixed suspension of CAF and PHE in dioxane at 30°C; After cooling in the presence of the electric field crystal layers of different colour, shape and thickness were collected from the two electrodes at 15°C. Some crystals still remained in the bottom of the vial (right).
The crystals from the two electrodes were removed from the bulk solution and separately weighed for yield estimation and then analyzed using XRPD and H1-NMR for compositions. From
the anode, 27 mg of crystalline material was recovered which consisted of 91.4 ± 2.2 wt% of CAF. From the cathode, 177 mg of crystalline material was recovered which consisted of 99.6 ±
2.4 wt% PHE (see ESI). The yields of recovery of CAF and PHE were 20.9% and 53.5%, respectively (see summary in Figure 6). The same experiment was duplicated and lower yields but similar solid phase purities to those reported above were obtained. This result verified that the combination of the selective particle collection, induced by an inhomogeneous electric field, and cooling crystallization can indeed simultaneously separate two compounds from their mixture. In the present study, a novel separation technique, coupling particle manipulation by an inhomogeneous electrostatic field and cooling crystallization, here referred to as Electric Field Enhanced Crystallization (EEC), was developed. Experimental verification has been presented here that EEC can be employed to separate two solutes in crystalline form from their
[image:3.595.45.271.355.467.2]multi-component mixture. Although EEC is a promising technique, it still requires further development and optimization. An improved design of the cell will be able to improve the relative low yield of the collected particles caused by the setting of part of the crystals at the bottom of the vial despite the presence of the electric field (see Figure 4, right), or the loss of part of the crystalline material at the cathode that was scrubbed off into the solution due to the narrow vial mouth. The optimization of the electric field geometry and electrode design, based on deepened understanding of the combined effect of DEP and EP in an EEC process, are also bound to improve the yield. Impurities present in the crystalline phases may have been the result of adhering mother liquor between crystals during sampling, which subsequently crystallized out upon removing the solvent by drying the crystalline product. The interesting results lead to research questions concerning the effect of the electric field on crystallization kinetics, the variety of applicable solvents and crystallizing compounds, and electrochemical process engineering design and scale-up.
[image:3.595.320.528.505.633.2]Figure 5. Concentrations and solubility at 15°C and 30°C of PHE and CAF in all experiments.
Figure 6. Yield and purity of PHE (cathode) and CAF (anode) in Experiment 3.
Experimental Section
Phenazine (98%, Sigma), Caffeine (99%, Sigma), Isonicotinamide (99%, Sigma), Niflumic acid (99%, Sigma) and 4-Hydroxybenzoic acid (99%, Sigma) were used as received. The insulator solvent was chosen to be anhydrous 1,4-dioxane (99.8%, Sigma). All chemicals were used without further purification.
COMMUNICATION
𝑦=!∗(!!
!!!∗) (1)
Here m (mg) is the mass of crystals A (either CAF or PHE) collected from either of the electrodes; ct (mg/ml solvent) is the overall concentration of A in the mixed suspension; c* (mg/ml solvent) is the solubility of A in the mixture solution at the temperature the crystals were collected; V (ml) is the volume of solvent.
Acknowledgements
The authors thank Dr. Stephen Eustace and ir. Debby den Besten from Delft University of Technology for the help in H1
-NMR measurement. The authors thank Ben Schelen from Delft University of Technology for the help in developing the electric field setup. J.t.H. thanks the EPSRC Centre for Innovative Manufacturing in Continuous Manufacturing and Crystallization (http://www.cmac.ac.uk) for supporting this work (EPSRC funding under grant reference: EP/I033459/1).
Keywords: Crystal Engineering • Dielectrophoresis • Electrophoresis • Multi-component mixtures • Separation Technology
[1] J. Garside, Chem. Eng. Sci. 1985, 40, 3.
[2] J. W. Mullin, Crystallization, 4 ed., Butterworth-Heinemann, Oxford, 1997.
[3] Myerson, A.S., 2002. Handbook of Industrial Crystallization, 2nd edn. Butterworth-Heinemann, Woburn, MA
[4] J.H. ter Horst, C. Schmidt, J. Ulrich, Fundamentals of Industrial Crystallization, In: Nishinaga T, Rudolph P, Handbook of Crystal Growth, Vol. II., Elsevier, 2015, pp. 1317–49.
[5] A. Domling, I. Ugi, Angew. Chem. Int. Ed. 2000, 39, 3168-3210;
Angew. Chem.2000, 112, 3300-3344.
[6] S. Shaaban, B.F. Abdel-Wahab, Mol Divers, 2016, 20, 233. [7] H. Lorenz, A. Seidel-Morgenstern, Angew. Chem. Int. Ed. 2014, 53,
1218-1250; Angew. Chem.2014, 126, 1240-1274.
[8] M. B. J. Atkinson, D. K. Bwambok, J. Chen, P. D. Chopade, M. M. Thuo, C. R. Mace, K. A. Mirica, A. A. Kumar, A. S. Myerson, G. M. Whitesides, Angew. Chem. Int. Ed. 2013, 52, 10208-10211;
Angew. Chem.2013, 125, 10398-10401.
[9] P. R. C. Gascoyne, J. Vykoukal, ELECTROPHORESIS 2002, 23, 1973.
[10] M. Ammam, J. Fransaer, Biosens. Bioelectron., 2009, 25, 191. [11] M. Ammam, J. Fransaer, Electrochim. Acta,2010, 55, 3206. [12] R.C. Hayward, D.A. Saville, I.A. Aksay, Nature, 2000, 404, 56. [13] Z. Hammadi, S. Veesler, Prog. Biochem. Biophys., 2009, 101, 38. [14] H. Koizumi, K. Fujiwara, S. Uda, Cryst. Growth Des.2009, 9, 2420. [15] H. A. Pohl, Dieletrophoresis: The Behavior of Neutral Matter in Nonuniform Electric Fields, Cambridge University Press, Cambridge, 1978.
[16] S. Dash, S. Mohanty, S. Pradhan, B.K. Mishra, J. Taiwan Inst. Chem. E.2016,58, 39.
[17] T.Palillat, G. Touchard, J Electrostat., 2009, 67, 326. [18] R.C. Hayward, D.A. Saville, I.A. Aksay, Nature, 2000, 404, 56. [19] T. Vissers, A. Imhof, F. Carrique, A.V. Delgado, A. van Blaaderen,
J. Colloid Interface Sci., 2011, 361, 443.
[20] P.S. Vincett, J. Colloid Interface Sci.,1980, 76 (1), 83. [21] P.S. Vincett, J. Colloid Interface Sci., 1980, 76 (1), 95.
[22] PH.C. van der Hoeven, J. Lyklema, Adv. Colloid Interface Sci., 1992, 42, 205.
[23] I.D. Morrison, Colloids Surf., A,1993, 71, 1.
COMMUNICATION
Table of Contents
COMMUNICATION
Crystallization from a multi-component mixture requires additional steps for product purification. The application of an inhomogeneous electric field on a mixed suspension enables the simultaneous particle separation and crystal growth, by which the crystals of the two solutes are separately collected from the two electrodes, thus achieving single-step product recovery and purification from a
multi-component system.
Wei W. Li, Norbert Radacsi, Herman
J.M. Kramer, Antoine E. D. M. van der Heijden, Joop H. ter Horst*
Page No. – Page No.
Supporting Information
Table of Contents
1. Electric field setup
(2)
2. Details of Electric-field Enhanced Crystallization Experiments
(2)
3. Verification that CAF and PHE do not co-crystallize
(3)
4. X-ray Powder Diffraction (XRPD) for crystalline phase composition identification
(3)
Electric Field Setup
[image:7.612.185.432.150.267.2]All experiments reported were conducted in the same setup consisting of two parallel rod-shaped copper electrodes, 6 mm apart from each other, in an 8 mL cylindrical glass vial (Figure SI). An electrostatic field can be generated by a DC potential difference, created by a HCN 140m-12500 high voltage power supply (F.U.G. Elektronik GmbH, Germany), between the two electrodes. At a potential difference of 7.5 kV the inhomogeneous field strength at a straight line between the electrodes, which is the peak value, would be 1.25 ✕ 106 V m-1.
Figure SI.Left: The inhomogeneous field setup with the two rod-shaped copper electrodes connected to the high voltage DC power supply via a special PVC cap. The sample suspension is placed in the glass vial and the copper electrodes are emerged in the suspension and connected to the power supply to generate an inhomogeneous electrostatic field; Right: A simple schematic of the inhomogeneous electric field lines (dash lines) viewed from the top of the setup (right).
Details of Electric-field Enhanced Crystallization Experiments
Experiment 1A: In experiment 1A a suspension of PHE was prepared (with the overall composition of 93 mg/ml solvent) at 30°C. Taken into account the solubility of PHE in dioxane at 30°C (67 mg/ml solvent), in total 26 mg/ml solvent PHE crystals were present in the suspension at this temperature.
Experiment 1B: In experiment 1B a suspension of CAF was prepared (with the overall composition of 29 mg/ml solvent) at 30°C. Taken into account the solubility of CAF in dioxane at 30°C (21 mg/ml solvent), in total 8 mg/ml solvent CAF crystals were present in the suspension at this temperature.
Experiment 2A: In experiment 2A a suspension of PHE and CAF was prepared (with the overall composition of PHE 33 mg/ml solvent and CAF 29 mg/ml solvent) at 30°C. In total approximately 8 mg/ml solvent CAF crystals and no PHE crystals were present in the suspension at this temperature.
Experiment 2B: In experiment 2B a suspension of PHE and CAF was prepared (with the overall composition of PHE 93 mg/ml solvent and CAF 10 mg/ml solvent) at 30°C. In total approximately 26 mg/ml solvent PHE crystals and no CAF crystals were present in the suspension at this temperature.
Experiment 3: A 6 mL dioxane suspension containing both CAF and PHE crystals was prepared at 30°C, which had an overall composition of CAF of 34 mg/ml solvent and PHE of 96 mg/ml solvent. If we assume the PHE and CAF solubilities were not influenced by their mutual presence in the solution, there were in total 13 mg/ml of CAF and 29 mg/ml of PHE crystals present in the suspension in the beginning of the experiment.
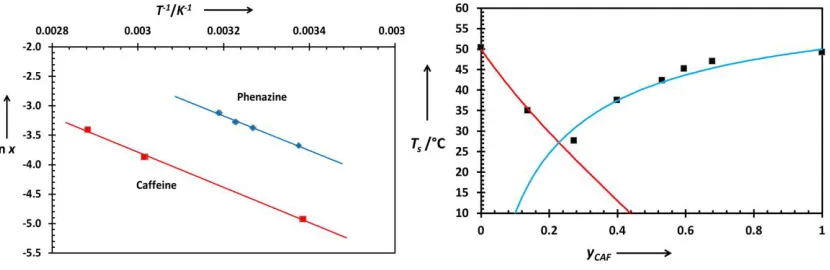
The verification that Phenazine (PHE) and Caffeine (CAF) do not co-crystallize was done via the construction of a pseudo-binary phase diagram using the method from ter Horst, et al.[1] The solubility of PHE and CAF in 1,4-dioxane was measured
in a Crystal16 (Technobis B.V.). Dioxane suspensions of either model compound were prepared and subjected to well-controlled heating and cooling cycles in a Crystal16 workstation. The temperature at which all crystals in a specific suspension were fully dissolved was noted as the saturation temperature Ts of the corresponding concentration. The
solubility information of the model compounds can then be used to construct the corresponding Van ’t Hoff plot (see Figure SII (left)) to extrapolate their solubility. The Van ’t Hoff plot was constructed by a linearly fit of the data in the lnx to 1/Ts
space, where x is molar fraction of the solute:
0
1
1
ln
s
H
x
R
T
T
A pseudo-binary phase diagram of PHE and CAF was constructed by measuring the Ts of various mixtures of the two solutes in dioxane. The compositions of each sample in the diagram are determined based on the following equation:
xCAF xCAF∗ (𝑇
𝑟𝑒𝑓)
= 1 −x xPHE PHE
∗ (𝑇
𝑟𝑒𝑓)
Here xPHE and xCAF are the molar fraction of respectively PHE and CAF in each sample while x*PHE and x*CAF are the molar
solubilities at reference temperature Tref. The saturation temperatures Ts of each sample were plotted against the
[image:8.612.101.516.322.457.2]solvent-excluded mole fraction yCAF = xCAF/(xCAF+xPHE) (Figure SII, right).
Figure SII. Left: Van’t Hoff plot of PHE and CAF in 1,4-dioxane; Right: pseudo-binary phase diagram of PHE-CAF. The Ts of pure CAF and PHE predicted using Van’t Hoff
parameters are shown as red and blue solid lines, respectively.
Only one eutectic point (at yCAF = 0.21) can be found in the phase diagram (Figure SII (right)). The pseudo-binary phase diagram does not show any indications of co-crystal formation in 1,4-dioxane with the compositions tested. When a stable co-crystal is formed, there would be a region in the phase diagram with elevated Ts compared to those predicted using Van’t Hoff parameters, shown as red and blue solid lines in Figure SII (right).
X-ray Powder Diffraction (XRPD) for crystal composition identification
X-ray powder diffraction (XRPD) was carried out in a Bruker D2 Phaser (Bruker AXS GmbH, Karlsruhe, Germany). Data collection was carried out using monochromatic Cu K α1 radiation (α = 0.154060 nm) in the 2θ region between 8° and 50°, step size 0.022° 2θ. Data evaluation was done with the Bruker program EVA.
Figure SIII.XRPD comparison between crystals collected from the anode in experiment 2A (left) and from the cathode in experiment 2B (right) with source material PHE and CAF. The samples from experiment 2A contained almost all CAF and those from 2B contained only PHE.
Figure SIV.XRPD comparison between crystals collected from the anode (left) and from the cathode (right) in experiment 3 with reference PHE (CCDC: GEPNOG) and CAF (CCDC: NIWFEE003). The samples from the anode mainly contained CAF while the samples from the cathode were mainly PHE.
Proton nuclear magnetic resonance (H
1-NMR) for crystal purity assessment
Two crystalline products were separately collected from the cathode and the anode in experiment 3. Two sub-sample from each crystalline product, namely C1 and C2 as from the cathode and A1 and A2 as from the anode, was individually used to prepare in total four solution samples with the solvent CDCl3 (0.03% TMS, >99.96%, euriso-top) and the reference 1,2,4,5-tetramethylbenzene (durene, Fluka Analytical, 99.83%). Each solution sample was evaluated by an Agilent 400 MHz NMR spectrometer and the mass fraction pi of PHE and CAF in the corresponding sub-sample was calculated based on the
obtained spectra, as in Equation (1).
∑ 𝑰𝒏𝒊𝟏 𝒊,𝒋
𝑰𝒓𝒆𝒇
= (
𝒑𝒊∙𝒎𝒔∙∑ 𝑵𝒏𝒊𝒋 𝒊,𝒋
𝑴𝒊
)/(
𝒑𝒓𝒆𝒇∙𝒎𝒓𝒆𝒇∙𝑵𝒓𝒆𝒇
𝑴𝒓𝒆𝒇
)
(1)where Ii,j (a.u.) is the integral of the jth identity peak of PHE or CAF in the NMR spectra where the integral of the reference
peak Iref, at 6.9 ppm, was set at 1000 a.u.; M (g/mol) is the molecular weight, which is 180 g/mol for PHE, 194 g/mol for CAF and 134 g/mol for the reference; m (mg) is the mass in the solution and Ni,j is the number of protons to the jth identity peak of PHE or CAF. Nref = 2 for the reference peak. ni is the number of identity peak of PHE or CAF. Subscript i stands for the two
[image:9.612.114.499.283.436.2]samples from experiment 3 can be found in Table SI, along with the mass fractions of PHE and CAF in each crystalline product.
Table SI. Summary of purity measurements of samples from experiment 3
Electrode I.D. of sub-samples
ms (mg) mref (mg) IPHE,11 (a.u.)
IPHE,21 (a.u.)
lCAF,12 (a.u.)
lCAF,22 (a.u.)
lCAF,32 (a.u.)
pPHE3(wt%) pCAF3(wt%)
Cathode C1 13.1 12.5 1529.1 1559.3 17.9 17.2 18.3 98.8 1.5
C2 13.6 12.8 1569.0 1613.6 17.8 18.0 18.4 100.4 1.5
Anode A1 12.6 13.7 118.3 123.3 877.6 899.8 870.1 8.8 92.3
A2 12.7 13.7 121.2 122.2 863.1 884.5 864.2 8.8 90.4
1The chemical shift of PHE identity peak is at 8.4 ppm (1st) and 7.9 ppm (2nd) and N
PHE,1=4 and NPHE,2=4; 2The chemical shift of CAF identity peak is at 3.9 ppm (1st), 3.5 ppm
(2nd
) and 3.3 ppm (3rd
) and NCAF,j=3 for all three peaks. 3The summation of pPHE and pCAF in some samples are slightly larger than 100%. The error is a combination of integration
errors and weighing errors. The average of pPHE (99.6±1.4 wt%) was used as the purity of the crystalline product from the cathode, while the average of pCAF (91.4±1.0 wt%) was
Figure SV.H1-NMR measurement of crystals collected from the anode (up) and the cathode (down) in experiment 3.