T E C H N I C A L N O T E
Open Access
WAVOS: a MATLAB toolkit for wavelet analysis
and visualization of oscillatory systems
Richard Harang
1*, Guillaume Bonnet
2and Linda R Petzold
1Abstract
Background:Wavelets have proven to be a powerful technique for the analysis of periodic data, such as those that arise in the analysis of circadian oscillators. While many implementations of both continuous and discrete wavelet transforms are available, we are aware of no software that has been designed with the nontechnical end-user in mind. By developing a toolkit that makes these analyses accessible to end end-users without significant programming experience, we hope to promote the more widespread use of wavelet analysis.
Findings:We have developed the WAVOS toolkit for wavelet analysis and visualization of oscillatory systems. WAVOS features both the continuous (Morlet) and discrete (Daubechies) wavelet transforms, with a simple, user-friendly graphical user interface within MATLAB. The interface allows for data to be imported from a number of standard file formats, visualized, processed and analyzed, and exported without use of the command line. Our work has been motivated by the challenges of circadian data, thus default settings appropriate to the analysis of such data have been pre-selected in order to minimize the need for fine-tuning. The toolkit is flexible enough to deal with a wide range of oscillatory signals, however, and may be used in more general contexts.
Conclusions:We have presented WAVOS: a comprehensive wavelet-based MATLAB toolkit that allows for easy visualization, exploration, and analysis of oscillatory data. WAVOS includes both the Morlet continuous wavelet transform and the Daubechies discrete wavelet transform. We have illustrated the use of WAVOS, and
demonstrated its utility for the analysis of circadian data on both bioluminesence and wheel-running data. WAVOS is freely available at http://sourceforge.net/projects/wavos/files/
Background
Many real-world sources of data display suggestively peri-odic behavior, but with time-varying period, amplitude, or mean. This variation can lead to inaccurate results when the data is analyzed with standard Fourier techniques, as Fourier analysis assumes stationarity of the signal and its basis functions are unbounded in time [1]. Wavelets, in contrast, are localized in both time and frequency. This in turn localizes the analysis, allowing the changes insignal properties to be tracked over time [2].
Wavelet analysis has proven to be invaluable in many problem domains, including ecological cycles [3], sunspot cycles [4], circadian cycles [5,6], nfradian cycles asso-ciated with gene transcripts [5], blood-flow dynamics [7], and ECG signals [8-10]. Our work todate has focused on
circadian data. This data typically displays many of the features that render a signal difficult to analyze via Four-ier techniques, including changes in period length, sharp transients, and phase shifts [6,11], as well as experimental artifacts such as loss of amplitude, shifting means [12], and“shot noise”when bioluminescence experiments are considered [13]. These features may require significant pre-processing of the data before analysis [14]. Recogniz-ing the potential of wavelet methods for analysis of circa-dian data, Price et al. [5] developed the WAVECLOCK software, implementing the Morlet CWT in the R statis-tical programming environment. The WAVECLOCK software has enabled and inspired several investigations [15,16], but requires familiarity with the R statistical pro-gramming language and command-line interface. Other wavelet implementations (e.g. WaveLab [17] or the MATLAB Wavelet Toolkit) exist, but are either general-purpose packages that assume significant familiarity with wavelets, proprietary software, or both.
* Correspondence: [email protected] 1
Department of Computer Science, University of California, Santa Barbara, CA, USA
Full list of author information is available at the end of the article
The wavelet transform, in both continuous (Morlet) and discrete (Daubechies) versions, offers a set of tools for the analysis of nonstationary oscillators that can avoid many of the issues associated with techniques that assume stationarity. The Morlet continuous wavelet transform can nonparametricallydenoise, detrend, and analyze the local frequency content of a signal in a single operation [1,15]. Application of the CWT enables such analyses as estimating the evolution of the period and phase of a signal across time, locating peaks and troughs even in the presence of large amounts of noise, tracking the evolution of the amplitude across time, and identify-ing multiple simultaneous oscillators. The discrete wave-let transform (DWT) enables multi-scale analysis of a signal using a sequence of compactly supported filters that decompose the signal into a set of component fre-quency bands [18]. While it yields less precise frefre-quency estimates than the CWT, it enables direct statistical sig-nificance testing of different frequency bands [19], and has better time localization properties than the CWT, allowing for more efficient removal of transients that are strictly time-limited. It also has reconstruction properties that are capable of preserving the mean of the signal [18]. Thus the DWT can be used as a pre-processing step for other, non-wavelet analyses. Readers interested in learn-ing more about the continuous wavelet transform are referred to [2]; for further information on discrete wave-lets, see [19].
We have designed WAVOS to be a comprehensive, user-friendly toolbox for wavelet analysis and visualiza-tion of oscillatory signals that makes beginning-to-end wavelet processing and analysis accessible to users with a minimum of expertise in mathematics or computing. We present several analyses via a graphical user inter-face as illustrated in Figures 1, 2, 3. In the following, we discuss the capabilities and use of WAVOS and some results for circadian systems that we have recently obtained using this software. While the focus of this article is on circadian data, and the preset options are targeted towards such analysis (as described in the sequel), the WAVOS GUI and included functions may be readily used to analyze data of any periodicity by adjusting the minimum and maximum wavelength parameters.
Implementation
WAVOS is implemented in MATLAB to allow for easy modification. The convolutions required for both the discrete and continuous wavelet transforms are per-formed in the Fourier domain. Several options are pro-vided for managing the implicit periodization and corresponding boundary effects that this produces in the CWT, including zero-padding, edge-reweighting, and truncation of affected CWT coefficients (as in [5]).
[image:2.595.305.540.88.276.2]For the discrete wavelet transform, the standard deci-mated transform may cause localization issues for parti-cularly sharp transients, depending upon the place at which the signal is split during decimation. The transi-ent may be completely contained in a particular coeffi-cient of the transform, or it may be split between two adjacent coefficients. This has the undesirable effect of potentially allowing two different rotations of identical data to produce two different sets of DWT coefficients [19]. To avoid this issue, we use a redundant version of the DWT known in various contexts as the “ undeci-mated”, “shift-invariant”, or“maximum-overlap” DWT [19]. This transform is invariant to rotation of the data.
Figure 1 CWTgui main interface. The main user interface of CWTgui, containing controls to load the data, select analysis parameters, and select the output type and location. CWTgui performs batch analysis of a dataset using the Morlet CWT and returns the results as either a MATLAB environment variable, or saved to a file.
[image:2.595.306.541.538.663.2]Statistical significance testing of the levels of the DWT decomposition is performed using a Chi-squared test, under the assumption of additive Gaussian noise as described in [19].
The default parameters in the GUI are geared towards analysis of circadian signals. In particular, the minimum and maximum periods default to 6 and 48, respectively, with a default sampling rate of 1. These presets assume hourly samples of data with periods of interest in the above range. Both the sampling rate and the periods of interest may be adjusted independently of each other. The tool will not attempt to analyse periodicities that exceed the minimum or maximum possible due to num-berof samples and sampling rate, and will emit a warning message with the actual bounds used if such an analysis is attempted. For DWT denoising, a default p-value of 0.05 is used, as this is a generally accepted standard for statistical significance. Users may also select different levels of the decomposition by hand, in order to focus on periodicities of the data that interest them.
Due to the native MATLAB implementation, long time series (on the order of 10,000 or more observations) may result in analyses requiring several minutes per time series to complete. This may be mitigated by reducing the range of periods to be analyzed in the CWT, or down-sampling
the series to a shorter one with a smaller number of sam-ples per unit time. Data sets containing a large number of time series with a large number of samples may exhaust MATLAB’s working memory, causing an error; this will depend strongly on the computer being used. Due to MATLAB’s representation of data in matrix form, all time series in a single data set to be processed as a batch must contain an equal number of observations. Time series with differing numbers of observations may be processed and analyzed separately.
Usage
The CWT and DWT have different features that incline them toward different uses. The Morlet CWT is most useful for investigating local properties of a signal: its detailed decomposition of time and frequency allows for very close tracking of several statistics of interest, how-ever it cannot efficiently reconstruct a signal from indivi-dual components. The DWT fills a complementary role; while its time-frequency decomposition is very coarse, it is capable of reconstruction of a signal and also permits statistical testing. This allows the DWT to be used for many familiar signal-processing tasks, such as denoising and detrending, that are difficult to accomplish with the CWT.
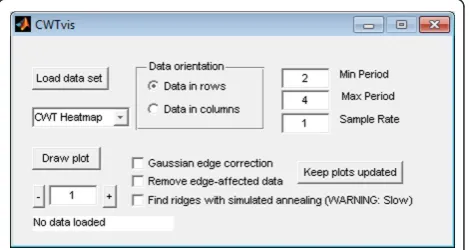
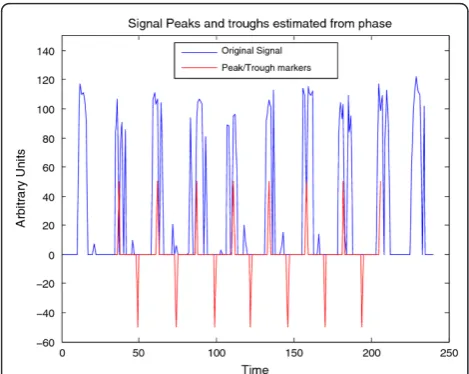
The Morlet CWT may be viewed as a modification of the windowed Fourier transform (WFT) that scales the size of the window to a constant number of wavelengths for any analysis frequency [2], resulting in good fre-quency detection across a wider range of periods than many other methods. For example, Figure 4 displays a synthetic signal with a period that is shifting from 24 to 18 hours in length. Figure 5 shows the CWT heatmap of that signal with Gaussian edge correction applied and the edge-affected coefficients both included and excluded (all options that can be set within the WAVOS CWT mod-ule, see Figures 1 and 2). Note that the ridge of the heat-map (highlighted in green) tracks the changing period of oscillation. The changing period appears in more detail in Figure 6, where the instantaneous period is estimated using several different options within WAVOS. The Fourier-transform-like nature of the Morlet CWT allows for estimation of phase but localizes the signal, thus improving the accuracy of locating associated features such as the signal peak and trough. Figure 7 shows the peak and trough points of the signal, as well as the instantaneous amplitude measurements, obtained from the phase along the ridge identified in Figure 5.
[image:3.595.57.291.86.389.2]The CWT is excellent for examining local features of a signal. On the other hand, it is not well-suited for signal processing tasks such as decomposing the signal into dif-ferent wavelengths, discarding or shrinking some coeffi-cients related to particularwavelengths, and reconstructing the signal. Fortunately, the Discrete Wavelet Transform is
well-suited for these tasks. Figure 8 illustrates the use of the DWT in two different modes provided by WAVOS (see Figure 3) to process the signal and remove either sta-tistically insignificant noise, or portions of the signal out-side of a particular range of frequencies. An analysis of a signal with missing data is provided in Figures 9, 10, 11, 12, 13; these figures illustrate the robustness of the CWT and DWT to significant amounts of missing data. All fig-ures were generated using WAVOS.
[image:4.595.303.539.86.272.2]Using the Morlet CWT in WAVOS has enabled us to analyze the distributional properties of the period of rat SCN cells based on PER2::LUC bioluminescence data [6]. Where previous studies had classified cells as either arrhythmic or circadian, our wavelet analysis revealed that individual cells, when removed from network inter-actions, intermittently express circadian and/or longer infradian periods. Results from our stochastic model suggest that the uncoupled cells may beswitching
[image:4.595.57.293.88.277.2]Figure 4Synthetic signal A. Synthetic signal A; decreasing period from 24 to 18 hours, stable baseline, decaying amplitude. Shifting periods are not effectively detectable by the Fourier transform, and will lead to poor estimates of the period. In contrast, analysis by the CWTyields local estimates of the period.
[image:4.595.57.293.483.672.2]Figure 5CWTheatmap of synthetic signal A. The first step of analysis of synthetic signal A (Figure 4) with the CWT: generating the CWT heatmap. The upper panel shows the complete CWT heatmap, the lower panel shows the CWT heatmap with all edge-influenced coefficients removed. The ridge is overlaid in green.
Figure 6Period estimates for synthetic signal A. Estimated period of synthetic signal A (Figure 4), showing three different edge correction options. These estimates are derived from the ridge of the heatmap as shown in Figure 5. The true period is overlaid in green. This data may be plotted via CWTvis and exported to either an external file or a MATLAB variable with CWTgui.
[image:4.595.304.539.490.671.2]between two ocsillatory mechanism: the indirect nega-tive feedback of protein complex PER-CRY on the expression of Per and Cry genes, and the negative feed-back of CLOCK-BMAL1 on the expression of the Bmal1 gene.
As another example, we have also used WAVOS to analyze wheel-running data for wild-type mice in a 12:12 light:dark cycle (unpublished data, courtesy of the
[image:5.595.305.539.86.276.2]Herzog lab). The data contains wheel revolutions per minute sampled every 15 minutes for 10 days. Figure 14 shows the DWT decomposition plot; the main periodi-city of roughly 24 hours is clearly visible in the 16-32 hour band, and the noise associated with waking beha-vior is visible in the highest frequency/shortest period
Figure 8Denoising/detrending of synthetic signal A. Denoising/ detrending of the synthetic signal A (Figure 4) using the DWT. The upper panel displays the output of the DWT processing of signal A on the basis of value, retaining only those coefficients with a p-value of less than 0.05. The lower panel displays the output of the DWT processing of signal A by hard-thresholding period boundaries. Note that p-value based processing typically retains a non-zero mean as well as moving baselines, since these tend to be statistically significant.
[image:5.595.57.293.88.276.2]Figure 9Synthetic signal B. Synthetic signal B; stable period with censored middle. The gap causes Fourier methods substantial difficulty.
Figure 10CWTheatmap of synthetic signal B. The first step of analysis of synthetic signal B (Figure 9) with the CWT: generating the CWT heatmap. The upper panel shows complete CWT heatmap. The lower panel shows the CWT heatmap with all edge-influenced coefficients removed. The ridge is overlaid in green. Note that a small distortion is created by the missing data, however the CWT is capable of interpolating over this range.
[image:5.595.304.539.456.641.2] [image:5.595.57.292.503.690.2]bands at the bottom. The same data is analyzed in Figure 15 via CWT; the circadian periodicity of 24 hours is clearly visible, highlighted via the ridge, along
with intermittent ultradian rhythms. Edge effects have been removed (black masking) to avoid potential arti-facts in the analysis. Finally, Figure 16 shows peak and trough phase markers inferred automatically from the CWT (green) overlaid on the original data (blue). As above, edge-effect masking has been performed. Despite the noisy and non-sinusoidal nature of the data, the CWT accurately selects the appropriate phase markers. Figures 14, 15, 16 were created using the WAVOS GUI.
[image:6.595.305.539.88.257.2]WAVOS has many features to facilitate analysis with the DWT and CWT, including: both command-line and gra-phical user interfaces; automatic processing of multiple time series simultaneously; interfaces to multiple standard file formats (including .csv,.xls, .txt, and .mat); automated
Figure 12Feature extraction for synthetic signal B. Estimated peak, troughs, and instantaneous amplitude of synthetic signal B (Figure 9) estimated via the CWT; this plot may be visualized in CWTvis and exported to either an external file or a MATLAB variable with CWTgui. The amplitude estimate suffers somewhat from the missing data, however the peak-trough estimates are
successfullyinterpolated.
[image:6.595.57.291.88.273.2]Figure 13 Denoising/detrending of synthetic signal B. Denoising/detrending of the synthetic signal B (figure 9) using the DWT. The upper panel displays the output of the DWT processing of signal B on the basis of p-value, only retaining those coefficients with a p-value of less than 0.05. The lower panel displays the output of the DWT processing of signal A by hard-thresholding period boundaries. Note that p-value based processing typically retains a non-zero mean as well as moving baselines, since these do tend to be statistically significant. Hard-thresholding to remove baselines can lead to some distortionof missing data as seen in the lower panel.
[image:6.595.302.539.502.683.2]Figure 14 DWT analysis of wheel-running data. The DWT decomposition plot of 10 days of wheel-running data from a wild-type mouse in a 12:12 light schedule (generously provided by the Herzog lab).
detection and extraction of multiple statistics of interest (period, phase, amplitude, peak-to-trough measurements, and Rayleigh synchronization measurements); visualization tools for both exploration and analysis; utilities for smoothing, detrending, and statistical significance testing using the DWT; and multiple ridge selection algorithms, including local maximum and simulated annealing (the “crazy climber”method of [20]). Complete details are pro-vided in the WAVOS documentation (at the download link).
Future development of WAVOS will concentrate on feature extraction from circadian signals, in particular allowing end-users to select user-defined phase markers for further analysis.
Availability and requirements
•Project name:WAVOS - Wavelet Analysis and Visua-lization of Oscillatory Signals
•Project home page:http://sourceforge.net/p/wavos/ home/Home/
•Operating Systems:Cross-platform with MATLAB 2007a or later
•Programming language:MATLAB
•Other requirements:MATLAB 2007a or later •License:Modified BSD
Acknowledgements
We wish to thank the Herzog lab at Washington University in St. Louis for their generous help, the locomotor data presented above, and feedback in evaluating early versions of WAVOS.
This work was funded by: ICB grants through the Army Research Office (DAAD 19-03-D-0004) and NIH grants GM078993 and GM096873-01.
Author details
1
Department of Computer Science, University of California, Santa Barbara, CA, USA.2Department of Statistics and Applied Probability, University of California, Santa Barbara, CA, and Google Inc, Mountain View, CA, USA.
Authors’contributions
RH wrote the initial version of WAVOS under the supervision of GB. Subsequent versions were prepared under the supervision of LRP. GB wrote the edge reweighting code to address implicit periodization edge effects in the CWT. All authors contributed equally to the authorship of the manuscript. All authors read and approved the final manuscript.
Competing interests
The authors declare that they have no competing interests.
Received: 12 September 2011 Accepted: 26 March 2012 Published: 26 March 2012
References
1. Mallat S:A Wavelet Tour of Signal ProcessingAcademic Press; 1999. 2. Torrence C, Compo GP:A practical guide to wavelet analysis.Bull Am
Meteorol Soc1998,79:61-78[http://citeseer.ist.psu.edu/article/ torrence98practical.html].
3. Cazelles B, Chavez M, Berteaux D, Mnard F, Vik JO, Jenouvrier S, Stenseth NC:Wavelet analysis of ecological time series.Oecologia2008,
156(2):287-304[http://www.springerlink.com/content/5l644h35w8872272/]. 4. Krivova NA, Solanki SK:The 1.3-year and 156-day periodicities in sunspot
data: wavelet analysis suggests a common origin.AstronAstrophys2002,
394(2):6.
5. Price TS, Baggs JE, Curtis AM, FitzGerald GA, Hogenesch JB:WAVECLOCK: wavelet analysis of circadian oscillation.Bioinformatics2008,
24(23):2794-2795[http://bioinformatics.oxfordjournals.org.proxy.library.ucsb. edu:2048/content/24/23/2794.abstract].
6. Meeker K, Harang R, Webb AB, Welsh DK, FJD III, Bonnet G, Herzog ED, Petzold LR:Wavelet Measurement Suggests Cause of Period Instability in Mammalian Circadian Neurons.Journal of Biological Rhythms2011,
26(4):353-362.
7. Brai M, Stefanovska A:Wavelet-based analysis of human blood-flow dynamics.Bull Math Biol1998,60(5):919-935[http://dx.doi.org/10.1006/ bulm.1998.0047].
8. Addison PS:Wavelet transforms and the ECG: a review.Physiol Meas2005,
26(5):R155-R199[http://www.iop.org.proxy.library.ucsb.edu:2048/EJ/abstract/ 0967-3334/26/5/R01].
9. Kong J, Chi Z, Lu W:Electrocardiogram compression using modulus maxima of wavelet transform.Engineering in Medicine and Biology Society, 1998.Proceedings of the 20th Annual International Conference of the IEEE
1998,3:1527-1530.
10. Morlet D, Peyrin F, Desseigne P, Touboul P, Rubel P:Time-scale analysis of high-resolution signal-averaged surface ECG using wavelet
transformation.Computers in Cardiology 1991, Proceedings1991, 393-396. 11. Herzog ED, Aton SJ, Numano R, Sakaki Y, Tei H:Temporal precision in the
mammalian circadian system: a reliable clock from less reliable neurons. J Biol Rhythms2004,19:35-46[http://jbr.sagepub.com/cgi/content/abstract/ 19/1/35].
12. Herzog ED, Takahashi JS, Block GD:Clock controls circadian period in isolated suprachiasmatic nucleus neurons.Nat Neurosci1998,1(8):708-713 [http://www.ncbi.nlm.nih.gov.proxy.library.ucsb.edu:2048/pubmed/ 10196587], [PMID: 10196587].
13. Welsh DK, Takahashi JS, Kay SA:Suprachiasmatic nucleus: cell autonomy and network properties.Annu Rev Physiol2010,72:551-577[http://www. ncbi.nlm.nih.gov/pubmed/20148688], [PMID: 20148688].
14. Levine J, Funes P, Dowse H, Hall J:Signal analysis of behavioral and molecular cycles.BMC Neurosci2002,3:1[http://www.biomedcentral.com/ 1471-2202/3/1].
15. Baggs JE, Price TS, DiTacchio L, Panda S, FitzGerald GA, Hogenesch JB:
[image:7.595.56.291.88.275.2]Network features of the mammalian circadian clock.PLoS Biol2009,7(3): e1000052, doi:http://dx.doi.org/10.1371/journal.pbio.1000052.
16. Etchegaray J, Yu EA, Indic P, Dallmann R, Weaver DR:Casein Kinase 1 Delta Regulates Period Length of the Mouse Suprachiasmatic Circadian Clock
In Vitro.PLoS ONE2010,5(4):e10303[http://dx.doi.org/10.1371%2Fjournal. pone.0010303].
17. Buckheit J, Donoho D:Wavelab and Reproducible Research.InWavelets and Statistics.Edited by: Antoniadis A. Springer-Verlag, New York, NY; 1995:55-81.
18. Daubechies I:Ten lectures on waveletsSociety for Industrial and Applied Mathematics; 1992 [http://portal.acm.org/citation.cfm?
id=SERIES9271.130655].
19. Percival DB, Walden AT, Gill R:Wavelet Methods for Time Series AnalysisNew York: Cambridge University Press; 2000.
20. Carmona R, Hwang W, Torresani B:Multiridge detection and time-frequency reconstruction.Signal Processing, IEEE Transactions on [see also Acoustics, Speech, and Signal Processing, IEEE Transactions on]1999,
47(2):480-492.
doi:10.1186/1756-0500-5-163
Cite this article as:Haranget al.:WAVOS: a MATLAB toolkit for wavelet analysis and visualization of oscillatory systems.BMC Research Notes 20125:163.
Submit your next manuscript to BioMed Central and take full advantage of:
• Convenient online submission
• Thorough peer review
• No space constraints or color figure charges
• Immediate publication on acceptance
• Inclusion in PubMed, CAS, Scopus and Google Scholar
• Research which is freely available for redistribution