RESEARCH ARTICLE
Modelling the trends of inpatient
and outpatient rehabilitation
for methamphetamine in the Western Cape
province of South Africa
J. Mushanyu
1*, F. Nyabadza
2and A. G. R. Stewart
1Abstract
Background: Dependence on methamphetamine remains one of the major health and social problem in the West-ern Cape province of South Africa. We consider a mathematical model that takes into account two forms of rehabilita-tion, namely; inpatient and outpatient. We examine the trends of these two types of rehabilitation. We also seek to investigate the global dynamics of the developed methamphetamine epidemic model.
Methods: The model is designed by likening the initiation process to an infection that spreads in a community through interactions between methamphetamine users and non-users. We make use of Lyapunov functions obtained from a suitable combination of common quadratic and Volterra-type functions to establish the global stability of the methamphetamine-persistent steady state. The least squares curve fit routine (lsqcurvefit) in Matlab with optimization is used to estimate the parameter values.
Results: The model analysis shows that the model has two equilibria, the methamphetamine free equilibrium and the methamphetamine persistent equilibrium, that are both globally stable when the threshold Ra<1 and Ra>1,
respectively. Upon fitting the model to data on drug users under rehabilitation, parameter values that give the best fit were obtained. The projections carried out the long term trends of these forms of rehabilitation.
Conclusion: The results suggest that inpatient rehabilitation programs have an increased potential of enhancing the chances of recovery for methamphetamine addicts.
Keywords: Methamphetamine, Reproduction number, Inpatient rehabilitation, Outpatient rehabilitation, Least squares curve fitting
© 2015 Mushanyu et al. This article is distributed under the terms of the Creative Commons Attribution 4.0 International License (http://creativecommons.org/licenses/by/4.0/), which permits unrestricted use, distribution, and reproduction in any medium, provided you give appropriate credit to the original author(s) and the source, provide a link to the Creative Commons license, and indicate if changes were made. The Creative Commons Public Domain Dedication waiver (http://creativecommons.org/ publicdomain/zero/1.0/) applies to the data made available in this article, unless otherwise stated.
Background
The methamphetamine abuse problem and its conse-quences to communities in the Western Cape province present a complex scenario that drives sexually transmit-ted infections morbidity, mortality and heavy budgetary constraints. For example in South Africa over R20 billion is used annually, in treating drug users, cracking down drug traffickers and in prevention and media campaigns
[1]. In the Western Cape Province of South Africa, the rising demand for substance abuse services and calls by communities for additional services has led to the Pro-vincial Department of Social Development allocating additional resources to the prevention and treatment of substance use disorders (SUD’s). However, planning around the allocation of these resources has been ham-pered by several informational barriers. Decision makers within the Western Cape Department of Social Develop-ment (DOSD) do not have adequate information on the nature and extent of substance abuse in the province, the extent to which there is unmet substance abuse service needs, where these unmet needs are greatest, and which
Open Access
*Correspondence: mushanyuj@gmail.com
1 Department of Mathematics, University of Zimbabwe, Box MP 167,
Mount Pleasant, Harare, Zimbabwe
population subgroups have relatively high unmet needs [2]. There is therefore need for extensive research into methamphetamine abuse trends for the development of public policies and focused correctional services to decrease the gang populations.
Recently, many researchers have drawn a lot of scholar-ship from infectious diseases modelling with the aim of describing drug abuse spreading like an infectious disease [3–5]. Typical examples are models designed for heroin epidemics [12–15], peer influence [6–9] and the spread of alcoholism [10, 11]. Mathematical models can contrib-ute to the understanding of the various aspects of meth-amphetamine use and are very useful in determining how prevalent drug use is. They can even help in designing and choosing proper interventions by providing a means of integrating data from different sources, describing a process to increase understanding and simulating policy experiments that are cumbersome in real life [16–18].
There are two primary forms of rehabilitation for meth-amphetamine addiction namely; inpatient and outpa-tient rehabilitation [19]. Rehabilitation helps individuals to improve their function, mobility, independence and quality of life. It helps individuals live fully regardless of impairment. It helps people who are living with various health conditions to maintain the functioning they have [20]. Inpatient methamphetamine rehabilitation provides an addict a place to live and at the same time providing 24 h support and treatment. Outpatient methamphetamine rehabilitation allows users to reside at home and come to the treatment center on a regular basis [19] (Figs. 1, 2).
Mathematical models on drug abuse that have been developed so far, have unified rehabilitation, see for
instance [14, 15, 21, 31]. In this paper, we develop a math-ematical model that takes into account both inpatient and outpatient forms of rehabilitation. Our aim is to examine the trends of these two types of rehabilitation. We also seek to investigate the global dynamics of the developed methamphetamine epidemic model. We ana-lyze the global stability of the model equilibria and fit the model to data on these two forms of rehabilitation.
The paper is arranged as follows; in Sect. “Methods”, we formulate and establish the basic properties of the model. The model is analysed for stability in Sect. “Model analysis”. Parameter estimation and projection graphs are given in Sect. “Results and discussion”. Numerical results are also presented in this section. The paper is concluded in Sect. “Conclusions” (Figs. 3, 4).
Methods
Model formulation
The dynamics of inpatient and outpatient rehabilita-tion are modelled by considering the human popu-lation divided into four distinct compartments. The Fig. 1 Model flow diagram. Schematic diagram showing the
move-ment of humans as their status with respect to drug use changes
20000 2002 2004 2006 2008 2010 2012 0.1
0.2 0.3 0.4 0.5 0.6 0.7 0.8
Time in years
Proportion of drug users under inpatient reha
b
[image:2.595.307.539.87.280.2] [image:2.595.57.291.492.697.2]compartments comprise of S denoting the population at risk of being initiated into methamphetamine abuse, U
those initiated into methamphetamine abuse, T0 those in
rehabilitation as out-patients and Ti those in
rehabilita-tion as in-patients. Here, all susceptible individuals range from age 15–64 years. The total human population is thus given by
N =S+U+T0+Ti.
We assume that individuals in each compartment are indistinguishable and there is homogeneous mixing. Sus-ceptible humans enter the population through births or immigration at a rate . Susceptible individuals are
ini-tiated into methamphetamine use following interaction with individuals using drugs. We assume an initiation function that is analogous to the force of infection for epidemic models. Thus, the per capita contact rate β is a product of the effective number of contacts c, between methamphetamine users and the susceptible population, and the probability βˆ, that a contact results into
initia-tion into methamphetamine use, that is, β =cβˆ. A frac-tion U/N of the contacts is with those drug users not in rehabilitation and the average number of potential con-tacts resulting in susceptible individuals becoming meth-amphetamine abusers is βU/N. Also, a fraction T0/N of
the contacts is with individuals under outpatient reha-bilitation. The average number of potential contacts of each susceptible individual with individuals in outpatient rehabilitation is βηT0/N. The parameter η measures the
relative ability for individuals in outpatient rehabilitation to initiate new methamphetamine users. Assuming that the rate at which individuals in outpatient rehabilitation recruit initiates is lower than that for drug users not in rehabilitation, we have, 0< η <1. This is due to the fact
that individuals in outpatient rehabilitation will be receiv-ing some form of counsellreceiv-ing and therapy to aid them in quitting drug abuse. Such counselling may lead them to discourage susceptible individuals into becoming meth-amphetamine abusers. This done by raising awareness on the dangers associated with problematic drug use. Here, we make an assumption that individuals under inpatient rehabilitation cannot produce new initiates due to the fact that, they do not come in contact with the general population during the rehabilitation process. The total number of relevant contacts gives the initiation function,
Upon being initiated into methamphetamine use, a sus-ceptible individual moves into the compartment U, of methamphetamine abusers. Upon realizing the demoral-izing consequences related to methamphetamine abuse, individuals in the compartment U seek help via reha-bilitation programs. We consider two primary types of rehabilitation programs, namely; inpatient and outpa-tient forms of rehabilitation. Here, we define the effec-tiveness of these rehabilitation programs to be, “the measure of the benefits and changes in the functioning of an individual acquired during the period when he/ she was under treatment”. The effectiveness of rehabilita-tion programs is measured by the parameter ε. If ε=0, then the rehabilitation programs are not effective,
(1) = β
U+ηT0
N
. 2000 2002 2004 2006 2008 2010 2012 2014
0.01 0.011 0.012 0.013 0.014 0.015 0.016 0.017 0.018 0.019 0.02
Time in years
Incidence (%
)
Fig. 3 Estimated incidence of methamphetamine abuse using data for inpatient rehabilitants in Cape Town. Our estimated incidence of methamphetamine abuse, evaluated using the initiation function S, is observed to be generally decreasing over the modeling period
20000 2002 2004 2006 2008 2010 2012 0.1
0.2 0.3 0.4 0.5 0.6 0.7
Time in years
Proportion of drug users in outpatient reha
b
[image:3.595.57.292.89.259.2] [image:3.595.60.290.311.511.2]ε=1 corresponds to completely effective rehabilita-tion programs, while 0< ε <1 implies that
rehabilita-tion programs will be effective to some degree. Amongst individuals in compartment U who are seeking help through rehabilitation, we have that a proportion p of these individuals are recruited into inpatient rehabilita-tion facilities and the complementary proporrehabilita-tion (1−p) are recruited into outpatient rehabilitation. The rate at which methamphetamine users are recruited into reha-bilitation (inpatient or outpatient) is given by σ. Once
an individual is in the rehabilitation phase, he/she can either quit permanently, relapse into methamphetamine use or die. Individuals experience natural death at a rate
µ. The rate at which individuals under outpatient
reha-bilitation quit methamphetamine abuse permanently is represented by δ0 and the rate at which those under
inpatient rehabilitation quit methamphetamine abuse permanently is represented by δ1. Individuals undergoing
outpatient rehabilitation relapse into methamphetamine use at a rate ρ1 and individuals in inpatient rehabilitation
facilities relapse into methamphetamine use at a rate ρ2. Substance abusers undergoing outpatient rehabilitation continue to keep contact with people and circumstances that trigger addiction whereas substance abusers under-going inpatient rehabilitation are completely immersed in the program and separated from the lifestyle and hab-its that supported drug use, thus, relapsing may be more likely for outpatient rehabilitants as compared to inpa-tient rehabilitants. We can safely assume that ρ2< ρ1.
Individuals under inpatient rehabilitation programs can move to outpatient rehabilitation programs at a rate γ2 . This movement may be as a result of some individuals failing to cope up with the higher costs usually associ-ated with inpatient rehabilitation and thereby forcing them rather to seek help through outpatient rehabilita-tion which is generally cheaper. This movement might also be as a result of noted recovery to some individuals, who if discharged can still fully recover whilst residing at home. The rate at which individuals under outpatient rehabilitation move to inpatient rehabilitation facilities is given by γ1. This movement can be due to the fact that
some individuals under outpatient rehabilitation might want to take full advantage of all the resources available in treatment, such as personal therapy, group therapy, educational classes on addiction as well as job skills and other related support structures in order to quicken their recovery process. So this in turn will lead them to seek help from inpatient rehabilitation facilities.
The description of the model formulation and the model diagram lead to the following set of nonlinear ordinary differential equations together with the initial conditions (Figs. 5, 6):
(2) dS
dt = �−S−µS,
2000 2002 2004 2006 2008 2010 2012 2014 0.08
0.1 0.12 0.14 0.16 0.18 0.2 0.22
Time in years
Incidence (%)
Fig. 5 Estimated incidence of methamphetamine abuse using data for outpatient rehabilitants in Cape Town. Our estimated incidence of methamphetamine abuse, evaluated using the initiation function S, is observed to be decreasing sharply from the first half of the year 2000 down until the second half of the year 2002. It then suddenly increases from about 9 % in the year 2003 reaching an estimated incidence of 13 % in the second half of 2008, after which it steadily decreases until the first half of the year 2013
2000 2002 2004 2006 2008 2010 2012 2014 2016 2018 0.2
0.4 0.6 0.8 1 1.2 1.4 1.6
Time in years
Ratio of inpatients to outpatient
s
[image:4.595.307.539.89.261.2] [image:4.595.307.539.370.552.2]Model analysis
Model properties
Positivity of solutions
We now consider the positivity of model system Eqs. (2)–(5). We prove that all the state variables remain non-negative and the solutions of model system Eqs. (2)–(5) with positive initial conditions will remain positive for all
t>0. We thus state the following theorem (Figs. 7, 8).
Theorem 1 Given that the initial condi-tions of model system Eqs. (2)–(5) are S(0) >0 ,
U(0) >0, T0(0) >0 and Ti(0) >0. There exists
(S(t),U(t),T0(t),Ti(t)):(0,∞)→(0,∞) which solve
the model system Eqs. (2)–(5).
Proof Assume that
Thus ˆt>0, and it follows from the first equation of
model system Eqs. (2)–(5) that
giving
(3)
dU
dt = S+(1−ε)ρ2Ti
+(1−ε)ρ1T0−(µ+σ )U,
(4) dT0
dt = (1−p)σU+γ2Ti
−(µ+γ1+(1−ε)ρ1+δ0)T0,
(5) dTi
dt = pσU+γ1T0
−(µ+γ2+(1−ε)ρ2+δ1)Ti,
S(0) =S0>0,U(0)
= U0≥0,T0(0) = T00≥0,Ti(0) = Ti0≥0.
ˆ
t = sup{t>0: S>0,U >0, T0>0, Ti >0} ∈ [0,t].
S(tˆ)exp
µtˆ+ ˆt
0 (s)ds
−S(0)≥ tˆ
0 �exp
µˆt+
ˆt
0
(ν)dν
dt,ˆ
S(tˆ)≥S(0)exp
−
µˆt+
tˆ
0 (s)ds
+exp
−
µˆt+
tˆ
0 (s)ds
×
tˆ
0 �exp
µˆt+
ˆt
0
(ν)dν
dtˆ
>0.
From the second equation of model system Eqs. (2)–(5), we obtain
Similarly it can also be shown that T0(t) >0 and
Ti(t) >0 for all t>0, and this completes the proof.
Invariant region
Theorem 2 The feasible region G defined by
with initial conditions S0≥0, U0≥0, T00≥0 and
Ti0≥0 is positively invariant and attracting with respect
to model system Eqs. (2)–(5) for all t>0.
Proof Summing up Eqs. (2)–(5), we obtain that the total population satisfies the differential equation
dU
dt ≥ −(µ+σ )U, ⇒U(ˆt) = U0e−(µ+σ )
ˆ t>0.
G =
(S,U,T0,Ti)∈R4+|0≤N ≤
� µ
, 20000 2002 2004 2006 2008 2010 2012 2014 2016 2018 0.1
0.2 0.3 0.4 0.5 0.6 0.7 0.8
Time in years
Proportion of drug users under inpatient rehab
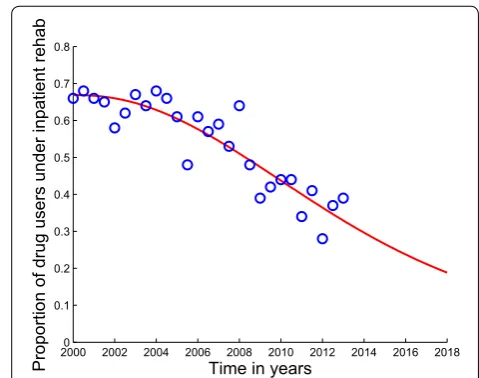
Fig. 7 Model system Eqs. (2)–(5) fitted to data for individuals under inpatient rehabilitation in Cape Town and projected for 5 more years.
The blue circles indicate the actual data and the solid red line indicates
[image:5.595.299.539.87.276.2]Applying a theorem by Birkhoff and Rota [22], on differ-ential inequalities, we have
where N(0) represents the value of Eqs. (2)–(5) evaluated at the initial values of the respective variables. Taking the limit as t→ ∞, we have that 0≤N ≤�
µ. Thus, the state variables remain biologically meaningful in the set
for all positive initial conditions in R4+. Thus G is a
posi-tively invariant region and all solutions of Eqs. (2)–(5), with (S0,U0,T00,Ti0)∈R4+ remain in G for all t>0.
Therefore the ω− limit set of solutions of Eqs. (2)–(5) in
G are contained in G. The uniqueness, existence and
con-tinuity results hold for Eqs. (2)–(5). The system is thus mathematically and epidemiologically well-posed, see also [4]. Our analysis will be based on the dynamics of
the solutions generated in G.
Methamphetamine‑free equilibrium and the abuse reproduction number
In this section, we carry out stability analysis of the methamphetamine-free equilibrium. The model has a methamphetamine-free equilibrium given by
(6) dN
dt ≤�−µN.
0 ≤ N(t)≤�
µ +N(0)e
−µt,
G =
(S,U,T0,Ti)∈R4+|0≤N ≤
� µ
,
G0 = (S0,U0,T00,Ti0) =
� µ, 0, 0, 0
,
a scenario depicting a methamphetamine-free state in the community or society. The abuse reproduction number of the model, denoted Ra, is the average number of sec-ondary cases generated by one drug user during his/her duration of drug use in a population of completely poten-tial drug users. The determination of Ra through the next generation matrix [23] method has been explored in many papers (see for instance [24–29]). Using the same method we have
where
Here, Ra is the sum of three sub-reproduction num-bers representing the contributions of individuals in compartments U, T0 and Ti respectively. The term 1 is
the proportion of individuals who move back and forth between compartments T0 and Ti, 2 is the proportion of
individuals who move back and forth between compart-ments T0 and U and 3 is the proportion of individuals who move back and forth between compartments Ti and
U. Interestingly, 4 is the proportion of those individuals who were once inpatient rehabilitants and have relapsed after joining outpatient rehabilitation and lastly, 5 is the
proportion of those individuals who were once outpa-tient rehabilitants and have relapsed after joining inpa-tient rehabilitation facilities. The terms 4 and 5 play an
essential role in evaluating the effectiveness of inpatient and outpatient rehabilitation programs.
The following result follows from [23].
Theorem 3 The methamphetamine-free equilibrium point G0 of model Eqs. (2)–(5) is locally asymptotically
stable for Ra≤1 and unstable otherwise. Ra = RU +RT0 +RT
i
RU =
β g1
1−�1
1−(�1+�2+�3+�4+�5)
,
RT0 = p
σ g1
βη g2
γ2 g3
1
1−(�1+�2+�3+�4+�5)
,
RTi =
(1−p)σ g1
βη g2
1
1−(�1+�2+�3+�4+�5)
,
with g1 =µ+σ,g2 =µ+γ1+(1−ε)ρ1+δ0,
g3 =µ+γ2+(1−ε)ρ2+δ1,
�1 = γ1γ2 g2g3,
�2 =
(1−p)(1−ε)ρ1σ g1g2 ,
�3 =
p(1−ε)ρ2σ
g1g3 ,
�4 =
p(1−ε)γ2ρ1σ
g1g2g3 and
�5 =
(1−p)(1−ε)γ1ρ2σ g1g2g3 .
2000 2002 2004 2006 2008 2010 2012 2014 2016 2018 0.006
0.008 0.01 0.012 0.014 0.016 0.018 0.02
Time in years
Incidence (%
)
[image:6.595.57.291.89.260.2]Global stability of the methamphetamine‑free steady state
We shall now prove the global stability of the metham-phetamine-free equilibrium point G0 whenever the
repro-duction number is less than unity.
Theorem 4 The methamphetamine-free equilibrium pointG0 of model Eqs. (2)–(5) is globally asymptotically
stable for Ra≤1 and unstable ifRa>1.
Proof Let V(U,T0,Ti) = aU+bT0+cTi be a
candi-date Lyapunov function for some non-negative constants
a, b and c. The time derivative of V is given by
We now evaluate the coefficients of the suitable Lyapu-nov function such that the coefficients of T0 and Ti are
equal to zero. We thus obtain
Using these coefficients, the time derivative of the Lyapu-nov function can be expressed as
We can deduce that dV
dt ≤0 when Ra≤1 with equal-ity if Ra = 1. Furthermore, dV
dt = 0 if and only if U = T0 = Ti = 0. Therefore, the largest compact
invariant set in (S,U,T0,Ti)∈G such that
dV
dt = 0 when Ra≤1 is the singleton G0. By Lasalle invariance principle
[30], this implies that G0 is globally stable in G if Ra≤1. We observe that the Jacobian matrix evaluated at G0
has a positive eigenvalue whenever Ra>1. Therefore the methamphetamine-free equilibrium is unstable if Ra>1 . This completes the proof.
The methamphetamine persistent equilibrium point
In this section we determine the methamphetamine per-sistent equilibrium point by first setting the left hand side of model Eqs. (2)–(5) to zero. Some easy to follow
˙
V = aU˙ +bT0˙ +cT˙i
≤a[β(U+ηT0)+(1−ε)ρ2Ti+(1−ε)ρ1T0
−g1U] +b[(1−p)σU+γ2Ti−g2T0]
+c[pσU+γ1T0−g3Ti]
since 0≤ S
N ≤1
= [a(β−g1)+b(1−p)σ +cpσ]U
+ [a(βη+(1−ε)ρ1)−bg2+cγ1]T0
+ [a(1−ε)ρ2+bγ2−cg3]Ti.
a=g2g3−γ1γ2,
b=(βη+(1−ε)ρ1)g3+(1−ε)γ1ρ2 and c=(βη+(1−ε)ρ1)γ2+(1−ε)g2ρ2.
dV
dt ≤ g1g2g3[(1−(�1+�2+�3+�4+�5))(Ra−1)]U.
algebraic manipulations give the methamphetamine-per-sistent equilibrium G∗ = (S∗,U∗,T0∗,Ti∗) where
We thus have the following result:
Theorem 5 Model system Eqs. (234)–(5) has a unique methamphetamine-persistent equilibrium whenever
Ra>1.
The results on persistence of the model are given in [31]. For more information about persistence of dynami-cal systems, we refer the reader to [32–36].
Global stability of the methamphetamine‑persistent steady state
In this section, we prove the global stability of the meth-amphetamine-persistent steady state.
Theorem 6 Assume that γ1 = θ γ2 where
θ = pρ1 (1−p)ρ2. If
Ra>1, then the unique
methamphet-amine-persistent equilibriumG∗ of model system Eqs. (2)–
(5) is globally asymptotically stable in the interior of G.
Proof The global asymptotic stability of the meth-amphetamine-persistent steady state is proved by constructing a global Lyapunov function follow-ing [37]. We propose the following Lyapunov func-tion obtained from a suitable combinafunc-tion of com-mon quadratic and Volterra-type functions. Define
V: {(S,U,T0,Ti)∈G: S,U,T0,Ti>0} →R by
This function is defined, continuous and posi-tive definite for all S,U,T0,Ti >0. We also observe
that V(S,U,T0,Ti) = 0 at the steady state G∗. Since (7)
S∗ = A�
Aµ+�(Ra−1),
U∗ = �g2g3(1−�1)(Ra−1)
(pσ γ2+g3(1−p)σ )(Aµ+�(Ra−1)) ,
T∗
0 =
�(Ra−1)
Aµ+�(Ra−1)
,
Ti∗ = �(Ra−1)[pσg2g3(1−�1)+γ1(pσ γ2+g3(1−p)σ )] g3(pσ γ2+g3(1−p)σ )(Aµ+�(Ra−1))
.
V = (S−S ∗)2
2S∗ +
U−U∗−U∗ln U
U∗
+(1−ε)ρ1
(1−p)σ
T∗
0
U∗
T0−T0∗−T0∗ln T0
T∗
0
+(1−ε)ρ2
pσ
Ti∗
U∗
Ti−Ti∗−T
∗ i ln
Ti
Ti∗
G∗ = (S∗,U∗,T0∗,Ti∗) is an endemic steady state point of model system Eqs. (2)–(5), we have
Computing the time derivative of V(S,U,T0,Ti) along
the solution of model system Eqs. (2)–(5), we obtain
Using model system Eqs. (2)–(5) and (8), it can be easily shown that
(8) � = ∗S∗+µS∗,
g1 = ∗
S∗
U∗ +(1−ε)ρ2 Ti∗
U∗+(1−ε)ρ1 T0∗ U∗,
g2 = (1−p)σU
∗
T0∗ +γ2 Ti∗ T0∗,
g3 = pσ
U∗ Ti∗ +γ1
T0∗
Ti∗.
(9) ˙
V =
S−S∗ S∗
˙ S+
U−U∗ U
˙ U
+(1−ε)ρ1
(1−p)σ
T0∗ U∗
T0−T0∗
T0
˙ T0
+(1−ε)ρ2 pσ
Ti∗ U∗
Ti−Ti∗
Ti
˙ Ti.
(10)
S−S∗
S∗
˙
S =
S−S∗
S∗
(�−S−µS)
= −βU(S−S ∗)2
S∗
−βηT0(S−S ∗)2
S∗ −µ
(S−S∗)2 S∗ −β(S−S∗)(U−U∗) −βη(S−S∗)(T0−T0∗).
Similarly, using model system Eqs. (2)–(5) and (8), we can also show that
We also have
and
(11) U−U∗
U∗
˙
U = (U−U∗)
×
β(S−S∗)+βη T
0S
U − T0∗S∗
U∗
+(1−ε)ρ1
T
0
U − T0∗
U∗
+(U−U∗)
(1−ε)ρ2
T i
U − Ti∗
U∗
.
(12) (1−ε)ρ1
(1−p)σ T0∗
U∗
T 0−T0∗
T0 ˙ T0 = T ∗ 0
U∗(T0−T ∗ 0)
(1−ε)ρ1 U
T0 − U
∗
T0∗
+ T ∗ 0
U∗(T0−T ∗ 0)
(1−ε)ρ1 (1−p)σ γ2
T i T0−
Ti∗
T0∗
.
(13) (1−ε)ρ2
pσ Ti∗
U∗
T i−Ti∗
Ti ˙ Ti = T ∗ i
U∗(Ti−T ∗
i)
(1−ε)ρ2 U
Ti − U∗
Ti∗
+ T ∗
i
U∗(Ti−T ∗
i)
(1−ε)ρ2 pσ γ1
T 0 Ti −T ∗ 0 Ti∗
Adding expressions (10), (11), (12) and (13) gives
where
We observe from expression (14) that (Figs. 9, 10)
only if S = S∗, U = U∗ and T0 = T0. Thus we ∗ can deduce that, V(S,U˙,T0,T
i) is negative definite if
(14) ˙
V=
�S−S∗
S∗ �
˙ S+
�U−U∗
U �
˙
U+(1−ε)ρ1 (1−p)σ
T∗
0
U∗ �T
0−T0∗
T0 �
˙
T0+ (1−ε)ρ2 pσ
Ti∗
U∗ �T
i−Ti∗ Ti
� ˙ Ti
=A0−βη(S−S∗)(T0−T∗
0)+βη(U−U
∗) �T 0S U − T∗ 0S ∗ U∗ �
+(1−ε)ρ1(U−U∗) �T 0 U − T∗ 0 U∗ � + T ∗ 0
U∗(1−ε)ρ1(T0−T ∗
0) �U
T0− U∗
T∗
0 �
+(1−ε)ρ2(U−U∗) �T
i
U −
Ti∗
U∗ �
+(1−ε)ρ2
Ti∗
U∗(Ti−T ∗ i ) �U Ti −U ∗
Ti∗ �
+(1−ε)ρ1γ2 (1−p)σ
T∗
0
U∗(T0−T ∗
0) �T
i T0−
Ti∗
T∗
0 �
+(1−ε)ρ2γ1 pσ
Ti∗
U∗(Ti−T ∗ i) �T 0 Ti − T∗ 0
Ti∗ �
=A0+βη �
ST∗
0+S
∗T
0−T0∗S
∗ U U∗ −T0S
U∗
U �
+(1−ε)ρ1T0∗ �T
0
T∗
0
− U U∗ −
T0
T∗
0
U∗
U +1
�
+(1−ε)ρ1T0∗ �U
U∗ − T0 T∗ 0 − T ∗ 0 T0 U
U∗+1 �
+(1−ε)ρ2Ti∗ �Ti
Ti∗ − U
U∗ − Ti
Ti∗ U∗
U +1
�
+(1−ε)ρ2Ti∗ �U
U∗ − Ti
Ti∗− Ti∗
Ti U
U∗+1 �
+(1−ε)ρ1γ2 (1−p)σ
T∗
0Ti∗ U∗
�T i Ti∗−
T0 T∗ 0 −T ∗ 0 T0 Ti
Ti∗+1 �
+ (1−ε)ρ2γ1 pσ
T∗
0Ti∗ U∗
�T 0
T∗
0
− Ti Ti∗ −
T0
T∗
0
Ti∗
Ti +1 �
=A0+βηS∗T0 �
1+ S
S∗ T∗
0
T0 − T∗
0
T0 U
U∗− S
S∗ U∗
U �
+(1−ε)ρ1T0∗ �
2−U
∗ U T0 T∗ 0 − U U∗ T∗ 0 T0 �
+(1−ε)ρ2Ti∗ �
2−U
∗
U Ti
Ti∗− U
U∗ Ti∗
Ti �
+(1−ε)ρ2γ1 pσ
T∗
0Ti∗ U∗
�
2− T
∗
0
T0 Ti
Ti∗ − T0
T∗
0
Ti∗
Ti �
(since γ1 = θ γ2)
=A0−βηS∗T0 � 3− �S S∗ T∗ 0
T0 + T0 T∗ 0 U∗ U + S∗ S U U∗ ��
−βηS∗T0 � T∗ 0 T0 U
U∗ − � T0 T∗ 0 U∗ U 2
−βηS∗T0 �� S S∗ U∗ U − � S∗ S U U∗ �2
−(1−ε)ρ1T0∗ � T0 T∗ 0 U∗ U − � T∗ 0 T0 U U∗ 2
−(1−ε)ρ2Ti∗
�
Ti
Ti∗ U∗
U −
� Ti∗
Ti U U∗ 2
−(1−ε)ρ2γ1 pσ T∗ 0T ∗ i U∗ �� T∗ 0 T0 Ti
Ti∗ − �
T0
T∗
0
Ti∗
Ti �2
,
A0 = −βU(S−S
∗)2
S∗ −βηT0
(S−S∗)2
S∗ −µ
(S−S∗)2
S∗ ≤0.
S S∗
T0∗ T0 +
T0 T0∗
U∗ U + S∗ S U U∗ = 3
and V(S,U˙,T0,Ti) = 0 only if S = S∗, U = U∗,
T0 = T∗
0 and Ti = Ti∗. Therefore, the larg-est compact invariant set in {(S,U,T0,Ti)∈G:
˙
V(S,U,T0,Ti) = 0} is the singleton {G∗}. By LaSalle’s
Invariance Principle [30], we conclude that G∗ is globally
asymptotically stable in the interior of G. This completes
the proof.
S S∗
T0∗ T0 +
T0 T0∗
Results and discussion
Numerical simulations
Data
In this section we present an application of our model through fitting the model data on rehabilitation from the Medical Research Council’s (MRC’s), South Afri-can Community Epidemiology Network on Drug Use (SACENDU) project [40]. We fit the model system Eqs.
(2)–(5) to data for individuals under inpatient and outpa-tient rehabilitation in Cape Town. We use data in Table 1
which was collected by the SACENDU for individuals who were admitted on inpatient and outpatient forms of rehabilitation in Cape Town.
While inpatient and outpatient rehabilitation programs may have similar components, they can have very differ-ent long-term outcomes and success rates. Statistics on success rate of substance abuse rehabilitation programs vary widely [39] and depend on a variety of factors, such as, the extent and nature of the patient’s problems, the appropriateness of treatment and related services used to address those problems, and the quality of interaction between the patient and his or her treatment providers.
Parameter estimation
We make use of Matlab programming language to esti-mate model parameters used in our numerical simulations and to analyze existing trends on inpatient and outpatient forms of rehabilitation. The model parameters that we use for numerical simulations are in Table 2. We make use of curve fitting, which is a process that allows us to quanti-tatively estimate the trend of the outcomes. The curve fit-ting process fits equations of approximafit-ting curves to the raw field data. Nevertheless, for a given set of data, the fit-ting curves of a given type are generally not unique. Thus, a curve with a minimal deviation from all data points is desired. This best-fitting curve can be obtained by the method of least squares. The least squares curve fit routine (lsqcurvefit) in Matlab with optimization is used to esti-mate the parameter values. Many parameters are known to lie within some intervals. During the estimation of parameter values, a Matlab code is used where unknown parameter values are given a lower and upper bound from which the set of parameter values that provide the best fit are obtained. The intervals used and a few parameters obtained from literature are given in Table 2.
Conclusions
In this paper, we designed a model that incorporates inpatient and outpatient rehabilitation of methampheta-mine addicts to study the dynamics of methamphetamethampheta-mine abuse in Cape Town of South Africa. The reproduction number was derived and qualitatively used to investigate the stability of equilibrium states and the prevalence of methamphetamine abuse. The methamphetamine-free equilibrium point is shown to be globally asymptoti-cally stable whenever the reproduction number is less than unity. Thus, methamphetamine abuse can be elimi-nated if control strategies are put in place and efforts are directed toward reducing the threshold number to a value less than unity. With the aid of a Lyapunov func-tion obtained from a suitable combinafunc-tion of common 20000 2002 2004 2006 2008 2010 2012 2014 2016 2018
0.1 0.2 0.3 0.4 0.5 0.6 0.7
Time in years
Proportion of drug users in outpatient rehab
Fig. 9 Model system Eqs. (2)–(5) fitted to data for individuals under outpatient rehabilitation in Cape Town and projected for five more years. The blue circles indicate the actual data and the solid red line
indicates the model fit to the data. The proportion of patients admit-ted under outpatient rehabilitation facilities in Cape Town is likely to continue increasing for the next five years, see also Fig. 6. The percentages are not of all users, but of those in rehabilitation
2000 2002 2004 2006 2008 2010 2012 2014 2016 2018 0.08
0.1 0.12 0.14 0.16 0.18 0.2 0.22
Time in years
Incidence (%
[image:10.595.58.290.87.271.2])
[image:10.595.57.291.352.542.2]quadratic and Volterra-type functions, the metham-phetamine-persistent steady state has been shown to be globally asymptotically stable whenever the reproduction number is greater than unity.
The least squares curve fit routine (lsqcurvefit) in Mat-lab with optimization has been used to fit the model to data on inpatient and outpatient rehabilitants with the objective of using the model parameters that give the best fit to obtain the incidence curve. We also used the parameter values that give the best fit to plot a graph of the ratio of inpatients to outpatients and as well predict future proportions of inpatient and outpatient rehabili-tants. The results suggest that the proportion of patients admitted under inpatient rehabilitation facilities in Cape
Town will continue to decrease for the next five years whereas that for outpatient rehabilitants will increase for the next five years. The estimated proportion of inpa-tient rehabilitants in specialist treatment centres of Cape Town was observed to be approximately 31 % by the year 2018. Our estimated incidence of methamphetamine abuse related to data on inpatient and outpatient reha-bilitants was observed to be generally decreasing over the years. However, it was noted that the estimated incidence for methamphetamine abuse related to data on inpatient rehabilitants had a sharp decrease as compared to that of outpatient rehabilitants, suggesting that inpatient rehabil-itation programs have an increased potential of positively changing the lives of many methamphetamine addicts. Table 1 Treatment type received for the period 1999a to 2013a (%)
Letter ‘a’ represents the first 6 months of the year and ‘b’ represents the last 6 months of the year
Year 1999a 1999b 2000a 2000b 2001a 2001b 2002a 2002b
Inpatient (%) 69 66 66 68 66 65 58 62
Outpatient (%) 27 32 34 32 34 35 42 38
Year 2003a 2003b 2004a 2004b 2005a 2005b 2006a 2006b
Inpatient (%) 67 64 68 66 61 48 61 57
Outpatient (%) 33 36 32 34 39 52 39 43
Year 2007a 2007b 2008a 2008b 2009a 2009b 2010a 2010b
Inpatient (%) 59 53 64 48 39 42 44 44
Outpatient (%) 41 47 36 52 61 58 56 56
Year 2011a 2011b 2012a 2012b 2013a
Inpatient (%) 34 41 28 37 39
Outpatient (%) 66 59 72 63 61
Table 2 Parameter values and ranges obtained from data fitting
MA methamphetamine
Description Range Value Source
β The effective contact rate between users and susceptibles 0.10–0.21 0.105 year−1 [15]
η The relative ability for outpatients to initiate new users 0–0.0099 0.009612 year−1 Estimated
p Proportion of users recruited into inpatient rehab 0–1 0.352 year−1 Estimated
ε The effectiveness of rehab 0–1 0.6080 year−1 Estimated
σ The rate at which users are recruited into rehab 0–0.05024 0.02827 year−1 Estimated
δ0 The rate of quitting abuse for outpatients 0.001–1 0.01 year−1 Estimated
δ1 The rate of quitting abuse for inpatients 0.01–1 0.3142 year−1 Estimated
ρ1 Relapse rate for outpatients 0–0.054 0.0382 year−1 Estimated
ρ2 Relapse rate for inpatients 0–0.0235 0.0020 year−1 Estimated
γ1 Transfer rate from outpatient rehab to inpatient rehab 0–0.06012 0.02961 year−1 Estimated
γ2 Transfer rate from inpatient rehab to outpatient rehab 0–0.008 0.003 year−1 Estimated
Recruitment rate into the susceptible population 0.028–0.080 0.04 year−1 [15]
[image:11.595.58.547.102.281.2] [image:11.595.55.545.326.519.2]The projections carried out show that the estimated inci-dence for methamphetamine abuse related to data on inpatient rehabilitants will have decreased down to below 7 % by the year 2018 and that of outpatient rehabilitants will have decreased to below 11.5 % by the year 2018. The
study presented here is not exhaustive, it can be extended to include stratification of the population according to levels of methamphetamine use. Structuring the popula-tion in such a way would give some other helpful insights in studying the dynamics of methamphetamine abuse. In addition, the model did not take into account contex-tual dynamics, such as drug supply chains or changes in interdiction. Incorporating these processes will undoubt-edly facilitate in the understanding of methamphetamine dynamics. Also, since the study focuses specifically on methamphetamine abuse, the model dynamics may also be affected by the availability and use of other drugs.
Abbreviations
SUD: Substance use disorder; DOSD: Department of Social Development; MRC: Medical Research Council; SACENDU: South African Community Epide-miology Network on Drug Use; MA: methamphetamine.
Authors’ contributions
JM participated in formulating the model, and carried out the stability analysis of the model steady states, and performed the numerical analysis and drafted the manuscript. FN conceived of the study, and participated in model formu-lation and helped to draft the manuscript. AGRS participated in the stability analysis of the endemic equilibria and numerical analysis. All authors read and approved the final manuscript.
Authors’ information
This work will be part of JM’s Doctor of Philosophy thesis.
Author details
1 Department of Mathematics, University of Zimbabwe, Box MP 167, Mount
Pleasant, Harare, Zimbabwe. 2 Department of Mathematical Sciences,
Stel-lenbosch University, P. Bag X1, Matieland 7602, South Africa.
Acknowledgements
The authors would like to thank an anonymous referee for many valuable comments and helpful suggestions. J. Mushanyu and A. G. R. Stewart authors acknowledge, with thanks, the support of the Department of Mathematics, University of Zimbabwe. The F. Nyabadza author acknowledges with gratitude the support from National Research Foundation and Stellenbosch University for the production of this manuscript.
Competing interests
The authors declare that they have no competing interests.
Received: 18 May 2015 Accepted: 25 November 2015
References
1. The Naked Truth (TNT). 2010. http://www.tnt.org.za.
2. Myers B, Louw J, Fakier N. Alcohol and drug abuse: removing structural barriers to treatment for historically disadvantaged communities in Cape Town. Int J Soc Welf. 2008;17:156–65.
3. Anderson RM, May RM. Infectious diseases in humans: dynamics and control. Oxford: Oxford University Press; 1991.
4. Hethcote HW. The mathematics of infectious diseases’. Soc Ind Appl Maths Rev. 2000;42:599.
5. Brauer F, van den Driessche P, Wu J. Mathematical epidemiology. Lecture notes in mathematics. Mathematical biosciences subseries; 2008. pp. 1945.
6. Buonomo B, Lacitignola D. Modeling peer influence effects on the spread of high risk alcohol consumption behavior. Ricerche di Matematica. 2014;63:101–17.
7. Bissell JJ, Caiado CCS, Goldstein M, Straughan B. Compartmental model-ling of social dynamics with generalised peer incidence. Math Models Methods Appl Sci. 2014;24:719–50.
8. Manthey JL, Aidoob A, Ward KY. Campus drinking: an epidemiological model. J Biol Dyn. 2008;2:346356.
9. Do TS, Lee YS. A differential equation model for the dynamics of youth gambling. Osong Public Health Res Perspect. 2014;5:19.
10. Benedict B. Modeling alcoholism as a contagious disease: how infected drinking buddies spread problem drinking. SIAM News. 2007:40. 11. Snchez F, Wang X, Castillo-Chvez C, Gorman DM, Gruenewald PJ. Drinking
as an epidemic: a simple mathematical model with recovery and relapse. Therapists guide to evidence-based relapse prevention. New York: Aca-demic Press; 2007.
12. De Alarcon R. The spread of a heroin abuse in a community. Bull Narc. 1969;21:17–22.
13. Hunt LG, Chambers CD. The heroin epidemics. New York: Spectrum Publications Incorporated; 1976.
14. Mackintosh DR, Stewart GT. A mathematical model of a heroin epi-demic: implications for control policies. J Epidemiol Commun Health. 1979;33:299–304.
15. Nyabadza F, Hove-Musekwa SD. From heroin epidemics to metham-phetamine epidemics: modelling substance abuse in a South African province. Math Biosci. 2010;225:132–40.
16. Behrens DA, Caulkins JP, Tragler G, Haunschmied JL, Feichtinge G. A dynamic model of drug initiation: implications for treatment and drug control. Math Biosci. 1999;159:1–20.
17. Behrens DA, Caulkins JP, Tragler G, Feichtinger G. Optimal control of drug epidemics: prevent and treatbut not at the same time? Manag Sci. 2000;46:333–47.
18. Billard L, Dayananda PWA. Drug addiction-pusher generated from addicts. Biomed J. 1993;35:227–44.
19. Cross Roads Recovery Centre, Pretoria, South Africa. 2013. http://www. crossroadsrecovery.co.za.
20. Greater Toronto Area (GTA) Rehab Network. http://www.gtarehabnet-work.ca.
21. Nyabadza F, Njagarah JBH. Smith RJ? Modelling the dynamics of crystal meth (tik) abuse in the presence of drug- supply chains in South Africa. Bull Math Biol. 2012. doi:10.1007/s11538-012-9790-5.
22. Birkhoff G, Rota G. Ordinary differential equations. Needham Heights Ginn. 1982;39:251–7.
23. Driessche P, Watmough J. Reproduction numbers and sub-threshold endemic equilibria for the compartmental models of disease transmis-sion. Math Biosci. 1999;180:29–48.
24. Kodaira JY, de Souza Passos JR. The basic reproduction number in SI staged progression model: a probabilistic approach. In: Dynamics days South America; International Conference on Chaos and Nonlinear Dynamics; 2010.
25. Driessche P, Zou X. Modeling relapse in infectious diseases. Math Biosci. 2007;207:89103.
26. Hsier YH, Wang YS. Basic reproduction number for HIV model incor-porating commercial sex and behavior change. Bull Math Biol. 2006;68:551–75.
27. Mastroberardino T. Mathematical modeling of the HIV/AIDS epidemic in Cuba. AMS Eastern Sectional Meeting University of Maryland/Baltimore County; 2014.
28. Feng Z, Castillo-Chavez C. A model for tuberculosis with exogenous reinfection. Theor Popul Biol. 2000;57:235–47.
29. Capistrna MA, Morelesa MA, Larab B. Parameter estimation of some epidemic models. The case of recurrent epidemics caused by respiratory syncytial virus. Bull Math Biol. 2009. doi:10.1007/s11538-009-9429-3. 30. LaSalle JP. The stability of dynamical systems. Society for industrial and
31. Njagarah JBH, Nyabadza F. Modelling the impact of rehabilitation, amelioration and relapse on the prevalence of drug epidemics. J Biol Syst. 2013;21.
32. Magal P. Perturbation of a globally stable and uniform persistence. J Dyn Differ Equ. 2009;21:1–20.
33. Thieme HR. Uniform persistence and permanence for non-autonomous semi-flows in population biology. Math Biosci. 2000;166:173–201. 34. Butler G, Waltman P. Persistence in dynamical systems. J Diff Equ.
1986;63:255–63.
35. Freedman HI, Ruan S. Uniform persistence functional differential equa-tions. J Differ Equ. 1995;115:173–92.
36. Freedman HI, Ruan S, Tang M. Uniform persistence and flows near a closed positive set. J Dyn Differ Equ. 1994;6:583–600.
37. Cruz VDL. On the global stability of infectious disease model with relapse. Abst Appl. 2013;9:50–61.
38. Pluddemann A, Parry CDH, Cerff P, Bhana A, Sanca PE, Potgeiter H, Gerber W, Mohamed F, Petersen P, Carney T. The South African community epide-miology network on drug use (SACENDU). phase 22 SACENDU Research Brief. 2007;10.
39. Crystal meth addiction and holistic drug rehab. http://www.drugre-habadvisor.com.
40. The South African Community Epidemiology Network on Drug Use (SACENDU). http://www.mrc.ac.za/adarg/sacendu.html.
41. Jamison DT, Feachmen RG, Makgoba MW, Bos ER, Baingana FK, Hofman KJ, Rogo KO. Disease and mortality in sub-saharan Africa, 2nd edn. Wash-ington D.C.: World Bank; 2006.
• We accept pre-submission inquiries
• Our selector tool helps you to find the most relevant journal • We provide round the clock customer support
• Convenient online submission • Thorough peer review
• Inclusion in PubMed and all major indexing services • Maximum visibility for your research
Submit your manuscript at www.biomedcentral.com/submit