R E S E A R C H A R T I C L E
Open Access
Impact of breast cancer subtypes on 3-year
survival among adolescent and young adult
women
Theresa H M Keegan
1,2*, David J Press
1, Li Tao
1, Mindy C DeRouen
1, Allison W Kurian
2,3, Christina A Clarke
1,2and Scarlett L Gomez
1,2Abstract
Introduction:Young women have poorer survival after breast cancer than do older women. It is unclear whether this survival difference relates to the unique distribution of hormone receptor (HR) and human epidermal growth factor receptor 2 (HER2)-defined molecular breast cancer subtypes among adolescent and young adult (AYA) women aged 15 to 39 years. The purpose of our study was to examine associations between breast cancer subtypes and short-term survival in AYA women, as well as to determine whether the distinct molecular subtype distribution among AYA women explains the unfavorable overall breast cancer survival statistics reported for AYA women compared with older women.
Methods:Data for 5,331 AYA breast cancers diagnosed between 2005 and 2009 were obtained from the California Cancer Registry. Survival by subtype (triple-negative; HR+/HER2-; HR+/HER2+; HR-/HER2+) and age-group (AYA versus 40- to 64-year-olds) was analyzed with Cox proportional hazards regression with follow-up through 2010.
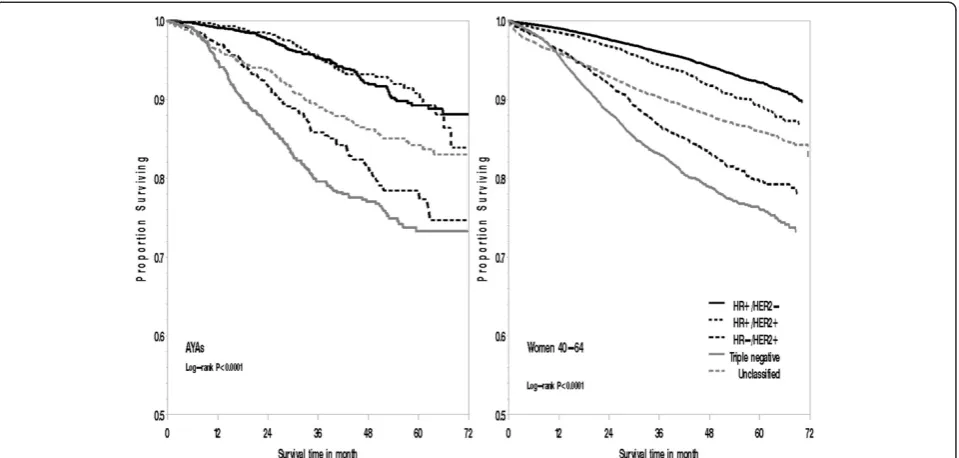
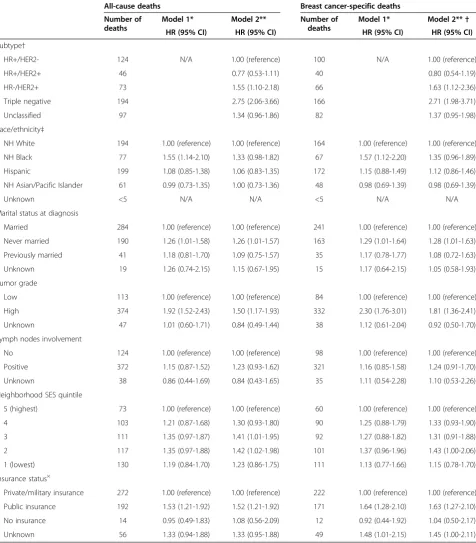
Results:With up to 6 years of follow-up and a mean survival time of 3.1 years (SD = 1.5 years), AYA women diagnosed with HR-/HER + and triple-negative breast cancer experienced a 1.6-fold and 2.7-fold increased risk of death, respectively, from all causes (HR-/HER + hazard ratio: 1.55; 95% confidence interval (CI): 1.10 to 2.18; triple-negative HR: 2.75; 95% CI, 2.06 to 3.66) and breast cancer (HR-/HER + hazard ratio: 1.63; 95% CI, 1.12 to 2.36; triple-negative hazard ratio: 2.71; 95% CI, 1.98 to 3.71) than AYA women with HR+/HER2- breast cancer. AYA women who resided in lower socioeconomic status neighborhoods, had public health insurance, and were of Black, compared with White, race/ethnicity experienced worse survival. This race/ethnicity association was attenuated somewhat after adjusting for breast cancer subtypes (hazard ratio, 1.33; 95% CI, 0.98 to 1.82). AYA women had similar all-cause and breast cancer-specific short-term survival as older women for all breast cancer subtypes and across all stages of disease.
Conclusions:Among AYA women with breast cancer, short-term survival varied by breast cancer subtypes, with the distribution of breast cancer subtypes explaining some of the poorer survival observed among Black, compared with White, AYA women. Future studies should consider whether distribution of breast cancer subtypes and other factors, including differential receipt of treatment regimens, influences long-term survival in young compared with older women.
* Correspondence:theresa.keegan@cpic.org 1
Cancer Prevention Institute of California, 2201 Walnut Ave, Suite 300, Fremont, CA 94538, USA
2
Division of Epidemiology, Department of Health Research and Policy, Stanford University School of Medicine, Stanford, CA 94305-5405, USA Full list of author information is available at the end of the article
Introduction
Breast cancer is the most frequently diagnosed cancer among adolescent and young adult (AYA) women be-tween 15 and 39 years of age, accounting for 14% of all AYA cancer diagnoses [1] and 7% of all breast cancer diagnoses [1,2]. Breast cancers are now recognized as heterogeneous, based on tumor expression of receptors for estrogen (ER), progesterone (PR)—referred to jointly as hormone receptor (HR)—and human epidermal growth factor receptor 2 (HER2) [3-5]. We recently re-ported that AYA breast cancer incidence differs from that in older women, with AYAs having higher propor-tions of HR+/HER2+, triple-negative, and HR-/HER2+ breast cancer subtypes and higher proportions of pa-tients of non-White race/ethnicity than older women [6]. Compared with older women, AYAs also were more likely to be diagnosed with stage III/IV disease and high-grade tumors [6].
Several recent studies suggest that young age is an inde-pendent predictor of poorer survival after breast cancer, even after adjustment for sociodemographic and tumor characteristics [7-14]. The HR+/HER2+ (Luminal B), triple-negative, and HR-/HER2+ subtypes, found in higher proportions among AYAs [6], generally are associated with worse survival than the HR+/HER2- (Luminal A) subtype [15,16], which could explain the overall poor prognosis reported for AYA breast cancer patients. However, only two, small institutionally based studies have examined the extent to which differences in the distributions of breast cancer subtypes explain the lower survival among AYA patients. A 1989 through 2009 hospital-based study in Ireland did not find over-all survival differences between AYAs (n= 276) and older women when they adjusted for ER, PR, and HER2 status, although HER2 status was only 40% complete, and these three tumor markers were adjusted for separately in the analyses [17]. Conversely, an Italian, institution-based study found worse survival in women <35 years of age (n= 315) compared with older women (35 to 50 years of age) for triple-negative, Luminal B, and HER2-positive breast cancer, but not Luminal A breast cancer [14]. To our knowledge, no previous population-based study in the United States has considered survival by molecular breast cancer subtypes among AYAs.
Therefore, by using population-based data from California enriched with subtype information and pa-tient sociodemographic data, we examined associa-tions between breast cancer subtypes and short-term overall and breast cancer-specific survival in AYAs. Additionally, we sought to determine whether the dis-tinct molecular-subtype distribution among AYAs [6] could explain the unfavorable overall breast cancer survival statistics reported for AYAs compared with older women.
Methods
Cancer cases
We obtained data from the California Cancer Registry (CCR), which contributes approximately half of the data in the National Cancer Institute’s Surveillance, Epidemiology, and End Results (SEER) program and is estimated to include more than 99% of all invasive cancers diag-nosed in California. We included in our analysis all female California residents diagnosed with invasive breast cancer (International Classification of Disease for Oncology, 3rd Edition, (ICD-O-3) site codes C50.0-50.9) during the period January 1, 2005, through December 31, 2009. Ethics approval for human-subjects research was obtained from the California Prevention Institute of California Institutional Review Board. As the analysis was based on state-mandated cancer registry data, the study was conducted in accordance with the waivers of individual informed consent and HIPPA authorization. For each breast cancer case, we obtained cancer registry information routinely abstracted from the medical rec-ord [18] on age at diagnosis, race/ethnicity (Hispanic, Hispanic White, Hispanic Black, and non-Hispanic Asian/Pacific Islander, hereafter referred to as
“White”, “Black”, “Hispanic”, and “Asian”), marital sta-tus, American Joint Committee on Cancer (AJCC) stage at diagnosis, tumor grade (low (I/II), high (III/IV)), tumor size, lymph node involvement, metastasis status, and ER, PR, and HER2 tumor-expression status. The CCR has collected information on ER and PR since 1990 and on HER2 since 1999 [19]. ER and PR were evaluated with dextran-coated charcoal assays or immu-nohistochemistry (IHC); HER2 was tested with IHC or fluorescence in situhybridization. The markers were corded as positive, negative, borderline, not tested, not re-corded, or unknown, on the basis of pathology or medical record information at the reporting facility [20].
Before 2005, treatments driving pathologic testing for HER2 were indicated for late-stage breast cancer only; thus data completeness was low, only 59%; since then, data completeness has increased to at least 83%. Because of this data completeness, we limited our analyses to cases diagnosed between 2005 and 2009.
We also obtained registry information on initial course of treatment (surgery, chemotherapy, and radiation ther-apy), primary source of payment to the hospital at the time of initial diagnosis and/or treatment (health insur-ance), census-block group of residence at diagnosis, and vital status (routinely determined by the CCR through hospital follow-up and database linkages, including the Social Security Administration) as of December 31, 2010, and, for the deceased, the underlying cause of death.
measure of neighborhood SES based on patient address at time of diagnosis that incorporates 2000 Census block group on education, occupation, unemployment, household income, and poverty [21]. Each cancer case was then assigned to a neighborhood SES quintile based on the distribution of SES across all census block groups in California. Health insurance was grouped into public insurance (Medicaid and other government-assisted programs), private insurance (health maintenance organizations, preferred provider organizations, managed care not otherwise specified, and military care), no insur-ance, and insurance status unknown [22].
Of the 6,463 California females diagnosed with breast cancer between 15 and 39 years of age and between 2005 and 2009, we excluded cases with in situ breast cancer (n= 752), Paget disease (n< 5), mammographic or xerographic diagnosis only, or no mass found (n= 12), breast cancer as a non-first primary (n= 364), and autopsy or death certificate only (n< 5). The resulting study popu-lation included 5,331 AYA patients. For analyses compar-ing AYAs with older women, we followed the same inclusion criteria, which resulted in 53,860 women from 40 to 64 years of age.
Categorization of breast cancer subtypes
Breast cancer subtypes were categorized according to tumor expression of ER, PR, and HER2. HR+/HER2-was defined as ER or PR positive and HER2 negative; HR+/HER2+ as ER or PR positive and HER2 positive; HR-/HER2+ as ER and PR negative and HER2 positive; and triple-negative as ER, PR, and HER2 negative [3-5]. Participants who had missing or borderline ER and PR or HER2 and could not be defined in these four categor-ies were considered unclassified (Table 1).
Statistical analyses
To evaluate differences in survival by breast cancer sub-types, we conducted survival analyses with Cox propor-tional hazards regression to estimate hazard ratios and associated 95% confidence intervals (95% CIs). For de-ceased patients, survival time was measured in days from the date of diagnosis to the date of death from any cause for overall survival or to the date of death from breast cancer for breast cancer-specific survival. Patients who died of other causes were censored at the time of death for analyses of breast cancer-specific survival. Pa-tients alive at the study end date (December 31, 2010) were censored at this time or at date of last follow-up (that is, last known contact); 96% of censored patients had a follow-up date within 2 years of the study end date.
The proportional hazards assumption was examined by statistical testing of the correlation between weighted Schoenfeld residuals and logarithmically transformed
survival time. No violations of the assumption were ob-served. Multivariate Cox regression models included cancer registry variables significant atP< 0.05 in univari-ate models (age at diagnosis, subtype, race/ethnicity, marital status, tumor grade, lymph node involvement, tumor size, neighborhood SES, health insurance status, surgery, and radiation therapy) or with a priori hypoth-eses for inclusion (for example, chemotherapy). Models were conducted with and without breast cancer subtype, and AJCC stage was included as a stratifying variable. Effect modification between breast cancer subtypes and race/ethnicity, tumor grade, lymph node involvement, neighborhood SES, and health insurance status was assessed by including an interaction term in the multi-variable model; a significant interaction (P< 0.05) was found between subtype and tumor grade. Hazard ratio and 95% CI estimates for comparing AYAs with women 40 to 64 years of age were presented by stage of diagno-sis for comparison with prior studies [1,8]. Analyses were carried out by using SAS software version 9.3 (SAS Institute, Cary, NC, USA). All P values reported are two-sided, and those that were <0.05 were considered to be statistically significant.
Results
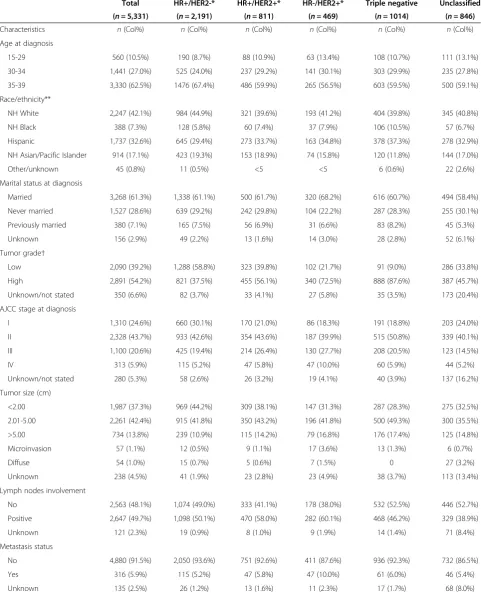
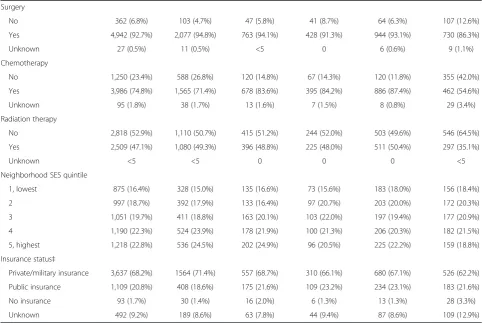
HR+/HER2- was the most commonly diagnosed subtype (41.1%) among AYA breast cancer patients, followed by triple-negative (19.0%), HR+/HER2+ (15.2%), and HR-/HER2+ (8.8%) (Table 1). In this California cohort, most AYA patients were of White (42.1%) or Hispanic (32.6%) race/ethnicity; 62.5% of AYAs were diagnosed between 35 and 39 years of age. The highest proportion of stage III/IV disease occurred for the HR+/HER2+ and HR-/HER2+ subtypes, and the highest proportion of high-grade disease occurred for the HR-/HER2+ and triple-negative subtypes. The proportion of AYA patients who received chemotherapy ranged from 71.4% for HR+/HER2- to 87.4% for triple-negative subtypes; the proportions of AYAs who received surgery or radi-ation were similar across subtypes.
Table 1 Demographic and clinical characteristics for adolescents and young adults (15 to 39 years of age) with breast cancer by subtype*, California, 2005 through 2009
Total HR+/HER2-* HR+/HER2+* HR-/HER2+* Triple negative Unclassified
(n= 5,331) (n= 2,191) (n= 811) (n= 469) (n= 1014) (n= 846)
Characteristics n(Col%) n(Col%) n(Col%) n(Col%) n(Col%) n(Col%)
Age at diagnosis
15-29 560 (10.5%) 190 (8.7%) 88 (10.9%) 63 (13.4%) 108 (10.7%) 111 (13.1%)
30-34 1,441 (27.0%) 525 (24.0%) 237 (29.2%) 141 (30.1%) 303 (29.9%) 235 (27.8%)
35-39 3,330 (62.5%) 1476 (67.4%) 486 (59.9%) 265 (56.5%) 603 (59.5%) 500 (59.1%)
Race/ethnicity**
NH White 2,247 (42.1%) 984 (44.9%) 321 (39.6%) 193 (41.2%) 404 (39.8%) 345 (40.8%)
NH Black 388 (7.3%) 128 (5.8%) 60 (7.4%) 37 (7.9%) 106 (10.5%) 57 (6.7%)
Hispanic 1,737 (32.6%) 645 (29.4%) 273 (33.7%) 163 (34.8%) 378 (37.3%) 278 (32.9%)
NH Asian/Pacific Islander 914 (17.1%) 423 (19.3%) 153 (18.9%) 74 (15.8%) 120 (11.8%) 144 (17.0%)
Other/unknown 45 (0.8%) 11 (0.5%) <5 <5 6 (0.6%) 22 (2.6%)
Marital status at diagnosis
Married 3,268 (61.3%) 1,338 (61.1%) 500 (61.7%) 320 (68.2%) 616 (60.7%) 494 (58.4%)
Never married 1,527 (28.6%) 639 (29.2%) 242 (29.8%) 104 (22.2%) 287 (28.3%) 255 (30.1%)
Previously married 380 (7.1%) 165 (7.5%) 56 (6.9%) 31 (6.6%) 83 (8.2%) 45 (5.3%)
Unknown 156 (2.9%) 49 (2.2%) 13 (1.6%) 14 (3.0%) 28 (2.8%) 52 (6.1%)
Tumor grade†
Low 2,090 (39.2%) 1,288 (58.8%) 323 (39.8%) 102 (21.7%) 91 (9.0%) 286 (33.8%)
High 2,891 (54.2%) 821 (37.5%) 455 (56.1%) 340 (72.5%) 888 (87.6%) 387 (45.7%)
Unknown/not stated 350 (6.6%) 82 (3.7%) 33 (4.1%) 27 (5.8%) 35 (3.5%) 173 (20.4%)
AJCC stage at diagnosis
I 1,310 (24.6%) 660 (30.1%) 170 (21.0%) 86 (18.3%) 191 (18.8%) 203 (24.0%)
II 2,328 (43.7%) 933 (42.6%) 354 (43.6%) 187 (39.9%) 515 (50.8%) 339 (40.1%)
III 1,100 (20.6%) 425 (19.4%) 214 (26.4%) 130 (27.7%) 208 (20.5%) 123 (14.5%)
IV 313 (5.9%) 115 (5.2%) 47 (5.8%) 47 (10.0%) 60 (5.9%) 44 (5.2%)
Unknown/not stated 280 (5.3%) 58 (2.6%) 26 (3.2%) 19 (4.1%) 40 (3.9%) 137 (16.2%)
Tumor size (cm)
<2.00 1,987 (37.3%) 969 (44.2%) 309 (38.1%) 147 (31.3%) 287 (28.3%) 275 (32.5%)
2.01-5.00 2,261 (42.4%) 915 (41.8%) 350 (43.2%) 196 (41.8%) 500 (49.3%) 300 (35.5%)
>5.00 734 (13.8%) 239 (10.9%) 115 (14.2%) 79 (16.8%) 176 (17.4%) 125 (14.8%)
Microinvasion 57 (1.1%) 12 (0.5%) 9 (1.1%) 17 (3.6%) 13 (1.3%) 6 (0.7%)
Diffuse 54 (1.0%) 15 (0.7%) 5 (0.6%) 7 (1.5%) 0 27 (3.2%)
Unknown 238 (4.5%) 41 (1.9%) 23 (2.8%) 23 (4.9%) 38 (3.7%) 113 (13.4%)
Lymph nodes involvement
No 2,563 (48.1%) 1,074 (49.0%) 333 (41.1%) 178 (38.0%) 532 (52.5%) 446 (52.7%)
Positive 2,647 (49.7%) 1,098 (50.1%) 470 (58.0%) 282 (60.1%) 468 (46.2%) 329 (38.9%)
Unknown 121 (2.3%) 19 (0.9%) 8 (1.0%) 9 (1.9%) 14 (1.4%) 71 (8.4%)
Metastasis status
No 4,880 (91.5%) 2,050 (93.6%) 751 (92.6%) 411 (87.6%) 936 (92.3%) 732 (86.5%)
Yes 316 (5.9%) 115 (5.2%) 47 (5.8%) 47 (10.0%) 61 (6.0%) 46 (5.4%)
White, AYAs. Although no longer statistically signifi-cant, Black AYAs had a 33% increased risk of death over Whites after adjustment for breast cancer subtype (hazard ratio, 1.33; 95% CI, 0.98 to 1.82). AYA patients residing in lower-SES neighborhoods generally had poorer survival than did AYAs residing in the highest SES neighborhood quintile, although not all of these as-sociations remained statistically significant after strati-fying by stage at diagnosis and adjusting for health insurance and treatment. In particular, in models with-out stage at diagnosis, health insurance, and treatment, an 86% increased risk of death was found from all causes (hazard ratio, 1.86; 95% CI, 1.32 to 2.61) and an 80% increased risk of death of breast cancer (hazard ra-tio, 1.80; 95% CI, 1.24 to 2.63) among AYAs residing in the lowest versus highest SES neighborhoods (data not shown in tables). In addition, AYA patients with public, compared with private, medical insurance also experi-enced worse survival.
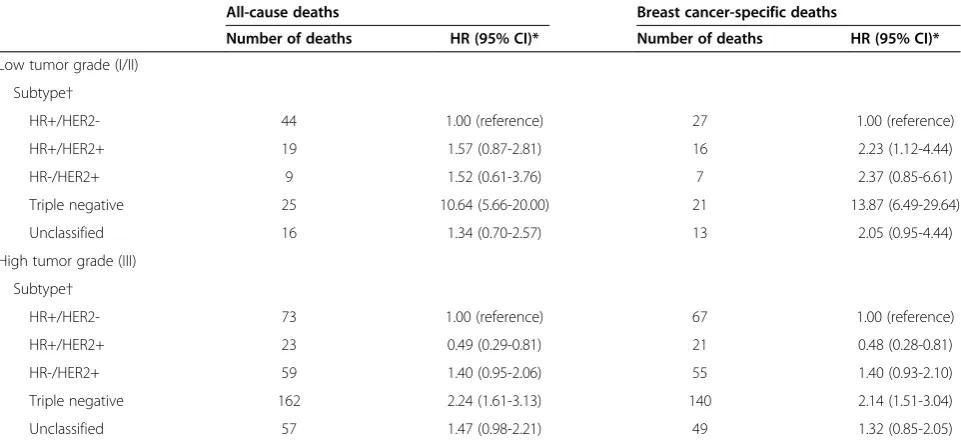
We observed an interaction (P value = 0.02 for overall survival andPvalue = 0.01 for breast cancer-specific sur-vival) between breast cancer subtype and tumor grade (Table 3). Among AYA patients diagnosed with low-grade tumors, the risk of breast cancer death was nearly 14 times higher in women with triple-negative and 2 times higher in women with HR+/HER2+ compared with HR+/HER2- breast cancer. For high-grade tumors, AYAs diagnosed with triple-negative breast cancer had more than two-fold increased risk of death, whereas AYAs diagnosed with HR+/HER2+ breast cancer experi-enced approximately half the risk of death, than did AYAs diagnosed with HR+/HER2- breast cancer.
[image:5.595.56.540.114.437.2]Overall, in models including only age group, AYA pa-tients experienced a 30% increased risk of death from all causes (hazard ratio, 1.30; 95% CI, 1.19 to 1.42) and 44% increased risk of death from breast cancer (hazard ratio, 1.44; 95% CI, 1.30 to 1.59) than women 40 to 64 years of age (data not shown in tables). Once models were
Table 1 Demographic and clinical characteristics for adolescents and young adults (15 to 39 years of age) with breast cancer by subtype*, California, 2005 through 2009(Continued)
Surgery
No 362 (6.8%) 103 (4.7%) 47 (5.8%) 41 (8.7%) 64 (6.3%) 107 (12.6%)
Yes 4,942 (92.7%) 2,077 (94.8%) 763 (94.1%) 428 (91.3%) 944 (93.1%) 730 (86.3%)
Unknown 27 (0.5%) 11 (0.5%) <5 0 6 (0.6%) 9 (1.1%)
Chemotherapy
No 1,250 (23.4%) 588 (26.8%) 120 (14.8%) 67 (14.3%) 120 (11.8%) 355 (42.0%)
Yes 3,986 (74.8%) 1,565 (71.4%) 678 (83.6%) 395 (84.2%) 886 (87.4%) 462 (54.6%)
Unknown 95 (1.8%) 38 (1.7%) 13 (1.6%) 7 (1.5%) 8 (0.8%) 29 (3.4%)
Radiation therapy
No 2,818 (52.9%) 1,110 (50.7%) 415 (51.2%) 244 (52.0%) 503 (49.6%) 546 (64.5%)
Yes 2,509 (47.1%) 1,080 (49.3%) 396 (48.8%) 225 (48.0%) 511 (50.4%) 297 (35.1%)
Unknown <5 <5 0 0 0 <5
Neighborhood SES quintile
1, lowest 875 (16.4%) 328 (15.0%) 135 (16.6%) 73 (15.6%) 183 (18.0%) 156 (18.4%)
2 997 (18.7%) 392 (17.9%) 133 (16.4%) 97 (20.7%) 203 (20.0%) 172 (20.3%)
3 1,051 (19.7%) 411 (18.8%) 163 (20.1%) 103 (22.0%) 197 (19.4%) 177 (20.9%)
4 1,190 (22.3%) 524 (23.9%) 178 (21.9%) 100 (21.3%) 206 (20.3%) 182 (21.5%)
5, highest 1,218 (22.8%) 536 (24.5%) 202 (24.9%) 96 (20.5%) 225 (22.2%) 159 (18.8%)
Insurance status‡
Private/military insurance 3,637 (68.2%) 1564 (71.4%) 557 (68.7%) 310 (66.1%) 680 (67.1%) 526 (62.2%)
Public insurance 1,109 (20.8%) 408 (18.6%) 175 (21.6%) 109 (23.2%) 234 (23.1%) 183 (21.6%)
No insurance 93 (1.7%) 30 (1.4%) 16 (2.0%) 6 (1.3%) 13 (1.3%) 28 (3.3%)
Unknown 492 (9.2%) 189 (8.6%) 63 (7.8%) 44 (9.4%) 87 (8.6%) 109 (12.9%)
* Human epidermal growth factor receptor 2 (HER2), hormone receptor (HR), triple-negative (estrogen-receptor negative, progesterone-receptor negative, HER2-negative). ** Non-Hispanic.
†Low grade was defined as tumor grade I and II; high grade was defined as tumor grade III.
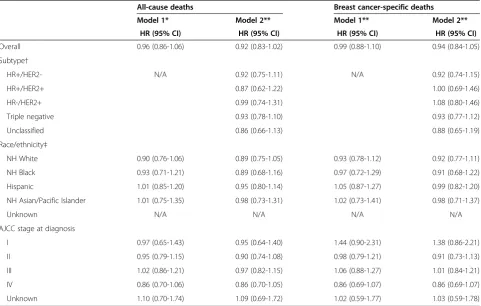
stratified by stage at diagnosis, AYAs had similar short-term all-cause (hazard ratio, 0.99; 95% CI, 0.90 to 1.08) and breast cancer-specific survival (hazard ratio, 1.05; 95% CI, 0.96 to 1.16) to women 40 to 64 years of age (data not shown in tables). Further adjustment for other factors and breast cancer subtype did not appreciably change these associations (all-cause survival hazard ra-tio, 0.92; 95% CI, 0.83 to 1.02; breast cancer-specific sur-vival hazard ratio, 0.94; 95% CI, 0.84 to 1.05) (Table 4). AYAs demonstrated similar survival to older women for all breast cancer subtypes, across all race/ethnicities, and across all stages of disease (Table 4). Although not statistically significant, AYAs with early stage I disease may have poorer all-cause (hazard ratio, 1.44; 95% CI, 0.90 to 2.31) and breast cancer-specific survival (hazard ratio, 1.38; 95% CI, 0.86 to 2.21) than women 40 to 64 years of age.
Discussion
Using recently available data on HER2-defined breast cancer in the large, diverse California population, to our knowledge, our study is the first to conduct a population-based assessment of subtype-specific breast cancer survival among AYA patients. AYAs diagnosed with HR-/HER2+ and triple-negative breast cancer ex-perienced poorer overall and breast cancer-specific sur-vival than did AYAs diagnosed with HR+/HER2- breast cancer. For AYAs diagnosed with HR+/HER2+ breast cancer, prognosis varied by tumor grade, with the risk of breast cancer death higher in low-grade disease and lower in high-grade disease than AYAs diagnosed with
HR+/HER2- breast cancer. In addition, poorer survival outcomes were observed among AYAs who resided in lower-SES neighborhoods, had public health insurance, and who were of Black, compared with White, race/ ethnicity, although the race/ethnicity association was attenuated somewhat after adjusting for breast cancer subtypes. Furthermore, across all breast cancer sub-types and after consideration for stage at diagnosis and other factors, AYA women experienced similar short-term survival compared with older women.
Prior studies reported younger age at diagnosis as an in-dependent predictor of adverse prognosis [7,9-11,13,14]. Whereas our study found similar short-term survival among AYAs and older women overall and for all breast cancer subtypes, an institution-based study in Italy found poorer survival in women <35 years for all subtypes, ex-cept Luminal A breast cancer [14]. The poorer survival among AYAs has been attributed to the lack of routine screening among women younger than 40 years, whose diagnoses tend to follow identification of a palpable mass and concomitant differences in clinical presentation [23] or differential receipt of treatment regimens previously observed between AYAs and older age groups [11,24,25]. In particular, uncertainty exists regarding the optimal endocrine therapy for premenopausal women, with some clinical trials suggesting that more intensive ther-apy, including ovarian suppression or ablation, im-proves outcomes [26,27]. Despite the disproportionate burden of advanced-stage disease at diagnosis among AYA women [6], worse survival among AYA women has been attributed to poorer outcomes with
[image:6.595.60.540.89.318.2]Table 2 Risk of death from any cause or breast cancer among adolescents and young adults (15 to 39 years of age) with breast cancer*, California, 2005 through 2009
All-cause deaths Breast cancer-specific deaths
Number of deaths
Model 1* Model 2** Number of
deaths
Model 1* Model 2**†
HR (95% CI) HR (95% CI) HR (95% CI) HR (95% CI)
Subtype†
HR+/HER2- 124 N/A 1.00 (reference) 100 N/A 1.00 (reference)
HR+/HER2+ 46 0.77 (0.53-1.11) 40 0.80 (0.54-1.19)
HR-/HER2+ 73 1.55 (1.10-2.18) 66 1.63 (1.12-2.36)
Triple negative 194 2.75 (2.06-3.66) 166 2.71 (1.98-3.71)
Unclassified 97 1.34 (0.96-1.86) 82 1.37 (0.95-1.98)
Race/ethnicity‡
NH White 194 1.00 (reference) 1.00 (reference) 164 1.00 (reference) 1.00 (reference)
NH Black 77 1.55 (1.14-2.10) 1.33 (0.98-1.82) 67 1.57 (1.12-2.20) 1.35 (0.96-1.89)
Hispanic 199 1.08 (0.85-1.38) 1.06 (0.83-1.35) 172 1.15 (0.88-1.49) 1.12 (0.86-1.46)
NH Asian/Pacific Islander 61 0.99 (0.73-1.35) 1.00 (0.73-1.36) 48 0.98 (0.69-1.39) 0.98 (0.69-1.39)
Unknown <5 N/A N/A <5 N/A N/A
Marital status at diagnosis
Married 284 1.00 (reference) 1.00 (reference) 241 1.00 (reference) 1.00 (reference)
Never married 190 1.26 (1.01-1.58) 1.26 (1.01-1.57) 163 1.29 (1.01-1.64) 1.28 (1.01-1.63)
Previously married 41 1.18 (0.81-1.70) 1.09 (0.75-1.57) 35 1.17 (0.78-1.77) 1.08 (0.72-1.63)
Unknown 19 1.26 (0.74-2.15) 1.15 (0.67-1.95) 15 1.17 (0.64-2.15) 1.05 (0.58-1.93)
Tumor grade
Low 113 1.00 (reference) 1.00 (reference) 84 1.00 (reference) 1.00 (reference)
High 374 1.92 (1.52-2.43) 1.50 (1.17-1.93) 332 2.30 (1.76-3.01) 1.81 (1.36-2.41)
Unknown 47 1.01 (0.60-1.71) 0.84 (0.49-1.44) 38 1.12 (0.61-2.04) 0.92 (0.50-1.70)
Lymph nodes involvement
No 124 1.00 (reference) 1.00 (reference) 98 1.00 (reference) 1.00 (reference)
Positive 372 1.15 (0.87-1.52) 1.23 (0.93-1.62) 321 1.16 (0.85-1.58) 1.24 (0.91-1.70)
Unknown 38 0.86 (0.44-1.69) 0.84 (0.43-1.65) 35 1.11 (0.54-2.28) 1.10 (0.53-2.26)
Neighborhood SES quintile
5 (highest) 73 1.00 (reference) 1.00 (reference) 60 1.00 (reference) 1.00 (reference)
4 103 1.21 (0.87-1.68) 1.30 (0.93-1.80) 90 1.25 (0.88-1.79) 1.33 (0.93-1.90)
3 111 1.35 (0.97-1.87) 1.41 (1.01-1.95) 92 1.27 (0.88-1.82) 1.31 (0.91-1.88)
2 117 1.35 (0.97-1.88) 1.42 (1.02-1.98) 101 1.37 (0.96-1.96) 1.43 (1.00-2.06)
1 (lowest) 130 1.19 (0.84-1.70) 1.23 (0.86-1.75) 111 1.13 (0.77-1.66) 1.15 (0.78-1.70)
Insurance status×
Private/military insurance 272 1.00 (reference) 1.00 (reference) 222 1.00 (reference) 1.00 (reference)
Public insurance 192 1.53 (1.21-1.92) 1.52 (1.21-1.92) 171 1.64 (1.28-2.10) 1.63 (1.27-2.10)
No insurance 14 0.95 (0.49-1.83) 1.08 (0.56-2.09) 12 0.92 (0.44-1.92) 1.04 (0.50-2.17)
Unknown 56 1.33 (0.94-1.88) 1.33 (0.95-1.88) 49 1.48 (1.01-2.15) 1.45 (1.00-2.11)
* Cox models were adjusted for all variables in the table and age at diagnosis (continuous), tumor size (continuous), and first course of treatment (chemotherapy (y/n), radiation (y/n), and surgery (y/n)); AJCC stage levels I through IV and unknown was included as a stratifying variable.
** Cox models were additionally adjusted for subtypes of breast cancer.
†Human epidermal growth factor receptor 2 (HER2), hormone receptor (HR), triple-negative (estrogen-receptor negative, progesterone-receptor negative, HER2-negative).
‡Non-Hispanic. ×
stage disease [8,10,11], a finding suggested by our study. Overall, our findings suggest that differences in stage at diagnosis between AYAs and older women [6] explain the poorer short-term survival observed in young women.
[image:8.595.58.539.112.333.2]AYA breast cancer patients of Black race/ethnicity ex-perienced worse short-term survival than did White women of the same age. Poorer survival outcomes have been reported among young Black women, who also ex-perience a disproportionate burden of triple-negative breast cancer, compared with young White women [6,8,13,28]. Among AYAs, we previously reported that, relative to Whites, Blacks were diagnosed with a higher proportion of triple-negative breast cancer [6]. Although adjusting for breast cancer subtype attenuated survival disparities somewhat, Black AYAs still experienced poorer survival than White AYAs. Black AYA and older women experienced similar breast cancer-specific sur-vival, underscoring the poorer survival of black women seen at all ages [29].
Our findings of poorer survival among AYA breast cancer patients living in lower SES neighborhoods is supported by previous studies involving women of all ages using SEER data [30-32]. Although explanations for SES differences in survival are not well documented, ad-vanced stage at diagnosis has been the most cited ex-planatory factor [32,33]—perhaps because of screening disparities among women age 40 to 79 years [34]—and increasing evidence suggests inadequate breast cancer
treatment and follow-up care among patients in lower SES groups [33]. Furthermore, recent evidence suggests that disparities in breast cancer treatment modalities are associated with health insurance status [35-37], a meas-ure we found to be associated with survival in our study. Factors related to treatment receipt and stage at diagno-sis, however, have not been found to explain fully the so-cioeconomic disparities in survival [32,33,38,39]. Our study observed neighborhood SES differences when we controlled for stage at diagnosis, initial course of treat-ment, and health insurance, although controlling for these three factors attenuated our neighborhood SES findings, particularly for the lowest SES neighborhoods. SES inequalities in survival also may be influenced by factors we could not measure in this study, such as quality of treatment and follow-up care, and comorbidi-ties [33].
Among AYAs, worse short-term survival for HR-/HER2+ and triple-negative breast cancers is consistent with prior studies that had 5 or fewer years of follow up [14,40,41]. Studies with more than 5 years of follow-up have dem-onstrated that triple-negative breast cancer may not have the worst long-term survival outcomes among subtypes [16,42-45], perhaps because of an early peak of recurrence in the first few years after diagnosis and a sharp decrease in the recurrence rate in subsequent years [46]. Results from the population-based Carolina Breast Cancer Study demonstrated that the risk of death 10 or more years after diagnosis was highest among Table 3 Risk of death of any cause or of breast cancer for adolescents and young adults (15 to 39 years of age) with breast cancer by tumor grade*, California, 2005-2009
All-cause deaths Breast cancer-specific deaths
Number of deaths HR (95% CI)* Number of deaths HR (95% CI)*
Low tumor grade (I/II)
Subtype†
HR+/HER2- 44 1.00 (reference) 27 1.00 (reference)
HR+/HER2+ 19 1.57 (0.87-2.81) 16 2.23 (1.12-4.44)
HR-/HER2+ 9 1.52 (0.61-3.76) 7 2.37 (0.85-6.61)
Triple negative 25 10.64 (5.66-20.00) 21 13.87 (6.49-29.64)
Unclassified 16 1.34 (0.70-2.57) 13 2.05 (0.95-4.44)
High tumor grade (III)
Subtype†
HR+/HER2- 73 1.00 (reference) 67 1.00 (reference)
HR+/HER2+ 23 0.49 (0.29-0.81) 21 0.48 (0.28-0.81)
HR-/HER2+ 59 1.40 (0.95-2.06) 55 1.40 (0.93-2.10)
Triple negative 162 2.24 (1.61-3.13) 140 2.14 (1.51-3.04)
Unclassified 57 1.47 (0.98-2.21) 49 1.32 (0.85-2.05)
* Cox models were adjusted for all variables presented in Table2and age at diagnosis (continuous), tumor size (continuous), and first course of treatment (chemotherapy (y/n), radiation (y/n), and surgery (y/n)); AJCC stage levels I-IV and unknown was included as a stratifying variable. P for interaction between breast cancer subtype and grade = 0.018 for all-cause mortality and =0.0735 for breast cancer-specific mortality.
ER-/HER2+ breast cancers for both White and Black women [16,42]. Our finding of an interaction between breast cancer subtype and tumor grade suggests that low-grade triple-negative breast cancers, which are less common, have substantially worse prognosis than low-grade HR+/HER2- breast cancer. Furthermore, the higher risk of breast cancer death in low-grade HR+/HER2+ dis-ease and lower risk of death in high-grade HR+/HER2+ disease than HR+/HER2- disease could result from women with high-grade HR+/HER2+ disease being more likely than those with low-grade HR+/HER2+ disease to receive adjuvant trastuzumab, as suggested by recent studies on patterns of care [47-49].
Our study is the first, to our knowledge, to use population-based cancer registry data to examine sur-vival by the four major molecular breast cancer subtypes for AYA patients by race/ethnicity. As compared with prior studies, ours had a relatively low percentage (16%) of women whose breast cancers were unclassified be-cause of missing ER, PR, or HER2 receptor information [19,50]. To maximize the availability of HER2-receptor
status, however, our study was restricted to diagnoses between 2005 and 2009, limiting the number of AYAs included and the survival time available. Although reli-ability of ER and PR tests can be controversial [51], evi-dence suggests that results from a centralized pathology laboratory generally agree with registry reports for ER and PR status [52]. However, HER2 testing between community-based hospitals and centralized reference la-boratories has been found to contain some disagreement [53]. Consensus-based methods to improve laboratory assays will continue to increase the reliability of ER, PR, and HER2 tests over time [54,55]. As with other studies that consider breast cancer subtype according to recep-tor status, we may be limited, in that subtypes deter-mined by ER, PR, and HER2 receptor status serve only as a proxy for full genetic profiling. These ER, PR, and HER2 designations, however, guide clinical treatment [56] and are becoming increasingly useful in epidemio-logic research [3,16,57]. Our study is also subject to the potential misclassification of race/ethnicity, although we have detected excellent overall agreement with self-Table 4 Risk of death of any cause or of breast cancer, comparing younger women (15 to 39 years of age) with women 40 to 64 years of age with breast cancer, by subtype, race/ethnicity, or stage at diagnosis; California, 2005 through 2009
All-cause deaths Breast cancer-specific deaths
Model 1* Model 2** Model 1** Model 2**
HR (95% CI) HR (95% CI) HR (95% CI) HR (95% CI)
Overall 0.96 (0.86-1.06) 0.92 (0.83-1.02) 0.99 (0.88-1.10) 0.94 (0.84-1.05)
Subtype†
HR+/HER2- N/A 0.92 (0.75-1.11) N/A 0.92 (0.74-1.15)
HR+/HER2+ 0.87 (0.62-1.22) 1.00 (0.69-1.46)
HR-/HER2+ 0.99 (0.74-1.31) 1.08 (0.80-1.46)
Triple negative 0.93 (0.78-1.10) 0.93 (0.77-1.12)
Unclassified 0.86 (0.66-1.13) 0.88 (0.65-1.19)
Race/ethnicity‡
NH White 0.90 (0.76-1.06) 0.89 (0.75-1.05) 0.93 (0.78-1.12) 0.92 (0.77-1.11)
NH Black 0.93 (0.71-1.21) 0.89 (0.68-1.16) 0.97 (0.72-1.29) 0.91 (0.68-1.22)
Hispanic 1.01 (0.85-1.20) 0.95 (0.80-1.14) 1.05 (0.87-1.27) 0.99 (0.82-1.20)
NH Asian/Pacific Islander 1.01 (0.75-1.35) 0.98 (0.73-1.31) 1.02 (0.73-1.41) 0.98 (0.71-1.37)
Unknown N/A N/A N/A N/A
AJCC stage at diagnosis
I 0.97 (0.65-1.43) 0.95 (0.64-1.40) 1.44 (0.90-2.31) 1.38 (0.86-2.21)
II 0.95 (0.79-1.15) 0.90 (0.74-1.08) 0.98 (0.79-1.21) 0.91 (0.73-1.13)
III 1.02 (0.86-1.21) 0.97 (0.82-1.15) 1.06 (0.88-1.27) 1.01 (0.84-1.21)
IV 0.86 (0.70-1.06) 0.86 (0.70-1.05) 0.86 (0.69-1.07) 0.86 (0.69-1.07)
Unknown 1.10 (0.70-1.74) 1.09 (0.69-1.72) 1.02 (0.59-1.77) 1.03 (0.59-1.78)
* Reference group for each model was women 40 to 64 years of age at diagnosis. Cox models were adjusted for all variables in the table and year of diagnosis (continuous), marital status at diagnosis, tumor grade, neighborhood SES (quintile), and first course of treatment (chemotherapy (y/n), radiation (y/n), and surgery (y/n)). AJCC stage levels I through IV and unknown were included as a stratifying variable.
** Cox models were additionally adjusted for subtypes of breast cancer.
[image:9.595.58.540.111.417.2]reported race/ethnicity for Whites and Blacks, and good agreement for Hispanics and Asians [58,59]. Although we considered the first course of cancer-directed treat-ment, we did not have details on treatment such as chemotherapy components and regimen, or treatment received after this period; therefore, our findings could be subject to residual confounding from incomplete treatment data in the cancer registry [60]. We also lacked information about treatment failure or recurrence. Further-more, our study did not have individual-level measures of SES to consider separately or with our neighborhood measure. Although neighborhood and individual SES are associated, neighborhood SES has been found to underestimate associations observed with individual-level SES [61].
Conclusions
Among AYAs with breast cancer, short-term survival var-ied by breast cancer subtypes, with AYAs diagnosed with HR-/HER2+ and triple-negative breast cancer experien-cing poorer short-term survival than AYAs diagnosed with HR+/HER2- breast cancer. In addition, poorer survival outcomes were observed among AYAs who resided in lower SES neighborhoods, had public health insurance, and who were of Black, compared with White, race/ethni-city. Although differences in the breast cancer subtype dis-tributions explained some of the worse survival observed for Black compared with White AYAs, it is noteworthy that AYA and older Black women had similar breast can-cer survival, underscoring the poorer survival among Black women at all ages. As follow-up data accrue, it will be important to continue to monitor long-term survival by breast cancer subtypes in the AYA population. We did not observe short-term survival differences between AYAs and older women after consideration for stage at diagno-sis, but future studies should consider whether the distri-bution of breast cancer subtypes and other factors, including differential receipt of treatment regimens, influ-ences long-term survival in young compared with older women.
Abbreviations
AJCC:American Joint Committee on Cancer; AYA: Adolescent and young adult; CCR: California Cancer Registry; CI: Confidence interval; ER: Estrogen receptor; HER2: Human epidermal growth factor receptor 2; HR: Hormone receptor; IHC: Immunohistochemistry; PR: Progesterone receptor;
SEER: Surveillance, Epidemiology, and End Results; SES: Socioeconomic status.
Competing interests
The authors have no competing interest to disclose.
Authors’contributions
DJP and LT performed the statistical analyses. DJP, LT, MCD, AWK, CAC, and SLG participated in the interpretation of data and drafting and critical review of the manuscript. THMK designed the study, interpreted the data, and led the writing and review of the manuscript. All authors read and approved the final manuscript.
Acknowledgements
Theresa H.M. Keegan, David J. Press, Li Tao, Mindy C. DeRouen, Christina A. Clarke, and Scarlett L. Gomez were supported by the California Department of Public Health as part of the statewide cancer-reporting program mandated by California Health and Safety Code Section 103885 and the National Cancer Institute’s Surveillance, Epidemiology and End Results Program under contract HHSN2612010000140C awarded to the Cancer Prevention Institute of California. Allison W. Kurian did not receive financial support for this project.
The collection of cancer-incidence data used in this study was supported by the California Department of Public Health as part of the statewide cancer-reporting program mandated by California Health and Safety Code Section 103885; the National Cancer Institute’s Surveillance, Epidemiology, and End Results Program under contract HHSN2612010000140C awarded to the Cancer Prevention Institute of California, contract HHSN261201000035C awarded to the University of Southern California, and contract HHSN261201000034C awarded to the Public Health Institute; and the Centers for Disease Control and Prevention’s National Program of Cancer Registries, under agreement #1U58 DP000807-01 awarded to the Public Health Institute. The ideas and opinions expressed herein are those of the authors and endorsement by the State of California, Department of Health Services, the National Cancer Institute, and the Centers for Disease Control and Prevention or their contractors and subcontractors is not intended nor should it be inferred.
Author details 1
Cancer Prevention Institute of California, 2201 Walnut Ave, Suite 300, Fremont, CA 94538, USA.2Division of Epidemiology, Department of Health
Research and Policy, Stanford University School of Medicine, Stanford, CA 94305-5405, USA.3Department of Medicine, Stanford University School of
Medicine, 300 Pasteur Drive, Stanford, CA 94305-5110, USA.
Received: 19 February 2013 Accepted: 4 October 2013 Published: 16 October 2013
References
1. Bleyer A, Barr R, Hayes-Lattin B, Thomas D, Ellis C, Anderson B:The distinctive biology of cancer in adolescents and young adults.Nat Rev Cancer2008,8:288–298.
2. Anders CK, Johnson R, Litton J, Phillips M, Bleyer A:Breast cancer before age 40 years.Semin Oncol2009,36:237–249.
3. Bernstein L, Lacey JV Jr:Receptors, associations, and risk factor
differences by breast cancer subtypes: positive or negative?J Natl Cancer Inst2011,103:451–453.
4. Perou CM, Sorlie T, Eisen MB, van de Rijn M, Jeffrey SS, Rees CA, Pollack JR, Ross DT, Johnsen H, Akslen LA, Fluge O, Pergamenschikov A, Williams C, Zhu SX, Lonning PE, Borresen-Dale AL, Brown PO, Botstein D:Molecular portraits of human breast tumours.Nature2000,406:747–752. 5. Sorlie T, Perou CM, Tibshirani R, Aas T, Geisler S, Johnsen H, Hastie T, Eisen
MB, van de Rijn M, Jeffrey SS, Thorsen T, Quist H, Matese JC, Brown PO, Botstein D, Eystein Lonning P, Borresen-Dale AL:Gene expression patterns of breast carcinomas distinguish tumor subclasses with clinical implications.Proc Natl Acad Sci U S A2001,98:10869–10874.
6. Keegan T, DeRouen M, Press D, Kurian A, Clarke C:Occurrence of breast cancer subtypes in adolescent and young adult women.Breast Cancer Res2012,14:R55.
7. Han W, Kang SY:Relationship between age at diagnosis and outcome of premenopausal breast cancer: age less than 35 years is a reasonable cut-off for defining young age-onset breast cancer.Breast Cancer Res Treat2010,119:193–200.
8. Gnerlich JL, Deshpande AD, Jeffe DB, Sweet A, White N, Margenthaler JA: Elevated breast cancer mortality in women younger than age 40 years compared with older women is attributed to poorer survival in early-stage disease.J Am Coll Surg2009,208:341–347.
9. Xiong Q, Valero V, Kau V, Kau SW, Taylor S, Smith TL, Buzdar AU, Hortobagyi GN, Theriault RL:Female patients with breast carcinoma age 30 years and younger have a poor prognosis: the M.D. Anderson Cancer Center experience.Cancer2001,92:2523–2528.
11. Fredholm H, Eaker S, Frisell J, Holmberg L, Fredriksson I, Lindman H:Breast cancer in young women: poor survival despite intensive treatment. PLoS One2009,4:e7695.
12. Dubsky PC, Gnant MF, Taucher S, Roka S, Kandioler D, Pichler-Gebhard B, Agstner I, Seifert M, Sevelda P, Jakesz R:Young age as an independent adverse prognostic factor in premenopausal patients with breast cancer. Clin Breast Cancer2002,3:65–72.
13. Bharat A, Aft RL, Gao F, Margenthaler JA:Patient and tumor characteristics associated with increased mortality in young women (≤40 years) with breast cancer.J Surg Oncol2009,100:248–251.
14. Cancello G, Maisonneuve P, Rotmensz N, Viale G, Mastropasqua MG, Pruneri G, Veronesi P, Torrisi R, Montagna E, Luini A, Intra M, Gentilini O, Ghisini R, Goldhirsch A, Colleoni M:Prognosis and adjuvant treatment effects in selected breast cancer subtypes of very young women (<35 years) with operable breast cancer.Ann Oncol2010,21:1974–1981.
15. Dawood S, Hu R, Homes MD, Collins LC, Schnitt SJ, Connolly J, Colditz GA, Tamimi RM:Defining breast cancer prognosis based on molecular phenotypes: results from a large cohort study.Breast Cancer Res Treat 2011,126:185–192.
16. Carey LA, Perou CM, Livasy CA, Dressler LG, Cowan D, Conway K, Karaca G, Troester MA, Tse CK, Edmiston S:Race, breast cancer subtypes, and survival in the Carolina Breast Cancer Study.JAMA2006,295:2492. 17. Kheirelseid E, Boggs J, Curran C, Glynn R, Dooley C, Sweeney K, Kerin M:
Younger age as a prognostic indicator in breast cancer: a cohort study. BMC Cancer2011,11:383.
18. California Cancer Reporting System Standards:Cancer Reporting in California, System Standards: Abstracting and Coding Procedures for Hospitals. Volume One.12th edition. Sacramento: California Cancer Registry, Data Standards and Quality Control Unit; 2012.
19. Bauer KR, Brown M, Cress RD, Parise CA, Caggiano V:Descriptive analysis of estrogen receptor (ER)-negative, progesterone receptor (PR)-negative, and HER2-negative invasive breast cancer, the so-called triple-negative phenotype: a population-based study from the California Cancer Registry.Cancer2007,109:1721–1728.
20. California Cancer Reporting System Standards:Cancer Reporting in California, System Standards: Abstracting and Coding Procedures for Hospitals. Volume 1. 8th edition. Sacramento: California Cancer Registry, Data Standards and Quality Control Unit; 2008.
21. Yost K, Perkins C, Cohen R, Morris C, Wright W:Socioeconomic status and breast cancer incidence in California for different race/ethnic groups. Cancer Causes Control2001,12:703–711.
22. Smith EC, Ziogas A, Anton-Culver H:Association between insurance and socioeconomic status and risk of advanced stage Hodgkin lymphoma in adolescents and young adults.Cancer2012,118:6179–6187.
23. Agnese DM, Yusuf F, Wilson JL, Shapiro CL, Lehman A, Burak WE Jr:Trends in breast cancer presentation and care according to age in a single institution.Am J Surg2004,188:437–439.
24. Gabriel CA, Domchek SM:Breast cancer in young women.Breast Cancer Res2010,12:212.
25. Bleyer WA:Cancer in older adolescents and young adults: epidemiology, diagnosis, treatment, survival, and importance of clinical trials. Med Pediatr Oncol2002,38:1–10.
26. Puhalla S, Brufsky A, Davidson N:Adjuvant endocrine therapy for premenopausal women with breast cancer.Breast2009,18:S122–S130. 27. Griggs JJ, Somerfield MR, Anderson H, Henry NL, Hudis CA, Khatcheressian
JL, Partridge AH, Prestrud AA, Davidson NE, American Society of Clinical Oncology endorsement of the cancer care:Ontario practice guideline on adjuvant ovarian ablation in the treatment of premenopausal women with early-stage invasive breast cancer.J Clin Oncol2011, 29:3939–3942.
28. Parise CA, Bauer KR, Caggiano V:Variation in breast cancer subtypes with age and race/ethnicity.Crit Rev Oncol Hematol2010,76:44–52. 29. Ooi SL, Martinez ME, Li CI:Disparities in breast cancer characteristics and
outcomes by race/ethnicity.Breast Cancer Res Treat2011,127:729–738. 30. Singh G, Miller BA, Hankey BF, Edwards BK:Area socioeconomic variations in
U.S. cancer incidence, mortality, stage, treatment and survival, 1975–1999. In NCI Cancer Surveillance Monograph Series, Number 4.Bethesda, MD: National Cancer Institute; 2003.
31. Chu KC, Miller BA, Springfield SA:Measures of racial/ethnic health disparities in cancer mortality rates and the influence of socioeconomic status.J Natl Med Assoc2007,99:1092–1100–1102–1094.
32. Yu X:Socioeconomic disparities in breast cancer survival: relation to stage at diagnosis, treatment and race.BMC Cancer2009,9:364. 33. Woods LM, Rachet B, Coleman MP:Origins of socio-economic inequalities
in cancer survival: a review.Ann Oncol2006,17:5–19.
34. Miller JW, King JB, Joseph DA, Richardson LC:Breast cancer screening among adult women: Behavioral Risk Factor Surveillance System, United States, 2010.Morb Mortal Wkly Rep2012,61:46–50.
35. Griggs JJ, Hawley ST, Graff JJ, Hamilton AS, Jagsi R, Janz NK, Mujahid MS, Friese CR, Salem B, Abrahamse PH, Katz SJ:Factors associated with receipt of breast cancer adjuvant chemotherapy in a diverse population-based sample.J Clin Oncol2012,30:3058–3064.
36. Wu X-C, Lund MJ, Kimmick GG, Richardson LC, Sabatino SA, Chen VW, Fleming ST, Morris CR, Huang B, Trentham-Dietz A, Lipscomb J:Influence of race, insurance, socioeconomic status, and hospital type on receipt of guideline-concordant adjuvant systemic therapy for locoregional breast cancers.J Clin Oncol2012,30:142–150.
37. Coburn N, Fulton J, Pearlman DN, Law C, DiPaolo B, Cady B:Treatment variation by insurance status for breast cancer patients.Breast J2008, 14:128–134.
38. Vona-Davis L, Rose DP:The influence of socioeconomic disparities on breast cancer tumor biology and prognosis: a review.J Womens Health (Larchmt)2009,18:883–893.
39. Sprague BL, Trentham-Dietz A, Gangnon RE, Ramchandani R, Hampton JM, Robert SA, Remington PL, Newcomb PA:Socioeconomic status and survival after an invasive breast cancer diagnosis.Cancer2011,117:1542–1551. 40. Bauer KR, Brown M, Cress RD, Parise CA, Caggiano V:Descriptive analysis of
estrogen receptor (ER)-negative, progesterone receptor (PR)-negative, and HER2-negative invasive breast cancer, the so-called triple-negative phenotype.Cancer2007,109:1721–1728.
41. Bauer K, Parise C, Caggiano V:Use of ER/PR/HER2 subtypes in conjunction with the 2007 St Gallen Consensus Statement for early breast cancer. BMC Cancer2010,10:228.
42. O'Brien KM, Cole SR, Tse C-K, Perou CM, Carey LA, Foulkes WD, Dressler LG, Geradts J, Millikan RC:Intrinsic breast tumor subtypes, race, and long-term survival in the Carolina Breast Cancer Study.Clin Cancer Res2010, 16:6100–6110.
43. Elias AD:Triple-negative breast cancer: a short review.Am J Clin Oncol 2010,33:637–645. 610.1097/COC.1090b1013e3181b1098afcf.
44. Kim JE, Ahn HJ, Ahn J-H, Yoon DH, Kim S-B, Jung KH, Gong G-Y, Kim M-J, Son BH, Ahn SH:Impact of triple-negative breast cancer phenotype on prognosis in patients with stage I breast cancer.J Breast Cancer2012, 15:197–202.
45. Kaplan HG, Malmgren JA:Impact of triple negative phenotype on breast cancer prognosis.Breast J2008,14:456–463.
46. Metzger-Filho O, Tutt A, de Azambuja E, Saini KS, Viale G, Loi S, Bradbury I, Bliss JM, Azim HA, Ellis P, Di Leo A, Baselga J, Sotiriou C, Piccart-Gebhart M: Dissecting the heterogeneity of triple-negative breast cancer.J Clin Oncol 2012,30:1879–1887.
47. Kurian AW, Lichtensztajn DY, Keegan TH, Leung RW, Shema SJ, Hershman DL, Kushi LH, Habel LA, Kolevska T, Caan BJ, Gomez SL:Patterns and predictors of breast cancer chemotherapy use in Kaiser Permanente Northern California, 2004–2007.Breast Cancer Res Treat2013,137:247–260. 48. Romond EH, Perez EA, Bryant J, Suman VJ, Geyer CE Jr, Davidson NE,
Tan-Chiu E, Martino S, Paik S, Kaufman PA, Swain SM, Pisansky TM, Fehrenbacher L, Kutteh LA, Vogel VG, Visscher DW, Yothers G, Jenkins RB, Brown AM, Dakhil SR, Mamounas EP, Lingle WL, Klein PM, Ingle JN, Wolmark N: Trastuzumab plus adjuvant chemotherapy for operable HER2-positive breast cancer.N Engl J Med2005,353:1673–1684.
49. Piccart-Gebhart MJ, Procter M, Leyland-Jones B, Goldhirsch A, Untch M, Smith I, Gianni L, Baselga J, Bell R, Jackisch C, Cameron D, Dowsett M, Barrios CH, Steger G, Huang CS, Andersson M, Inbar M, Lichinitser M, Lang I, Nitz U, Iwata H, Thomssen C, Lohrisch C, Suter TM, Ruschoff J, Suto T, Greatorex V, Ward C, Straehle C, McFadden E,et al:Trastuzumab after adjuvant chemotherapy in HER2-positive breast cancer.N Engl J Med 2005,353:1659–1672.
50. Amirikia KC, Mills P, Bush J, Newman LA:Higher population-based incidence rates of triple-negative breast cancer among young African-American women: implications for breast cancer screening
recommendations.Cancer2011,117:2747–2753.
52. Ma H, Luo J, Press MF, Wang Y, Bernstein L, Ursin G:Is there a difference in the association between percent mammographic density and subtypes of breast cancer? Luminal A and triple-negative breast cancer. Cancer Epidemiol Biomarkers Prev2009,18:479–485.
53. Press MF, Sauter G, Bernstein L, Villalobos IE, Mirlacher M, Zhou JY, Wardeh R, Li YT, Guzman R, Ma Y, Sullivan-Halley J, Santiago A, Park JM, Riva A, Slamon DJ:Diagnostic evaluation of HER-2 as a molecular target: an assessment of accuracy and reproducibility of laboratory testing in large, prospective, randomized clinical trials.Clin Cancer Res2005,11:6598–6607. 54. Hammond ME, Hayes DF, Dowsett M, Allred DC, Hagerty KL, Badve S,
Fitzgibbons PL, Francis G, Goldstein NS, Hayes M, Hicks DG, Lester S, Love R, Mangu PB, McShane L, Miller K, Osborne CK, Paik S, Perlmutter J, Rhodes A, Sasano H, Schwartz JN, Sweep FC, Taube S, Torlakovic EE, Valenstein P, Viale G, Visscher D, Wheeler T, Williams RB,et al:American Society of Clinical Oncology/College Of American Pathologists guideline recommendations for immunohistochemical testing of estrogen and progesterone receptors in breast cancer.J Clin Oncol2010,28:2784–2795. 55. Wolff AC, Hammond ME, Schwartz JN, Hagerty KL, Allred DC, Cote RJ,
Dowsett M, Fitzgibbons PL, Hanna WM, Langer A, McShane LM, Paik S, Pegram MD, Perez EA, Press MF, Rhodes A, Sturgeon C, Taube SE, Tubbs R, Vance GH, van de Vijver M, Wheeler TM, Hayes DF:American Society of Clinical Oncology/College of American Pathologists guideline
recommendations for human epidermal growth factor receptor 2 testing in breast cancer.Arch Pathol Lab Med2007,131:18–43.
56. Carlson RW, Allred DC, Anderson BO, Burstein HJ, Carter WB, Edge SB, Erban JK, Farrar WB, Goldstein LJ, Gradishar WJ, Hayes DF, Hudis CA, Jahanzeb M, Kiel K, Ljung BM, Marcom PK, Mayer IA, McCormick B, Nabell LM, Pierce LJ, Reed EC, Smith ML, Somlo G, Theriault RL, Topham NS, Ward JH, Winer EP, Wolff AC:Breast cancer: clinical practice guidelines in oncology.J Natl Comp Cancer Network2009,7:122–192.
57. Ihemelandu CU, Naab TJ, Mezghebe HM, Makambi KH, Siram SM, Leffall LD Jr, DeWitty RL Jr, Frederick WA:Treatment and survival outcome for molecular breast cancer subtypes in black women.Ann Surg2008, 247:463–469.
58. Clegg LX, Reichman ME, Hankey BF, Miller BA, Lin YD, Johnson NJ, Schwartz SM, Bernstein L, Chen VW, Goodman MT, Gomez SL, Graff JJ, Lynch CF, Lin CC, Edwards BK:Quality of race, Hispanic ethnicity, and immigrant status in population-based cancer registry data: implications for health disparity studies.Cancer Causes Control2007,18:177–187.
59. Gomez SL, Glaser SL:Misclassification of race/ethnicity in a population-based cancer registry (United States).Cancer Causes Control2006, 17:771–781.
60. Giordano SH, Kuo YF, Duan Z, Hortobagyi GN, Freeman J, Goodwin JS: Limits of observational data in determining outcomes from cancer therapy.Cancer2008,112:2456–2466.
61. Krieger N:Overcoming the absence of socioeconomic data in medical records: validation and application of a census-based methodology. Am J Public Health1992,82:703–710.
doi:10.1186/bcr3556
Cite this article as:Keeganet al.:Impact of breast cancer subtypes on 3-year survival among adolescent and young adult women.Breast Cancer Research201315:R95.
Submit your next manuscript to BioMed Central and take full advantage of:
• Convenient online submission
• Thorough peer review
• No space constraints or color figure charges
• Immediate publication on acceptance
• Inclusion in PubMed, CAS, Scopus and Google Scholar
• Research which is freely available for redistribution