Assessing Vegetation Function with Imaging Spectroscopy
J. A. Gamon1,2 · B. Somers3 · Z. Malenovský4,5,6 · E. M. Middleton6 · U. Rascher7 · M. E. Schaepman8,9
Received: 14 January 2018 / Accepted: 16 January 2019 / Published online: 15 February 2019 © The Author(s) 2019
Abstract
Healthy vegetation function supports diverse biological communities and ecosystem pro-cesses, and provides crops, forest products, forage, and countless other benefits. Vegetation function can be assessed by examining dynamic processes and by evaluating plant traits, which themselves are dynamic. Using both trait-based and process-based approaches, spec-troscopy can assess vegetation function at multiple scales using a variety of sensors and platforms ranging from proximal to airborne and satellite measurements. Since spectro-scopic data are defined by the instruments and platforms available, along with their cor-responding spatial, temporal and spectral scales, and since these scales may not always match those of the function of interest, consideration of scale is a necessary focus. For a full understanding of vegetation processes, combined (multi-scale) sampling methods using empirical and theoretical approaches are required, along with improved informatics.
Keywords Plant traits · Photosynthesis · Gross primary production (GPP) · Spectroscopy · Multi-scale sampling · Solar-induced fluorescence (SIF) · Spectral reflectance · Imaging spectrometry
* J. A. Gamon
1 Departments of Earth and Atmospheric Sciences & Biological Sciences, University of Alberta,
Edmonton, Alberta T6G 2E1, Canada
2 School of Natural Resources, University of Nebraska, Lincoln, NE 68583, USA
3 Department of Earth and Environmental Sciences, Katholieke Universiteit Leuven (KU Leuven),
3001 Leuven, Belgium
4 Surveying and Spatial Sciences Group, School of Technology Environments and Design,
University of Tasmania, Private Bag 76, Hobart, TAS 7001, Australia
5 Remote Sensing Department, Global Change Research Institute CAS, Bělidla 986/4a, 60300 Brno,
Czech Republic
6 Biospheric Sciences Laboratory, NASA Goddard Space Flight Center, 8800 Greenbelt Rd,
Greenbelt, MD 20771, USA
7 Institute of Bio- and Geosciences, IBG-2: Plant Sciences, Forschungszentrum Jülich,
Wilhelm-Johnen-Straße, 52425 Jülich, Germany
8 Remote Sensing Laboratories, Department of Geography, University of Zurich,
Winterthurerstrasse 190, 8057 Zurich, Switzerland
9 University Research Priority Program on Global Change and Biodiversity, University of Zurich,
1 Introduction
Vegetation plays a crucial role in many Earth system processes, including carbon and water cycling, biogeochemistry, and climate regulation. Additionally, plants provide humans with a wide range of important goods and services, ranging from forest products and fodder to food production. Our society and economy depend upon the healthy function of plants as well as the resilience of ecosystems of which they are a part. Remote sensing is playing an increasingly important role in monitoring, understanding, and maintaining these critical functions.
From a remote sensing perspective, vegetation function can have several meanings. One definition refers to the detection or quantification of plant traits, structural, physiological, biochemical, or phenological attributes that represent plant functional adaptations or reveal underlying plant ecophysiological processes (Kattge et al. 2011). A complementary defini-tion of vegetadefini-tion funcdefini-tion addresses the dynamics of essential physiological, or ecological processes themselves. This definition emphasizes variation in key processes over time and space and implies that traits themselves can be dynamic.
In this review, we consider both trait- and process-based approaches used to assess plant function, and explore the history, promise and challenge of integrating these approaches in the context of optical remote sensing. The primary focus is on optical measurements, including spectral reflectance and fluorescence sampled with spectrometers, realizing that other types of remote sensing are also useful. Since our ability to detect plant function is scale-dependent, we start with a brief discussion of scale. Next, we review plant functional traits detectable with remote sensing, followed by a consideration of proximal and airborne remote sensing. We then discuss how global satellite remote sensing has been applied to vegetation assessment along with a presentation of new directions in satellite applications. We conclude with current challenges and opportunities, and provide suggestions and direc-tions that are likely to further advance the study of vegetation function.
2 The Concept of Scale
Several aspects of scale, including spatial, temporal, spectral, and biological dimensions, are relevant to any discussion of detecting vegetation function with remote sensing. The dimensions of scale are often intertwined. At finer temporal and spatial scales, underlying mechanisms or traits are best revealed, often requiring fine spectral scales. At progressively larger scales, vegetation function represents the operation of many fine-scale properties and processes that may combine in complex ways due to nonlinear responses and intricate feedbacks. Thus, to a large extent, sampling scale determines which processes are detect-able and how. Consequently, any remote sensing observation of vegetation function should include a consideration of scale, with attention to underlying mechanisms at finer scales and resulting emergent properties at larger scales.
ecosystem photosynthesis and evapotranspiration (Fuentes et al. 2006), often measured independently using eddy covariance. At stand to biome scales, airborne or satellite remote sensing methods can detect changing vegetation productivity using optical or thermal prop-erties, informing us of larger implications, such as altered vegetation productivity result-ing from disease (Zarco-Tejada et al. 2018), plant invasion (Asner and Vitousek 2005), or widespread disturbance and climate change (Goetz et al. 2005). At stand to global scales, remote sensing can inform us of vegetation biophysical properties needed to under-stand emergent processes, such as the influence of surface–atmosphere mass and energy exchange on our atmosphere and climate (Bonan et al. 2002, 2003).
The topic of how to scale, or how we understand complex processes across scales, has been well discussed from a variety of perspectives (Levin 1992; Ehleringer and Field
1993; Quattrochi and Goodchild 1997; Enquist et al. 2015), providing useful insights into vegetation functional assessment. A proper study of function should consider processes
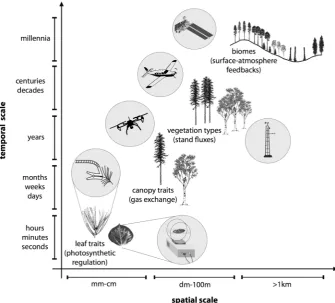
Fig. 1 Depiction of plant traits (and function) at different spatial and temporal scales. In this example of photosynthetic carbon uptake for evergreen and deciduous trees, relevant traits, corresponding functional processes, and measurement methods and terminology vary with scale (as described in the text) as well as
with vegetation type (e.g., evergreen or deciduous) (Table 1). Several measurement approaches are
indi-cated, showing spectroscopic methods in the upper left circles, and corresponding gas exchange methods
in the lower right circles. Spatial and temporal scales indicated on the axes are approximate, depicting
rela-tive rather than absolute values, and refer to the processes and traits, not the measurements, which often do
[image:3.439.51.387.57.360.2]at multiple scales, typically one level below to one level above the key process being observed (de Wit 1970, as discussed in Jarvis 1993), illustrating the importance of multi-scale sampling strategies (Fig. 1). A sampling strategy should first consider the patch size or length scale (Levin 1992) of the particular process in question. Ideally, remote sensing of vegetation function involves detecting traits (functional attributes) or processes defined at a particular length scale (or patch size) and temporal scale, and matching these scales with the instrument’s spatial and temporal resolution and extent. In practice, this is often difficult due to the many sensors, traits, and scales involved and due to the scale mismatch between sensors’ technical capabilities and the questions of interest (Fig. 1; Table 1). Due to these technical limitations, the fundamental sampling rules acknowledging effects of scale are often violated in remote sensing. This challenge of scale, often represented as the mismatch between field sampling and remote sensing, has sometimes limited the engage-ment of terrestrial ecologists or biologists with remote sensing, but is being rectified as the remote sensing capabilities and scaling methodologies evolve.
An important point emerging from this discussion is that there is no single, universally applicable scale for functional studies using remote sensing. Because each remote sensing instrument and platform has a defined sampling scale, often constrained by engineering requirements and physical laws, and because the spatial and temporal resolutions of dif-ferent remote sensing methods do not always match the operational scale of the vegetation process of interest, multiple platforms and sampling scales should be considered, and addi-tional methods are often needed. These methods may involve “upscaling,” the extrapolation from small to large scales through biophysical models or statistical methods (Jung et al.
2011), or “downscaling,” the inversion of models or interpretation of large-scale patterns in terms of underlying fine-scale processes (Jacquemoud et al. 2009). Additionally, a nested sampling protocol (Fig. 1), rather than a single remote sensing platform or approach, can improve our understanding of function, as is often used in remote sensing field campaigns (e.g., Sellers et al. 1997). With the proper attention to scale a remote sensing campaign can reveal information regarding underlying mechanisms and emergent properties associ-ated with a particular vegetation function. How and what we detect with remote sensing, including the “best” sampling strategy, can depend on the specific question or hypothesis to be tested, the observer’s disciplinary background, the technology at hand, and the real-ism of the scaling model with respect to the relevant physiological and biophysical pro-cesses. Challenges in scaling imaging spectroscopy observations from leaves to vegetation canopies, including topics of natural variability and measurement uncertainty, are further described by Malenovský et al. (2019) (this issue).
3 Vegetation Functional Traits
Table
1
Ex
am
ples of plant functional attr
ibutes and t
heir r
ele
vant scales (leaf t
o landscape) t
hat can be addr
essed using spectr
oscop
y along wit
h r ele vant r ef er ences At t
he coarser scales (t
op of t
able), t hese attr ibutes ar e of ten ter med “v eg et ation bioph ysical par ame ters, ” wher
eas at t
he finer scales (mo
ving do
wn t
he t
able), man
y of t
hese
attr
ibutes ar
e of
ten consider
ed “leaf tr
aits.
” In r
eality
, t
her
e is some o
ver
lap acr
oss scales, wit
h t
hese attr
ibutes pr
oviding a continuum of appr
oac
hes t
o assessing function.
Ex
am
ples of se
ver
al v
eg
et
ation indices useful f
or functional assessment ar
e also lis
ted, including ND VI nor malized differ ence v eg et ation inde x, EVI enhanced v eg et ation inde x, NIRv near -infr ar ed r eflect
ance of ter
res trial v eg et ation, PRI pho toc hemical r eflect ance inde x, CCI chlor oph yll/car otenoid inde x, SIF solar -induced fluor escence Functional r ole (scales) Tr aits Ref er ences Gr oss pr imar y pr
oduction and ener
gy balance (Canop
y—Landscape) Leaf ar ea inde x (L AI) Str ee t e t al. ( 2007 ) Leaf ang le dis tribution (L AD) W ang e t al. ( 2007 ) Fr
action of P
AR absorbed (fP
AR) Myneni e t al. ( 2002 ) Albedo Olling er e t al. ( 2008 ), W illiamson e t al. ( 2016 ) Sur face tem per atur e Sc hull e t al. ( 2015 ) Canop y s tructur
e and g
reenness (ND
VI, EVI, NIRv)
Hue te e t al. ( 2002 ), Badg ley e t al. ( 2017 ) Pho tosynt he tic r
ate, light-use efficiency (Leaf—S
tand) Nitr og en content Reic h e t al. ( 1998 )
Specific leaf ar
ea (SL A) Reic h e t al. ( 1998 ), W right e t al. ( 2004 ) X ant hoph yll cy
cle activity (PRI)
Gamon e
t al. (
2001
), Gamon e
t al. (
1997
)
Chlor
oph
yll and car
otenoid pigment le
vels (CCI) Gamon e t al. ( 2016 ) Solar -induced c hlor oph yll fluor escence (SIF) Por car -Cas tell e t al. ( 2014 ), Dr usc h e t al. ( 2017 ) Maximum carbo xy lation r ate (Vcmax) Serbin e t al. ( 2012
), Serbin e
t al. ( 2015 ) Biog eoc hemical cy cling (Leaf) Nitr og en content Singh e t al. ( 2015 )
Lignin and cellulose content
Singh e t al. ( 2015 ) Leaf w ater content Ser rano e t al. ( 2000
), Sims and Gamon (
2003
)
Specific leaf ar
ea (SL A) Reic h e t al. ( 1998 ), W right e t al. ( 2004 ) Str
ess indication (Leaf—S
tand)
Pigment le
vels (PRI, CCI)
Gamon e t al. ( 2016 ) Leaf ar ea inde x (L AI) Batt ag lia e t al. ( 1998 ) Leaf ang le dis tribution (L AD) Ehler ing
er and Coms
toc k ( 1987 ) Foliar w ater content Ser rano e t al. ( 2000
), Sims and Gamon (
2003 ) Maximum carbo xy lation r ate (Vcmax) Serbin e t al. ( 2012
), Serbin e
t al. (
2015
)
Albedo
Teuling and Sene
There is a rich literature on plant traits at the leaf scale, much of which is now being related to leaf optical properties via reflectance spectra (e.g., Serbin et al. 2014). Leaf traits are often defined in terms of foliar constituents (e.g., biochemical or water content), or in terms of leaf structure (e.g., surface area, thickness, specific leaf area, or mass per area) (Cornelissen et al. 2003; Kattge et al. 2011; Homolová et al. 2013). Alternatively, leaf traits can be described in more direct functional and dynamic terms, including carboxyla-tion potential, Vcmax (Serbin et al. 2012), photosynthetic rates, or radiation-use efficiency (Gamon et al. 1997). Remotely sensed data do not always map directly onto plant func-tional traits. Instead, leaf and plant traits can be considered latent variables best represented by transformations or linear combinations of multiple spectral features (Feilhauer et al.
2017). While not all traits are equally retrievable by remote sensing, many hidden traits can be correlated with more accessible traits, facilitating their characterization even when they cannot be directly detected with spectroscopic methods. In these cases, the functional connections between reflectance spectra and functional properties may not yet be entirely clear. Part of the power of spectra for assessing traits is that they provide information from many wavelengths, sometimes into a single metric as represented by a spectral index, or using many wavelengths simultaneously as depicted in a coefficient spectrum (Serbin et al.
2014).
In addition to leaf traits, functionally important vegetation properties can also be defined at larger scales (e.g., canopy traits, vegetation types, and biomes), and these categories can often be viewed as aggregations of underlying leaf or plant traits (van Bodegom et al. 2014). For example, deciduous and evergreen vegetation types tend to have distinct associations of leaf traits that are spectrally discernable (Gamon et al.
1997) (Figs. 1, 2). A clear understanding of canopy and stand structure is needed to understand the “scaleability” of leaf traits, which may depend on the particular trait and context, and can vary with vegetation type. For example, under the right conditions of uniform, closed vegetation stands, xanthophyll cycle pigment activity (an indicator
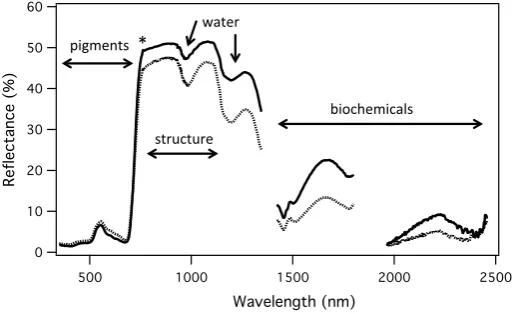
Fig. 2 Canopy reflectance spectra for deciduous poplar (Populus balsamifera, solid line) and evergreen
spruce (Picea glauca, dotted line) canopies, showing spectral regions with information on pigment content,
water content, biochemical content, and leaf or canopy structure. Alternatively, full-spectral information can be used to derive these and other leaf traits, as discussed in the text. Asterisk (*) indicates the
loca-tion of the O2-A band (fluorescence signal). Data gaps occur in wavelengths of strong atmospheric water
[image:6.439.91.351.57.214.2]of photosynthetic light-use efficiency) can be directly detected at larger scales (Gamon and Qiu 1999; Stylinski et al. 2002), offering the possibility of stand-scale assessment of photosynthesis using aircraft or satellite remote sensing. However, complex and dynamic canopy structure can readily confound detection of this leaf photoprotective signal (Barton and North 2001; Gitelson et al. 2017). Consequently, accounting for changing Sun angle, view angle, and canopy structure can often improve the interpreta-tion of the underlying physiological signals (Drolet et al. 2008; Hilker et al. 2008; Mid-dleton et al. 2009, 2016; Hilker et al. 2011).
Due to the complexity of canopy structure, some important leaf traits (e.g., nitrogen content) may not always be directly detectable at stand scales (Knyazikhin et al. 2013). However, because foliar nitrogen levels indirectly influence canopy structure, nitrogen lev-els can often be inferred, even when not directly measured, with remote sensing (Ollinger et al. 2008; Ollinger 2011; Townsend et al. 2013). These examples of leaf traits correlating with higher level traits demonstrate that a proper understanding of the particular context can facilitate the assessment of plant function from remote sensing, even when the underly-ing leaf traits are not directly detectable at larger scales. Consequently, even at larger scales sampled by aircraft and satellite, the concept of leaf traits can have utility, and can often be expressed in suites of characteristics that collectively define “plant strategies” (Grime
2006) or “optical types” (Ustin and Gamon 2010), both variations on the plant functional type concept. Vegetation functional types are commonly used in many global models of ecosystem function and Earth system science as a way to classify complex vegetation bio-physical properties into a few simplified “types,” facilitating model simulations (Bonan et al. 2002, 2003; Pavlick et al. 2013; van Bodegom et al. 2014). The concept of vegetation
optical types, sometimes called spectral types or spectral species (Feret and Asner 2014), represents an attempt to define functionally significant optical properties (or spectral pat-terns) related to plant traits. In this way, defining vegetation functional types in terms of optical types (spectral types) can simplify studies of large-scale vegetation processes.
Advances in spectroscopy and statistical techniques have led to reliable methods to assess leaf traits, sometimes rivalling traditional metrics involving structural or wet chemi-cal measurements. Traits can be derived from specific spectral regions using vegetation indices (Table 1; Fig. 2) (e.g. Malenovský et al. 2013). Alternatively, traits can be retrieved from optical measurements using statistical approaches such as partial least squares regres-sion (PLSR, Roelofsen et al. 2014; Serbin et al. 2014). However, these methods have not yet revealed universal relationships. Part of the reason lies in the evolutionary convergence of plant traits; many plant species have evolved similar solutions to the same environmental challenges, and it is often the subtle variation in these features over time or across envi-ronmental gradients that can be most informative. Most published studies linking optical properties and plant traits are limited to a single point in time, generally near the center of the growing season (Homolová et al. 2013). Thus, they fail to capture the full variation in conditions or plant traits expressed in the life of an individual organism, canopy, stand, or ecosystem. Not surprisingly, results from one season do not always apply well to data-sets collected in another season (Chavana-Bryant et al. 2017). Until we obtain extensive, and uniform, time series of optical data, the full evaluation of plant traits through optical properties will remain a work in progress. Fully understanding the links between spectral space and trait space represents an ongoing challenge, in part due to the large data volume, involving many traits and spectral features along with other independent variables (e.g., time, space, and observation geometry). While progress is being made on the definition and application of optical types (Gamon et al. 1997; Ustin and Gamon 2010; Feret and Asner
of how they relate to plant traits. Opportunities lie in the full exploration of the effects of temporal and spatial scales, a topic more fully explored below (see Sect. 7).
Plant traits can also be related to spectra through forward physical modeling (Schneider et al. 2014) and inversion of leaf or coupled leaf-canopy radiative transfer models at the leaf level (e.g., PROSPECT, Jacquemoud and Baret 1990; Malenovský et al. 2006), or the canopy level using one-dimensional models (e.g., SAIL, Verhoef 1984; or SCOPE, van der Tol et al. 2009) or three-dimensional models (e.g., DART, Gastellu-Etchegorry et al.
2017). For more detailed discussion of such models, see Verrelst et al. (2019) and Maleno-vský et al. (2019) (both in this volume).
4 Proximal Spectrometry
Many of the current advances in spectral reflectance for vegetation function are derived from proximal spectrometers. These include handheld portable spectrometers and ground-based imaging spectrometers (Pinto et al. 2016, 2017), as well as instruments mounted on towers (Hilker et al. 2011), mobile platforms (Gamon et al. 2006; Sims et al. 2006), and unmanned aerial vehicles (UAVs, also known as drones; Burkart et al. 2014; Lucieer et al.
2014; Malenovský et al. 2017). Many of these studies have been coordinated with flux tower observations, facilitating calibrations with independent data and cross-site compari-sons (see reviews by Gamon et al. 2010; Balzarolo et al. 2011; Gamon 2015).
A key advantage of proximal sampling has been its ability to provide rich time series of data, which have been difficult to obtain using airborne or satellite platforms. These instruments sample at scales that can be readily related to leaf traits and where process measurements (e.g., carbon or water vapor fluxes, changing pigment content, or dynamic chlorophyll fluorescence) can be independently validated using experimental approaches and coupled measurements at similar scales. They are also particularly well suited to exploring the functional regulatory, ontogenetic and physiological mechanisms that under-lie changes in optical properties at larger scales. Hence, proximal instruments provide use-ful experimental tools to explore new ways to sample vegetation function and to validate optical measurements at larger scales. A disadvantage is their restricted spatial coverage, limited distribution across biomes and vegetation types, and lack of standardization in sen-sors and protocols, making it difficult to draw general conclusions from individual field studies (Gamon et al. 2010; Gamon 2015). The large number of these studies, combined with improved informatics and statistical or other modeling tools for upscaling, promise to advance our understanding of vegetation function, particularly when combined with air-craft or satellite observations. Proximal sensing can also lead to innovation in sensor tech-nologies and applications that can inform the design and interpretation of future airborne or spaceborne sensors.
5 Airborne Remote Sensing
sensors, while more limited in spectral coverage, are much lighter and less expensive, provid-ing an easier entry point into the world of airborne imagprovid-ing spectrometry. Dependprovid-ing upon their intended purpose, these instruments range in spectral resolution from 10 nm for typical reflectance applications to ≤ 0.3 nm in the case of airborne spectrometers intended for detec-tion of solar-induced fluorescence (SIF, Rascher et al. 2015; Schaepman et al. 2015; Wieneke et al. 2016). Pixel sizes (IFOV) can approximate 1 m2, a scale fine enough to resolve indi-vidual plant canopies in the case of large trees. This combination of fine spatial and spectral resolution is particularly useful for evaluating spatial patterns in plant traits (Asner and Martin
2016).
From the perspective of vegetation dynamics, a primary limitation of airborne platforms has been the difficulty and expense of obtaining regular observations to yield sufficiently large and frequent time series of vegetation function. Typical airborne datasets contain single over-passes, or at best a handful of measurements over a short time span (e.g., several within-day, or “diurnal” acquisitions), which are obtained a few times in a single growing season. Such limited temporal frequency restricts the power for assessing functional processes occurring at different time scales. On the other hand, even single aircraft overpasses can provide useful assessments of spatial patterns in functional traits (Homolová et al. 2014; Asner and Martin
2016) illustrating the benefits of inferring function from trait-based approaches.
Airborne field campaigns with various generations of the Airborne Visible/InfraRed imag-ing Spectrometer (AVIRIS) sensor, such as the AVIRIS Classic and the AVIRIS-NG, have provided good examples of the power of imaging spectrometry to detect vegetation function. Many of these campaigns have assessed plant function through photosynthesis, water status (Fuentes et al. 2006; Serbin et al. 2015; Somers et al. 2015; Asner et al. 2016a), or nutrient sta-tus (Asner and Vitousek 2005). The HyPlant airborne sensor (Rascher et al. 2015), developed in preparation for the forthcoming FLEX satellite mission (Kraft et al. 2013; Drusch et al.
2017), with an expected launch in late 2022, provides very high spectral resolution radiance or reflectance suitable to detect chlorophyll fluorescence and foliar pigment content, both power-ful indicators of photosynthetic activity (Rossini et al. 2015; Simmer et al. 2015; Wieneke et al. 2016; Middleton et al. 2017). The Airborne Prism Experiment (APEX), serving as an airborne precursor for a space-based imaging spectrometer mission, demonstrates simultane-ous high-resolution spectroscopic retrievals for the atmosphere, the non-vegetated surface, and chlorophyll fluorescence (Schaepman et al. 2015). Numerous airborne campaigns focusing on plant traits have provided promising tests of trait-based approaches to assess vegetation func-tion (Asner et al. 2016b; Schneider et al. 2017). Despite limited revisit time, airborne spec-trometry remains a powerful tool for demonstrating the ability of full-spectral information to improve our understanding of vegetation function. Emerging monitoring networks, such as the NEON program (funded by the US National Science Foundation), are beginning to provide airborne imaging spectrometry capability along with proximal spectral measurements across a network of sites in the continental US, offering new opportunities for the systematic explora-tion of vegetaexplora-tion funcexplora-tion across scales for representative ecosystems (Kampe et al. 2010).
6 Satellite Remote Sensing
6.1 Brief History of Optical Satellites for Vegetation Monitoring
orbiting satellites. Most of these have had limited spectral coverage, constraining their util-ity for vegetation functional studies. Many of the multi-spectral orbiting sensors have been radiometers with a small number (e.g., 2–8) of relatively wide (e.g., ≥ 20–30 nm) spectral bands related to a handful of biophysical traits, some related to green vegetation struc-ture (e.g., LAI and fPAR, Table 1). Long-term repetitive observations have been obtained by the USGS Landsat Thematic Mapper/Enhanced Thematic Mapper (TM/ETM) series, and the NOAA Advanced Very High Resolution Radiometer (AVHRR) series. Despite the fact that the NOAA missions, built primarily for weather observations, were not designed or optimized for vegetation monitoring, they fortuitously have provided important insights into vegetation function over large regions. The discovery that a combination of red and near-infrared wavelengths used together could track seasonality of green vegetation bio-mass and leaf area index (Rouse et al. 1974; Tucker 1979), has been applied to the interpre-tation of AVHRR imagery at continental and global scales, providing a revolutionary view of vegetation functional dynamics at continental scales (Tucker et al. 1985), and allowing globally consistent vegetation classifications incorporating seasonal dynamics (DeFries and Townshend 1994).
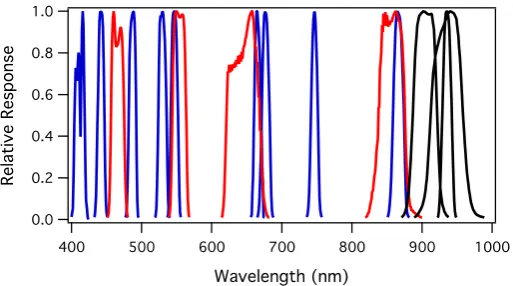
The MODIS (Moderate Resolution Imaging Spectroradiometer) carried on the Terra (launched in 1999) and Aqua (launched in 2002) satellites have emerged as important sen-sors for global biospheric monitoring. At its conception in the 1990s, the MODIS data sys-tem EOSDIS (the Earth Observing Syssys-tem Data and Information Syssys-tem) was the “largest and most complex data system every constructed” (Marshall 1993). Key to MODIS’s suc-cess has been the availability of standardized data products, enabling the establishment of a critical terrestrial database spanning many years that has led to scientific advancements in many earth science disciplines. The operational collection and processing of 36 spectral bands across the full shortwave and infrared regions from the Terra and Aqua MODIS have yielded invaluable time series of atmospheric, marine, and terrestrial products. These 36 bands include 20 reflective shortwave and 16 emitted infrared bands. Seven of the reflective bands are used for terrestrial and atmospheric monitoring land discrimination, covering the VSWIR spectral regions, with varying bandwidths (20–50 nm, Fig. 3). Some of these are used to provide a few key land products, including LAI and FPAR that are widely used in studies of vegetation dynamics (Table 1). Additionally, nine narrower (10 nm) “ocean color” bands in the visible spectrum (blue bands, Fig. 3) are also part of the MODIS suite at coarser spatial scales (~ 1 km for nadir views). These ocean bands were not originally intended for vegetation applications, and in earlier MODIS Collections (1–5), they were processed separately from land bands. Consequently, until recently, researchers using the “ocean” bands for terrestrial vegetation studies have had to conduct their own processing and atmospheric corrections, a situation rectified with Collection 6.
New MODIS products for vegetation function continue to emerge. Although MODIS ocean bands were not originally intended for vegetation, the recent MAIAC reprocessing (Lyapustin et al. 2011a, b), as part of MODIS Collection 6, now provides surface reflec-tance products from both land and ocean bands over terrestrial regions from each MODIS sensor at daily time steps at the equator and multiple times a day in high latitudes due to orbital overlap near the poles. Several studies have demonstrated that combining land and ocean bands over terrestrial regions offers improved assessments of plant traits linked to photosynthetic activity (Rahman et al. 2004; Drolet et al. 2008; Garbulsky et al. 2008; Goerner et al. 2009; Gamon et al. 2016; Middleton et al. 2016). While this new band com-bination still lacks the spectral detail needed to assess many specific plant traits, it con-tains sufficient information to detect relative chlorophyll and carotenoid pigment levels, important indicators of plant stress and photosynthetic activity. This new information on plant pigment ratios improves our assessment of photosynthetic phenology, particularly for evergreen vegetation, which has been difficult to assess using greenness indices like NDVI (Gamon et al. 2016). Similarly, a new MODIS product, fAPARchl (the fAPAR fraction attributable to chlorophyll only), has been developed (Zhang et al. 2009, 2013, 2016) and has been proposed as a standard product. These findings are consistent with a history of studies showing that retrievals of plant pigments from remote sensing provide useful infor-mation about vegetation photosynthesis, productivity, stress, and overall health (Gitelson et al. 2005; Ustin et al. 2009). In global, cross-biome comparisons, NIRv, a new combina-tion of red and NIR band reflectance from MODIS, yields improved GPP estimates relative to the NDVI (Badgley et al. 2017). These newly emerging indices are a testament to the value of consistent satellite time series and a persistent, accessible data system for advanc-ing our understandadvanc-ing of vegetation function.
Since the historical satellite records contain imagery collected with only a few wide spectral bands, they cannot distinguish many important vegetation functional traits and processes detectable only with narrow-band (≤ 10 nm) spectral features. Furthermore, many of the satellite products are temporally aggregated; largely to address problems with varying cloud cover and sensor view angles, past MODIS EVI and NDVI products have been primarily available as composite values at 16-day (and recently at 8-day) time steps, which limits their ability to detect temporal dynamics, particularly during periods of rapid change (e.g., spring green-up or unexpected disturbance events) (Gamon et al. 2013).
[image:11.439.92.349.55.198.2]Newer MODIS collections (e.g., Collection 6) offer daily time series of MODIS reflectance products, enabling a finer look at vegetation dynamics that offers to better resolve these events. Another limitation of the historical satellite time series has been the requirement to integrate other data (e.g., meteorological data) collected from different instruments on different temporal and spatial scales to facilitate quantitative interpretation of the spectral information (Running et al. 2004; Heinsch et al. 2006). Consequently, while current multi-band satellite products reveal broad patterns of a few key emergent properties of terrestrial ecosystems and biomes at the regional to global scales, they are not able to resolve detailed processes at the scale of individual land management units, or at specific experimental sites within observational networks (e.g., the flux tower network). Consequently, many underly-ing mechanisms remain partly obscured, leaving gaps in our understanding of vegetation function.
Despite their limitations, these global satellite products have demonstrated the power of consistent global surface reflectance products for assessment of terrestrial photosyn-thetic dynamics. While many underlying mechanisms remain hidden due to their coarse sampling scales, the consistent time series over many decades has provided an invaluable perspective on vegetation change and essential vegetation fields for global Earth system models (Garonna et al. 2016). These models include Dynamic Global Vegetation Models (DGVMs, e.g., Bonan et al. 2003; Pavlick et al. 2013; van Bodegom et al. 2014), soil–veg-etation–atmosphere-transfer (SVAT) models depicting surface–atmosphere interactions (Arora 2002), nested physiological-climate models (Sellers et al. 1996a, b), and global models of net primary production (NPP, Running et al. 2004). This power to reveal vegeta-tion funcvegeta-tion is continually being expanded with new reanalyses, and by adding addivegeta-tional satellite data.
Since 2015, a follow-on satellite to continue the MODIS record is the Joint Polar Satel-lite System, with a Visible Infrared Imaging Radiometer Suite (VIIRS). Unfortunately, this satellite has fewer bands than MODIS, limiting its utility for vegetation functional assess-ment. Today, the Copernicus Sentinel program of the European Space Agency (ESA) for the European Commission (EC) is setting new standards for operational multi-spectral Earth Observation with Sentinel-2 and Sentinel-3 (Aschbacher and Milagro-Pérez 2012; Malenovský et al. 2012). The two synchronously flying satellites Sentinel-2A and Senti-nel-2B provide 12 optical bands with a spatial resolution of 10–30 meters and a global revisiting time of less than 5 days (Drusch et al. 2012). Besides these operational flagships of ESA, the recently launched (August 2017) VENµS mini-satellite (Israel Space Agency and CNES, France) offers 12 spectral bands (16–40 nm wide) and a unique orbit revisit scheme.
6.2 Hyperspectral Satellites
(Somers and Asner 2012; Huemmrich et al. 2013). The Compact High Resolution Imaging Spectrometer (CHRIS) sensor has a multi-angular viewing capability (2 forward, a nadir and 2 backward viewing angles) for a better understanding of the bidirectional reflectance distribution function (BRDF) of terrestrial surfaces. It collects up to 150 channels (spectral range of 400–1050 nm) with a ground sampling resolution of 17 or 34 m over preselected sites on demand since 2001. A VIS-NIR spectrometer, the Hyperspectral Imager for the Coastal Ocean (HICO), was flown (2009–2014) on the International Space Station (ISS), and its utility for ecosystem function was demonstrated by Huemmrich et al. (2017).
The hyperspectral or spectroscopic observations acquired from space thus far have pro-vided a strong foundation for the further development of satellite imaging spectrometers with global coverage. Hyperspectral missions of note include the Medium Resolution Imaging Spectrometer (MERIS), which had 15 programmable bands (FWHM ~ 2.5–30 nm) and flew from 2002 to 2012, and the CHRIS-Proba which has 200 narrow bands that can be combined into wider (e.g., 18) bands at varying spatial coverage ≤ 30 m. The two European Sentinel-3 satellites continue the mission concept of MERIS with an increasing number of optical bands (21 vs. 15 bands) and an improved optical performance (Donlon et al. 2012). The DLR Earth Sensing Imaging Spectrometer (DESIS; Eckardt et al. 2015) sponsored by the German Space Agency, was deployed on the International Space Station in June 2018. Additional proposed spaceborne imaging spectrometers promise to further expand our understanding of vegetation function using detectors with much higher spectral, spatial and temporal resolution. Presently, there are several new missions in various stages of planning or deployment. The space agencies of Italy and Israel are preparing the PRISMA mission (Amato et al. 2013) for launch in 2018–2019. The EnMAP mission (Germany) (Guanter et al. 2015a) and NASA’s HyspIRI (Hyperspectral Infrared Imager) mission, (Lee et al.
2015), recently evolved into the Surface Biology and Geology (SBG) mission, will fol-low in the next few years. These emerging satellite instruments offer much richer spectral information than the history of multi-band Earth observation satellites mentioned above, and promise to expand the opportunities for assessing specific plant functional traits and dynamics.
6.3 Solar‑Induced Fluorescence (SIF)
and regions of the planet, obscuring fine-scale dynamics needed to explain underlying mechanism. This limitation is spurring development of new sensors and applications of spectrometry and fluorometry from airborne (Rascher et al. 2015; Schaepman et al. 2015) and proximal platforms (Burkart et al. 2014, 2015; Wyber et al. 2017). These ongoing advances combining airborne and proximal remote sensing offer to further clarify the func-tional links between passive fluorescence (SIF) and seasonally dynamic pigments levels (Gamon et al. 2016; Springer et al. 2017). Our growing understanding of photosynthetic dynamics will be further improved with the enhanced capabilities of the newly launched TROPOMI sensor (Guanter et al. 2015b), and the planned European Space Agency’s FLEX (Fluoresence Explorer) satellite mission, designed specifically to directly address pigments and SIF simultaneously at global scales (Kraft et al. 2013; Drusch et al. 2017).
7 Current Challenges and Opportunities
A primary challenge in the remote sensing of vegetation function lies in extracting reliable, quantitative metrics of functional properties and processes that can be universally applied. Part of this challenge derives from the fact that remote sensing methods typically oper-ate at spatial and temporal scales different from the functional processes or traits of inter-est (Fig. 1). Remarkably, despite this scale mismatch, plant traits and processes can often still be detected, even if the underlying mechanisms of signal transmission and detection remain partly unclear (Townsend et al. 2013; Schweiger et al. 2017). Developing a better understanding of the reasons for this convergence across scales, and understanding why it succeeds in some cases and fails in other cases, remain fundamental tasks. Potential solu-tions can be found in applying the full range of instrumentation from proximal sensors to global satellites to address scaling methods. Additional solutions lie in integrating physical, biological, and statistical approaches, and further exploring the concept of “optical types,” representations of plant traits through patterns in spectral reflectance (Ustin and Gamon
2010), also called “spectral types” or “spectral species” (Feret and Asner 2014). Due to the multiple dimensions and high volume of data involved, greater attention to informatics will be needed. These challenges and opportunities are discussed in more detail below.
7.1 Integrating Trait‑Based and Process‑Based Approaches
integrating traits and processes can help quantify functional diversity (Schneider et al.
2017, Schweiger et al. 2017, 2018) and inform our understanding of ecosystem services (Braun et al. 2017).
7.2 Bridging Spatial and Temporal Scales
To what extent leaf traits can be detected at canopy or larger landscape scales observed by global spaceborne missions remains an open question, with good evidence both for and against upscaling of functional traits. The current literature on this topic is not entirely clear, with some authors questioning the detectability of certain leaf traits using optical remote sensing (Knyazikhin et al. 2013) and others noting that they could be detected under the right conditions (Townsend et al. 2013). Not all optical traits scale equally; multiple light scattering and absorption of plant canopies can confound some features, but accentu-ate other features allowing some leaf traits but not others to be easily detectable at canopy and stand scales. A number of studies report detection of plant functional traits with air-borne imaging spectrometry (Asner et al. 2016a, b; Schneider et al. 2017), but the question remains: What exactly is detected as we move to progressively larger scales? A more com-plete answer to this question requires a clear methodology with well-defined hypotheses and conceptual frameworks, as well as physical models simulating imaging spectroscopy signals.
Scaling limitations are being transcended with new computational methods and sam-pling approaches. Since remote sensing technology (including observational instruments, computational power, and physical and statistical models) is rapidly changing, the topic of how to assess function across scales needs to be periodically revisited and updated. New statistical methods, including advanced machine learning approaches, are emerging that are greatly facilitating data analysis across scales (Verrelst et al. 2016). Improved compre-hensive mathematical approaches to scaling (e.g., physically based radiative transfer mod-els) are also relevant, as described in Verrelst et al. (2019) and Malenovský el al. (2019) (this issue).
of model simulations need to be tested against empirical measurements for a wide range of vegetation types to help clarify underlying mechanisms.
Clearly, the topic of scaling functional traits needs further study. Because spectra are temporally dynamic, often displaying considerable redundancy (leading to collinear responses), and because plants exhibit functional convergence (Ollinger 2011), it is easy to get the right answer for the wrong reason (or vice versa), i.e., because of non-causal relationships. Without attention to scale, traditional mapping approaches, while they may imply functional differences, may not be sufficient to fully detect functional processes, in part due to complexities of spatial scale, but also due to the temporal dynamics of plant traits (Chavana-Bryant et al. 2017). Unless temporal dynamics are fully considered, there will remain some question as to the accuracy of plant functional characterization.
7.3 Conceptual Advances in Integrating Physical and Biological Approaches
An understanding of the scaling questions would benefit from an integration of ecological theory with physical principles of radiative transfer (Kattenborn et al. 2017), but this has yet to be fully accomplished. While a complete radiative transfer modeling capability will have to consider complex physical and physiological processes (e.g., turbulent air trans-fer and the rapid physiological responses to dynamic light regimes), it can also be better guided by ecological theory that can help explain how canopies, stands, and landscapes are constructed from underlying rules guiding plant evolution and adaptation.
Ecological theory states that form follows function. This principle, which has some-times been labeled “functional convergence” (Field 1991; Ollinger 2011), allows us to detect functional patterns and differences with imaging spectrometry. An elaboration of this concept states that plant biochemistry and structure have evolved to meet the func-tional goal of efficient resource capture and organism protection (among other goals), and that detectable differences in these traits with remote sensing reflect different adaptations or evolutionary responses, or “strategies” (Grime 2006). Fundamentally, this is an eco-nomic argument, stating that plants tend to follow ecoeco-nomic rules when displaying func-tional properties (Bloom et al. 1985). The scaling of plant traits can be guided by principles of functional convergence, which can involve coordination of plant traits that simplify the challenge of addressing plant function from remote sensing. Different functional solutions can be addressed by a clearer definition of optical types representing optically detectable suites of functionally important plant traits. A better integration of theory with models and empirical measurements will be needed to accomplish these goals.
7.4 Informatics Needs for Databases, Archives, Tools, and Protocols
existing spectral libraries focus on a few static types (the archetypal mean). However, for functional analysis, we are often more interested in the variation over time and space (vari-ance), which is not easily accommodated in current databases. While image databases exist for most satellite sensors, there is no similar community database or archival solution for the variety of current and emerging airborne or field imaging spectrometers, hampering our sharing and understanding of imaging spectroscopy for addressing plant function in a broader context. Both basic research and emerging applications, including phenotyping and precision farming, would greatly benefit from effective data management and process-ing solutions, which remain sparse to date. Examples include the SPECCHIO database (Hueni et al. 2009, 2011). The terrestrial remote sensing community could learn from other disciplines (e.g., astrophysics), where effective community solutions for handling and shar-ing large spectral datasets have been developed (Munari et al. 2005; Rayner et al. 2009).
8 Societal Benefits and Global Challenges
Further development of remote sensing tools for vegetation functional assessment would provide multiple benefits, both to basic science and to society. Vegetation plays a key role in many global Earth system processes, ranging from biogeochemical cycles to the sur-face–atmosphere transport of mass and energy that regulates our atmosphere and climate. Vegetation also supports diverse biological communities and provides many essential eco-system goods and services. Until we can reliably monitor vegetation function at all scales, we cannot fully understand these processes and contributions or how they are changing. For example, longstanding questions about the role of the terrestrial biosphere as a carbon sink, and whether we should expect that sink to start relaxing, thereby accelerating climate change (Schimel 2007) could be better answered with improved remote sensing tools for addressing vegetation function. Similarly, remote sensing offers promising new and inte-grative ways of assessing biodiversity (Cavender-Bares et al. 2017), species composition (Asner and Vitousek 2005), and emerging diseases (Calderón et al. 2013; Zarco-Tejada et al. 2018) in a changing world. Many promising applications and management practices, including phenotyping, precision agriculture, and early stress and disease detection, could be better addressed with well-designed optical remote sensing methods geared toward accurate, precise, and timely vegetation monitoring and related analytics tools. Develop-ment of novel imaging spectroscopy-based remote sensing methods for vegetation function will be essential for monitoring and maintaining healthy and resilient ecosystems in chang-ing world, providchang-ing concurrent social and economic benefits.
Acknowledgements The authors wish to thank the International Space Science Institute (ISSI) for a stim-ulating meeting that led to this paper, and three reviewers whose insightful comments and suggestions
improved the manuscript. Donnette Thayer assisted with Fig. 1 and Ran Wang with Fig. 2. Data presented in
Fig. 2 were collected with support from the National Sciences and Engineering Research Council of Canada
(NSERC) and The Canadian Foundation for Innovation (CFI) funding to J. Gamon. Z. Malenovský was sup-ported by the Australian Research Council Future Fellowship: Bridging scales in remote sensing of vegeta-tion stress (FT160100477). The contribuvegeta-tion of M.E. Schaepman is supported by the University of Zurich Research Priority Program on Global Change and Biodiversit (URPP GCB). The contribution of B. Somers (Katholieke Universiteit Leuven) is supported by the Belgian Science Policy Office in the framework of the STEREOIII program (projects: SR/00/307, SR/01/349, SR/00/363).
OpenAccess This article is distributed under the terms of the Creative Commons Attribution 4.0
and reproduction in any medium, provided you give appropriate credit to the original author(s) and the source, provide a link to the Creative Commons license, and indicate if changes were made.
References
Amato U, Antoniadis A, Carfora MF, Colandrea P, Cuomo V, Franzese M, Pignatti S, Serio C (2013) Statis-tical classification for assessing PRISMA hyperspectral potential for agricultural land use. IEEE J Sel Top Appl Earth Observ Remote Sens 6:615–625
Arora V (2002) Modeling vegetation as a dynamic component in soil–vegetation–atmosphere transfer
schemes and hydrological models. Rev Geophys. https ://doi.org/10.1029/2001r g0001 03
Aschbacher J, Milagro-Pérez MP (2012) The European Earth monitoring (GMES) programme: status and perspectives. Remote Sens Environ 120:3–8
Asner GP, Martin RE (2016) Spectranomics: emerging science and conservation opportunities at the
inter-face of biodiversity and remote sensing. Glob Ecol Conserv 8:212–219. https ://doi.org/10.1016/j.
gecco .2016.09.010
Asner GP, Vitousek PM (2005) Remote analysis of biological invasion and biogeochemical change. Proc
Natl Acad Sci USA 102:4383–4386. https ://doi.org/10.1073/pnas.05008 23102
Asner GP, Brodrick PG, Anderson CB, Vaughn N, Knapp DE, Martin RE (2016a) Progressive forest canopy
water loss during the 2012–2015 California drought. Proc Natl Acad Sci USA 113:E249–E255. https
://doi.org/10.1073/pnas.15233 97113
Asner GP, Knapp DE, Anderson CB, Martin RE, Vaughn N (2016b) Large-scale climatic and geophysical
controls on the leaf economics spectrum. Proc Natl Acad Sci USA 113:E4043–E4051. https ://doi.
org/10.1073/pnas.16048 63113
Badgley G, Field CB, Berry JA (2017) Canopy near-infrared reflectance and terrestrial photosynthesis. Sci
Adv 3:5. https ://doi.org/10.1126/sciad v.16022 44
Balzarolo M et al (2011) Ground-based optical measurements at European flux sites: a review of methods,
instruments and current controversies. Sensors 11:7954–7981. https ://doi.org/10.3390/s1108 07954
Barton CVM, North PRJ (2001) Remote sensing of canopy light use efficiency using the photochemical
reflectance index—model and sensitivity analysis. Remote Sens Environ 78:264–273. https ://doi.
org/10.1016/s0034 -4257(01)00224 -3
Battaglia M, Cherry ML, Beadle CL, Sands PJ, Hingston A (1998) Prediction of leaf area index in eucalypt plantations: effects of water stress and temperature. Tree Physiol 18:521–528
Bloom AJ, Chapin FS, Mooney HA (1985) Resource limitation in plants—an economic analogy. Annu Rev
Ecol Syst 16:363–392. https ://doi.org/10.1146/annur ev.es.16.11018 5.00205 1
Bonan GB, Levis S, Kergoat L, Oleson KW (2002) Landscapes as patches of plant functional types: an
integrating concept for climate and ecosystem models. Glob Biogeochem Cycles. https ://doi.
org/10.1029/2000g b0013 60
Bonan GB, Levis S, Sitch S, Vertenstein M, Oleson KW (2003) A dynamic global vegetation model for use with climate models: concepts and description of simulated vegetation dynamics. Glob Change Biol
9:1543–1566. https ://doi.org/10.1046/j.1365-2486.2003.00681 .x
Braun D et al (2017) From instantaneous to continuous: using imaging spectroscopy and in situ data to map
two productivity-related ecosystem services. Ecol Indic 82:409–419. https ://doi.org/10.1016/j.ecoli
nd.2017.06.045
Burkart A, Cogliati S, Schickling A, Rascher U (2014) A novel UAV-based ultra-light weight spectrometer
for field spectroscopy. IEEE Sens J 14:62–67. https ://doi.org/10.1109/jsen.2013.22797 20
Burkart A et al (2015) A method for uncertainty assessment of passive sun-induced chlorophyll
fluores-cence retrieval using an infrared reference light. IEEE Sens J 15:4603–4611. https ://doi.org/10.1109/
jsen.2015.24228 94
Calderón R, Navas-Cortés JA, Lucena C, Zarco-Tejada PJ (2013) High-resolution airborne hyperspectral
and thermal imagery for early detection of Verticillium wilt of olive using fluorescence,
tempera-ture and narrow-band spectral indices. Remote Sens Environ 139:231–245. https ://doi.org/10.1016/j.
rse.2013.07.031
Cavender-Bares J, Gamon JA, Hobbie SE, Madritch MD, Meireles JE, Schweiger AK, Townsend PA (2017) Harnessing plant spectra to integrate the biodiversity sciences across biological and spatial scales.
Am J Bot 104:966–969. https ://doi.org/10.3732/ajb.17000 61
Chavana-Bryant C et al (2017) Leaf aging of Amazonian canopy trees as revealed by spectral and
physi-ochemical measurements. New Phytol 214:1049–1063. https ://doi.org/10.1111/nph.13853
Cornelissen JHC et al (2003) A handbook of protocols for standardised and easy measurement of plant
functional traits worldwide. Aust J Bot 51:335–380. https ://doi.org/10.1071/bt021 24
de Wit CT (1970) Dynamic concepts in biology. In: Setlik I (ed) Prediction and measurement of photosyn-thetic productivity. Centre for Agricultural Publishing and Documentation, Wageningen, pp 17–23 DeFries RS, Townshend JRG (1994) NDVI-derived land cover classifications at a global scale. Int J Remote
Sens 15:3567–3586
Donlon C et al (2012) The global monitoring for environment and security (GMES) Sentinel-3 mission.
Remote Sens Environ 120:37–57. https ://doi.org/10.1016/j.rse.2011.07.024
Drolet GG et al (2008) Regional mapping of gross light-use efficiency using MODIS spectral indices.
Remote Sens Environ 112:3064–3078. https ://doi.org/10.1016/j.rse.2008.03.002
Drusch M et al (2012) Sentinel-2: ESA’s optical high-resolution mission for GMES operational services.
Remote Sens Environ 120:25–36. https ://doi.org/10.1016/j.rse.2011.11.026
Drusch M et al (2017) The FLuorescence EXplorer Mission Concept-ESA’s Earth Explorer 8. IEEE
Trans Geosci Remote Sens 55:1273–1284. https ://doi.org/10.1109/tgrs.2016.26218 20
Eckardt A et al (2015) DESIS (DLR Earth Sensing Imaging Spectrometer for the ISS-MUSES platform). In: 2015 IEEE international geoscience and remote sensing symposium (IGARSS), pp 1457–1459 Ehleringer JR, Comstock J (1987) Leaf absorptance and leaf angle: mechanisms for stress avoidance.
In: Tenhunen JD, Catarino FM, Lange OL, Oechel WC (eds) Plant response to stress: functional analysis in Mediterranean ecosystems. Springer, Berlin, pp 55–76
Ehleringer JR, Field CB (1993) Scaling physiological processes: leaf to globe, 1st edn. Academic Press, New York
Enquist BJ et al (2015) Scaling from traits to ecosystems: developing a general trait driver theory via integrating trait-based and metabolic scaling theories. In: Pawar S, Woodward G, Dell AI (eds)
Advances in ecological research, vol 52. Academic Press, New York, pp 249–318. https ://doi.
org/10.1016/bs.aecr.2015.02.001
Feilhauer H, Somers B, van der Linden S (2017) Optical trait indicators for remote sensing of plant
spe-cies composition: predictive power and seasonal variability. Ecol Indic 73:825–833. https ://doi.
org/10.1016/j.ecoli nd.2016.11.003
Feret JB, Asner GP (2014) Mapping tropical forest canopy diversity using high-fidelity imaging spec-troscopy. Ecol Appl 24:1289–1296
Field CB (1991) Ecological scaling of carbon gain to stress and resource availability. In: Mooney HA, Winner WE, Pell EJ (eds) Response of plants to multiple stresses. Physiological ecology. Aca-demic Press, New York, pp 35–65
Frankenberg C et al (2011) New global observations of the terrestrial carbon cycle from GOSAT:
pat-terns of plant fluorescence with gross primary productivity. Geophys Res Lett 38:6. https ://doi.
org/10.1029/2011g l0487 38
Fuentes DA et al (2006) Mapping carbon and water vapor fluxes in a chaparral ecosystem using
vegeta-tion indices derived from AVIRIS. Remote Sens Environ 103:312–323. https ://doi.org/10.1016/j.
rse.2005.10.028
Gamon JA (2015) Reviews and syntheses: optical sampling of the flux tower footprint. Biogeosciences
12:4509–4523. https ://doi.org/10.5194/bg-12-4509-2015
Gamon JA, Surfus JS (1999) Assessing leaf pigment content and activity with a reflectometer. New
Phy-tol 143:105–117. https ://doi.org/10.1046/j.1469-8137.1999.00424 .x
Gamon JA, Qiu HL (1999) Ecological applications of remote sensing at multiple scales. In: Pugnaire F, Valladares F (eds) Handbook of functional plant ecology. Marcel Dekker Inc., New York, pp 805–846
Gamon JA, Serrano L, Surfus JS (1997) The photochemical reflectance index: an optical indicator of photosynthetic radiation use efficiency across species, functional types, and nutrient levels.
Oeco-logia 112:492–501. https ://doi.org/10.1007/s0044 20050 337
Gamon JA, Field CB, Fredeen AL, Thayer S (2001) Assessing photosynthetic downregulation in
sunflower stands with an optically-based model. Photosynth Res 67:113–125. https ://doi.
org/10.1023/a:10106 77605 091
Gamon JA, Cheng YF, Claudio H, MacKinney L, Sims DA (2006) A mobile tram system for
system-atic sampling of ecosystem optical properties. Remote Sens Environ 103:246–254. https ://doi.
Gamon JA et al (2010) SpecNet revisited: bridging flux and remote sensing communities. Can J Remote Sens 36:S376–S390
Gamon JA, Huemmrich KF, Stone RS, Tweedie CE (2013) Spatial and temporal variation in primary productivity (NDVI) of coastal Alaskan tundra: decreased vegetation growth following earlier
snowmelt. Remote Sens Environ 129:144–153. https ://doi.org/10.1016/j.rse.2012.10.030
Gamon JA et al (2016) A remotely sensed pigment index reveals photosynthetic phenology in evergreen
conifers. Proc Natl Acad Sci USA 113:13087–13092. https ://doi.org/10.1073/pnas.16061 62113
Garbulsky MF, Peñuelas J, Papale D, Filella I (2008) Remote estimation of carbon dioxide
uptake by a Mediterranean forest. Glob Change Biol 14:2860–2867. https ://doi.org/10.111
1/j.1365-2486.2008.01684 .x
Garonna I, de Jong R, Schaepman ME (2016) Variability and evolution of global land surface
phe-nology over the past three decades (1982–2012). Glob Change Biol 22:1456–1468. https ://doi.
org/10.1111/gcb.13168
Gastellu-Etchegorry JP et al (2017) DART: recent advances in remote sensing data modeling with atmos-phere, polarization, and chlorophyll fluorescence. IEEE J Sel Top Appl Earth Obs Remote Sens
10:2640–2649. https ://doi.org/10.1109/jstar s.2017.26855 28
Gitelson AA, Viña A, Ciganda V, Rundquist DC, Arkebauer TJ (2005) Remote estimation of canopy
chloro-phyll content in crops. Geophys Res Lett 32:L08403. https ://doi.org/10.1029/2005g l0226 88
Gitelson AA, Gamon JA, Solovchenko A (2017) Multiple drivers of seasonal change in PRI: Implications
for photosynthesis 2. Stand level. Remote Sens Environ 190:198–206. https ://doi.org/10.1016/j.
rse.2016.12.015
Goerner A, Reichstein M, Rambal S (2009) Tracking seasonal drought effects on ecosystem light use effi-ciency with satellite-based PRI in a Mediterranean forest. Remote Sens Environ 113:1101–1111. https ://doi.org/10.1016/j.rse.2009.02.001
Goetz SJ, Bunn AG, Fiske GJ, Houghton RA (2005) Satellite-observed photosynthetic trends across boreal North America associated with climate and fire disturbance. Proc Natl Acad Sci USA 102:13521–
13525. https ://doi.org/10.1073/pnas.05061 79102
Grime JP (2006) Plant strategies, vegetation processes, and ecosystem properties. Wiley, New York Guanter L et al (2012) Retrieval and global assessment of terrestrial chlorophyll fluorescence from GOSAT
space measurements. Remote Sens Environ 121:236–251. https ://doi.org/10.1016/j.rse.2012.02.006
Guanter L et al (2015a) The EnMAP spaceborne imaging spectroscopy mission for earth observation.
Remote Sens 7:8830–8857. https ://doi.org/10.3390/rs707 08830
Guanter L et al (2015b) Potential of the TROPOspheric Monitoring Instrument (TROPOMI) onboard the Sentinel-5 Precursor for the monitoring of terrestrial chlorophyll fluorescence. Atmos Meas Tech
8:1337–1352. https ://doi.org/10.5194/amt-8-1337-2015
Heinsch FA et al (2006) Evaluation of remote sensing based terrestrial productivity from MODIS using
regional tower eddy flux network observations. IEEE Trans Geosci Remote Sens 44:1908–1925. https
://doi.org/10.1109/tgrs.2005.85393 6
Hilker T, Coops NC, Hall FG, Black TA, Wulder MA, Nesic Z, Krishnan P (2008) Separating physiologi-cally and directionally induced changes in PRI using BRDF models. Remote Sens Environ 112:2777–
2788. https ://doi.org/10.1016/j.rse.2008.01.011
Hilker T, Gitelson A, Coops NC, Hall FG, Black TA (2011) Tracking plant physiological properties from
multi-angular tower-based remote sensing. Oecologia 165:865–876. https ://doi.org/10.1007/s0044
2-010-1901-0
Homolová L, Malenovský Z, Clevers J, Garcia-Santos G, Schaepman ME (2013) Review of optical-based
remote sensing for plant trait mapping. Ecol Complex 15:1–16. https ://doi.org/10.1016/j.ecoco
m.2013.06.003
Homolová L, Schaepman ME, Lamarque P, Clevers J, de Bello F, Thuiller W, Lavorel S (2014) Comparison of remote sensing and plant trait-based modelling to predict ecosystem services in subalpine
grass-lands. Ecosphere. https ://doi.org/10.1890/es13-00393 .1
Huemmrich KF, Gamon JA, Tweedie CE, Campbell PKE, Landis DR, Middleton EM (2013) Arctic tundra vegetation functional types based on photosynthetic physiology and optical properties. IEEE J Sel
Top Appl Earth Obs Remote Sens 6:265–275. https ://doi.org/10.1109/jstar s.2013.22534 46
Huemmrich KF, Campbell PKE, Gao BC, Flanagan LB, Goulden M (2017) ISS as a platform for optical remote sensing of ecosystem carbon fluxes: a case study using HICO. IEEE J Sel Top Appl Earth Obs
Remote Sens 10:4360–4375. https ://doi.org/10.1109/jstar s.2017.27258 25
Hueni A, Nieke J, Schopfer J, Kneubühler M, Itten K (2009) The spectral database SPECCHIO for improved
long term usability and data sharing. Comput Geosci 35(3):557–565. https ://doi.org/10.1016/j.cageo
Hueni A, Malthus T, Kneubuehler M, Schaepman M (2011) Data exchange between distributed spectral
databases. Comput Geosci 37:861–873. https ://doi.org/10.1016/j.cageo .2010.12.009
Huete A, Didan K, Miura T, Rodriguez EP, Gao X, Ferreira LG (2002) Overview of the radiometric and
biophysical performance of the MODIS vegetation indices. Remote Sens Environ 83:195–213. https
://doi.org/10.1016/s0034 -4257(02)00096 -2
Jacquemoud S, Baret F (1990) PROSPECT: a model of leaf optical properties spectra. Remote Sens Environ
34:75–91. https ://doi.org/10.1016/0034-4257(90)90100 -z
Jacquemoud S et al (2009) PROSPECT plus SAIL models: a review of use for vegetation characterization.
Remote Sens Environ 113:S56–S66. https ://doi.org/10.1016/j.rse.2008.01.026
Jarvis P (1993) Prospects for bottom up models. In: Ehleringer JR, Field CB (eds) Scaling physiological processes: leaf to globe, 1st edn. Academic Press, New York, pp 115–126
Joiner J, Yoshida Y, Vasilkov AP, Yoshida Y, Corp LA, Middleton EM (2011) First observations of global
and seasonal terrestrial chlorophyll fluorescence from space. Biogeosciences 8:637–651. https ://doi.
org/10.5194/bg-8-637-2011
Jung M et al (2011) Global patterns of land-atmosphere fluxes of carbon dioxide, latent heat, and sensible heat derived from eddy covariance, satellite, and meteorological observations. J Geophys Res
Biogeo-sci. https ://doi.org/10.1029/2010j g0015 66
Kampe TU, Johnson BR, Kuester M, Keller M (2010) NEON: the first continental-scale ecological observatory with airborne remote sensing of vegetation canopy biochemistry and structure. J Appl
Remote Sens. https ://doi.org/10.1117/1.33613 75
Kattenborn T, Fassnacht FE, Pierce S, Lopatin J, Grime JP, Schmidtlein S (2017) Linking plant
strate-gies and plant traits derived by radiative transfer modelling. J Veg Sci 28:717–727. https ://doi.
org/10.1111/jvs.12525
Kattge J et al (2011) TRY—a global database of plant traits. Glob Change Biol 17:2905–2935. https ://
doi.org/10.1111/j.1365-2486.2011.02451 .x
Knyazikhin Y et al (2013) Hyperspectral remote sensing of foliar nitrogen content. Proc Natl Acad Sci
USA 110:E185–E192. https ://doi.org/10.1073/pnas.12101 96109
Kraft S et al (2013) FLORIS: phase A status of the fluorescence imaging spectrometer of the Earth Explorer mission candidate FLEX. In: Conference on sensors, systems, and
next-genera-tion satellites XVII, Dresden, Germany, 23–26 Sept 2013. Proceedings of SPIE. https ://doi.
org/10.1117/12.20320 60
Lee CM, Cable ML, Hook SJ, Green RO, Ustin SL, Mandl DJ, Middleton EM (2015) An introduction to the NASA Hyperspectral InfraRed Imager (HyspIRI) mission and preparatory activities. Remote
Sens Environ 167:6–19. https ://doi.org/10.1016/j.rse.2015.06.012
Levin SA (1992) The problem of pattern and scale in ecology. Ecology 73:1943–1967. https ://doi.
org/10.2307/19414 47
Lucieer A, Malenovsky Z, Veness T, Wallace L (2014) HyperUAS-Imaging spectroscopy from a
multi-rotor unmanned aircraft system. J Field Robot 31:571–590. https ://doi.org/10.1002/rob.21508
Lyapustin A, Martonchik J, Wang Y, Laszlo I, Korkin S (2011a) Multiangle implementation of atmos-pheric correction (MAIAC): 1. Radiative transfer basis and look-up tables. J Geophys Res Atmos. https ://doi.org/10.1029/2010j d0149 85
Lyapustin A et al (2011b) Multiangle implementation of atmospheric correction (MAIAC): 2. Aerosol
algorithm. J Geophys Res Atmos. https ://doi.org/10.1029/2010j d0149 86
Malenovský Z, Albrechtova J, Lhotakova Z, Zurita-Milla R, Clevers J, Schaepman ME, Cudlin P (2006) Applicability of the PROSPECT model for Norway spruce needles. Int J Remote Sens 27:5315–
5340. https ://doi.org/10.1080/01431 16060 07629 90
Malenovský Z, Rott H, Cihlar J, Schaepman ME, Garcia-Santos G, Fernandes R, Berger M (2012) Sen-tinels for science: potential of Sentinel-1, -2, and -3 missions for scientific observations of ocean,
cryosphere, and land. Remote Sens Environ 120:91–101. https ://doi.org/10.1016/j.rse.2011.09.026
Malenovský Z et al (2013) Retrieval of spruce leaf chlorophyll content from airborne image data
using continuum removal and radiative transfer. Remote Sens Environ 131:85–102. https ://doi.
org/10.1016/j.rse.2012.12.015
Malenovský Z, Lucieer A, King DH, Turnbull JD, Robinson SA (2017) Unmanned aircraft system
advances health mapping of fragile polar vegetation. Methods Ecol Evol 8:1842–1857. https ://doi.
org/10.1111/2041-210x.12833
Malenovský Z, Homolová L, Lukeš P, Buddenbaum H, Verrelst J, Alonso L, Schaepman ME, Lauret N, Gastellu-Etchegorry JP (2019) Variability and uncertainty challenges in upscaling imaging spec-troscopy observations from leaves to vegetation canopies. Surv Geophys (in review; this issue) Marshall E (1993) Global change—fitting planet earth into a user-friendly database. Science 261:846.