International Global Navigation Satellite Systems Society IGNSS Symposium 2011
University of New South Wales, Sydney, NSW, Australia 15 – 17 November 2011
Assessment of Network RTK Performance using
CORSnet-NSW
Volker Janssen
Survey Infrastructure and Geodesy, Land and Property Information NSW Department of Finance & Services, Bathurst NSW 2795, Australia Tel: +61-2-6332 8426, Fax: +61-2-6332 8479, Email: Volker.Janssen@lpi.nsw.gov.au
Joel Haasdyk
Survey Infrastructure and Geodesy, Land and Property Information NSW Department of Finance & Services, Bathurst NSW 2795, Australia Tel: +61-2-6332 8485, Fax: +61-2-6332 8479, Email: Joel.Haasdyk@lpi.nsw.gov.au
ABSTRACT
CORSnet-NSW is a rapidly growing network of Global Navigation Satellite System (GNSS) Continuously Operating Reference Stations (CORS) providing fundamental positioning infrastructure for New South Wales (NSW) that is accurate, reliable and easy to use. This positioning infrastructure supports a wide range of GNSS applications in areas such as surveying, agriculture, mining and construction. This paper briefly outlines the difference between the traditional, single-base Real Time Kinematic (RTK) and the Network RTK (NRTK) approaches. It continues to report on extensive testing carried out at several locations in eastern NSW to investigate the performance of the CORSnet-NSW NRTK service outside the Sydney metropolitan area, and with larger inter-CORS distances than those found in Sydney (25 km on average). Comparisons are made between NRTK and single-base RTK operation over varying distances to illustrate the performance of NRTK in the study areas. The achievable precision was investigated over multiple days at four different locations, while the achievable accuracy was determined by comparison to the State’s survey ground control network over several days in seven test areas exhibiting a range of NRTK scenarios and cell sizes. These tests have shown that while NRTK has the same ‘look and feel’ as single-base RTK, it produces superior coordinate results in regards to both precision and accuracy. The benefit of averaging observations over a window of 1-2 minutes and re-occupying points 10-30 minutes later is illustrated. It is also shown that coordinate quality (CQ) indicators provided by the GNSS rover equipment are often overly optimistic, even under the favourable satellite visibility and multipath conditions encountered during our tests, and should therefore be used with caution.
1. INTRODUCTION
Global Navigation Satellite System (GNSS) Continuously Operating Reference Station (CORS) networks are being introduced across Australia and internationally to provide improved access to positioning infrastructure for a wide range of GNSS applications in areas such as surveying, mapping and asset management, precision agriculture, engineering and construction, airborne imaging and sensors, and utilities management. Benefits include datum definition, rationalisation of infrastructure, establishment of multi-user systems, positioning services that are similar across and between networks, consistent and reliable connectivity to the national datum, and the ability to provide a degree of legal traceability for satellite-based positioning. Real Time Kinematic (RTK) GNSS in particular provides high-precision coordinates and allows ‘real-world digitising’ with the ability to significantly enhance productivity.
CORSnet-NSW is a rapidly growing network of GNSS CORS providing fundamental positioning infrastructure for New South Wales (NSW) that is accurate, reliable and easy to use (Janssen et al., 2010, 2011b). It is built, owned and operated by Land and Property Information (LPI), a division of the NSW Department of Finance & Services. CORSnet-NSW aims to ensure that fundamental positioning infrastructure is available across all of NSW, while maintaining national and international standards and best practice to accommodate established and developing positioning, navigation and timing applications.
This paper briefly outlines the difference between the traditional, single-base RTK and the Network RTK (NRTK) approaches. Results from extensive testing undertaken by LPI to investigate the performance of the CORSnet-NSW NRTK service outside the Sydney metropolitan area, and with larger inter-CORS distances than those found in Sydney (25 km on average), are then presented. The achievable precision was investigated during a 3-day test using multiple GNSS receivers at four different locations, while the achievable accuracy was determined by comparison to the State’s survey ground control network in seven test areas exhibiting a range of NRTK scenarios and cell sizes. The benefit of applying the windowing technique and double occupations is illustrated. It is also shown that coordinate quality indicators provided by the GNSS rover equipment are often overly optimistic and should therefore be used with caution.
2. SINGLE-BASE RTK VERSUS NETWORK RTK
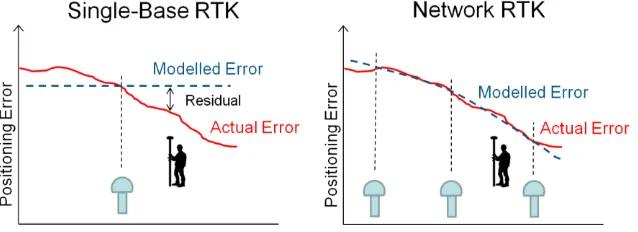
The traditional, single-base RTK approach uses GNSS data of a single reference station or CORS to model the distance dependent errors (i.e. the ionospheric and tropospheric delays and orbit errors) and provide corrections to the user. Since the corrections that model the offset between observed and corrected user position are based on the location of a single CORS, positioning quality decreases with increasing distance from the reference station. NRTK, on the other hand, enables reliable modelling of the distance dependent errors across the network and allows the correction data provided to a user to be optimised based on their (changing) location within the network, thereby providing a modelled error that represents the actual conditions much better (Figure 1).
and is not feasible due to the high cost involved. The NRTK solution is generally based on between three and six of the closest reference stations with respect to the user and allows much greater inter-CORS distances (up to 70-90 km) while maintaining the same level of accuracy. CORSnet-NSW provides users with NRTK correction data according to both the Virtual Reference Station (VRS) approach and the Master-Auxiliary Concept (MAC) (Janssen, 2009).
Figure 1: Modelling of the distance dependent errors for single-base RTK and NRTK.
3. RECENT STUDIES INVESTIGATING NRTK PERFORMANCE
Recently, the performance of NRTK across the United Kingdom was compared in order to quantify the achievable accuracy with VRS and MAC, and to provide a basis for NRTK best practice guidelines (Edwards et al., 2010). It was found that the two commercial NRTK systems investigated provided similar levels of overall accuracy, i.e. 10-20 mm in the horizontal component and 15-35 mm in the vertical component at the 1 level. However, users were urged to pay close attention to coordinate quality (CQ) indicators provided by the GNSS rover equipment and to be aware that overly optimistic CQ values (by a factor of 3-5) can be obtained under limited satellite visibility and multipath conditions. The adoption of the mean of two 3-minute averaged observation windows separated by 20-45 minutes was shown to reduce errors by about 5 mm, particularly in the vertical component. The use of averaging (or windowing) techniques was also recommended if the height difference between the user and the nearest reference station(s) exceeds 250 m.
An investigation of NRTK user performance in Australia outlined the risks involved when exceeding the maximum recommended inter-CORS distances of 70-90 km for dual-frequency operation (Wang et al., 2010). While it may be possible to offer NRTK services to regional areas using larger NRTK cells, the risk of incorrectly resolving integer ambiguities increases substantially. It was also demonstrated that CQ values tend to be overly optimistic, especially under challenging conditions, and do not function well in regards to identifying incorrectly fixed integer ambiguities. The use of triple-frequency signals offered by next-generation GNSS is expected to allow maximum distances between CORS to be doubled to about 140-180 km, while maintaining positioning accuracy at the 2-cm level (Feng and Li, 2008).
4. NRTK PRECISION
4.1 Study Areas and Methodology
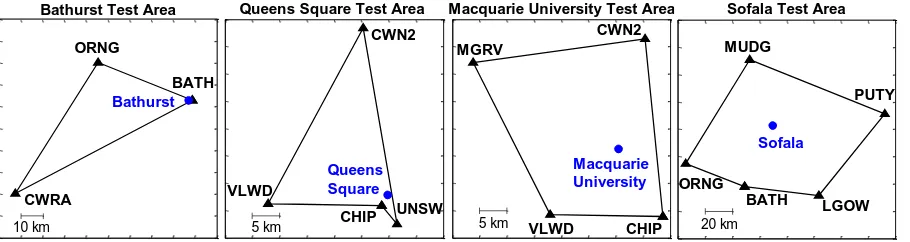
April 2011, specifically designed to compare NRTK to single-base RTK performance over a very short baseline (13 metres), thereby simulating the use of a temporary GNSS reference station for an extremely localised survey. Figure 2 shows the study areas including the surrounding CORSnet-NSW sites used to generate each NRTK cell.
Bathurst Test Area
BATH
CWRA ORNG
Bathurst
10 km
Queens Square Test Area
CHIP UNSW CWN2 Queens Square 5 km VLWD
Macquarie University Test Area
MGRV
CWN2
5 km VLWD CHIP
Macquarie University
Sofala Test Area
[image:4.595.74.529.138.259.2]Sofala MUDG PUTY LGOW ORNG BATH 20 km
Figure 2: Location of the study areas and surrounding CORS.
The test sites were chosen to exhibit a clear skyview with minimal obstructions. At each test site, several Leica Viva GNSS receivers were set up next to each other, observing either in NRTK mode according to the VRS concept utilising data from the surrounding CORSnet-NSW sites or in single-base RTK mode connected to one of up to three different CORS. All receivers collected real-time data at a 1-second interval, resulting in more than 260,000 epochs per instrument. Due to the very close proximity of the receivers (using equipment of the same type), it can be assumed that all datasets were exposed to the same conditions.
[image:4.595.79.516.516.591.2]The average and maximum inter-CORS distances around the perimeter of each NRTK cell as well as the baseline lengths observed to each CORS in single-base RTK mode are listed in Table 1. Inter-CORS distances in the Queens Square and Macquarie University test areas are typical of NRTK cells found in the Sydney metropolitan area. The Bathurst and Sofala test areas exhibit larger inter-CORS distances that are still within the recommended maximum of about 70-90 km, with the exception of MUDG-PUTY in the Sofala test area (108 km).
Table 1: Inter-CORS distances and single-base RTK distances observed in each test area.
Test Area Inter-CORS Distance (km) Single-base RTK Distance (km)
and CORS Used
Average Maximum
Bathurst 70 92 0.013 (BATH) – –
Queens Square 25 37 6 (UNSW) 12 (PBOT) 22 (VLWD) Macquarie University 29 33 15 (CHIP) 41 (WFAL) –
Sofala 75 108 50 (BATH) 62 (LGOW) 70 (ORNG)
4.2 Assessment of Data Quality and Precision
This analysis only considers data within a CQ value of 50 mm for position and height, i.e. the default value recommended by the manufacturer. This resulted in a small amount of data being discarded due to insufficient quality (as determined by the GNSS rover software). For each 3-day dataset, Table 2 lists the percentage of observations within specifications as well as the resulting RMS relative to the mean of the remaining data for both NRTK and single-base RTK. Due to a technical problem beyond our control, the RTK (70 km) dataset from the Sofala test area only spans one full day. It should be emphasised that all remaining figures and tables in this paper represent data that has passed this ‘CQ filter’.
Table 2: Descriptive statistics for each 3-day dataset, noting that values for RTK (70 km) refer to a 1-day dataset.
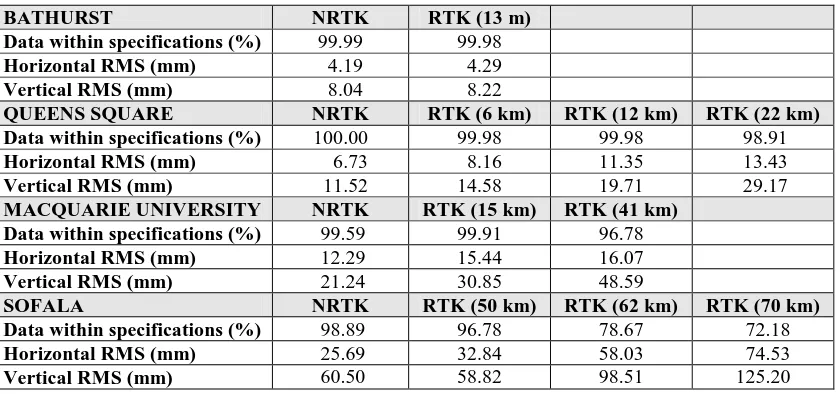
BATHURST NRTK RTK (13 m)
Data within specifications (%) 99.99 99.98
Horizontal RMS (mm) 4.19 4.29
Vertical RMS (mm) 8.04 8.22
QUEENS SQUARE NRTK RTK (6 km) RTK (12 km) RTK (22 km)
Data within specifications (%) 100.00 99.98 99.98 98.91
Horizontal RMS (mm) 6.73 8.16 11.35 13.43
Vertical RMS (mm) 11.52 14.58 19.71 29.17
MACQUARIE UNIVERSITY NRTK RTK (15 km) RTK (41 km)
Data within specifications (%) 99.59 99.91 96.78
Horizontal RMS (mm) 12.29 15.44 16.07
Vertical RMS (mm) 21.24 30.85 48.59
SOFALA NRTK RTK (50 km) RTK (62 km) RTK (70 km)
Data within specifications (%) 98.89 96.78 78.67 72.18
Horizontal RMS (mm) 25.69 32.84 58.03 74.53
Vertical RMS (mm) 60.50 58.82 98.51 125.20
In most cases, a larger amount of data was found to be of sufficient quality by the CQ filter in the case of NRTK, compared to single-base RTK. The only exception is the Macquarie University dataset, indicating a higher acceptance rate for single-base RTK over 15 km. The RMS provides a measure of the precision (at 1 ) achieved over the 3-day test, based on data within specifications. In all cases NRTK performs better, generally by several millimetres, in both the horizontal component (i.e. distance from mean) and the vertical component (with one minor exception in the Sofala NRTK dataset caused by a small number of large outliers, cf. Figure 6c). The higher precision of NRTK is evident even when compared to single-base RTK over a very short baseline of 13 metres. The decreasing precision of single-base RTK operation over increasing distances is clearly evident.
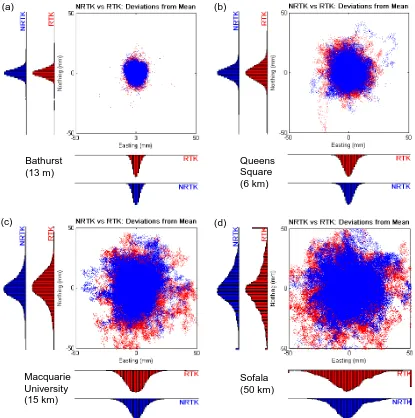
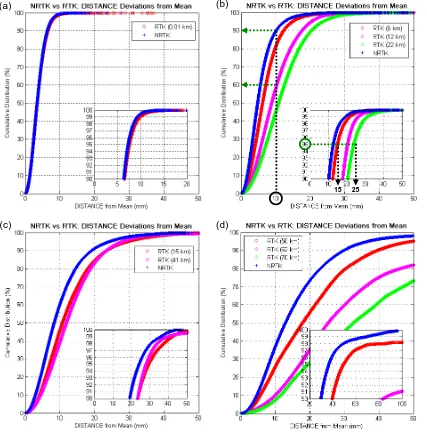
Figure 3 illustrates the higher precision of NRTK in regards to horizontal position compared to single-base RTK to the closest CORS over increasing distances, i.e. 13 m, 6 km, 15 km and 50 km. The histograms along the coordinate axes indicate the number of positions in each millimetre bin from the mean. These histograms also show all values outside the displayed histogram scale of 50 mm, condensed into the most extreme bins. This is visible for the Sofala test area, which uses a NRTK cell of larger than recommended size that has not been released to the standard user.
indicates the existence of fewer outliers when using NRTK, remembering that these outliers were not detected by the previously applied CQ filter. However, for the Sofala test area, it also indicates the risks involved in using NRTK cells with larger than recommended inter-CORS distances.
[image:6.595.90.505.136.554.2]
Figure 3: Horizontal precision of NRTK (blue) vs. single-base RTK to the closest CORS (red) for (a) Bathurst, (b) Queens Square, (c) Macquarie University and (d) Sofala. Distance to the nearest CORS is shown in parentheses. NRTK operation in Bathurst and Sofala is for testing purposes only.
Table 3: Number of observations, including percentage of the full dataset, outside the 50 mm quality bin for NRTK and single-base RTK using the closest CORS.
Test Area Distance Height
NRTK Single-base RTK NRTK Single-base RTK
Bathurst 0 0.00% 0 0.00% 8 0.00% 52 0.02%
Queens Square 1 0.00% 17 0.00% 571 0.16% 752 0.22% Macquarie Uni 18 0.01% 451 0.17% 4,954 1.87% 25,291 9.46% Sofala 3,811 1.91% 8,090 4.84% 59,686 29.95% 48,217 28.85%
For each test area, Figure 4 visualises the cumulative distribution in regards to the horizontal position (i.e. distance from mean) for NRTK and single-base RTK over various distances.
(a) (b)
(c) (d)
Bathurst (13 m)
Sofala (50 km) Queens Square (6 km)
Taking the Queens Square dataset (Figure 4b) as an example, 90% of the horizontal NRTK positions have a precision of 10 mm or better. When using single-base RTK over 12 km at the same location, only 60% of the positions fall within this precision. Similarly, inspecting the insert of Figure 4b, 95% of the horizontal positions using NRTK have a precision of 13 mm or better. For single-base RTK at the same location, 95% of the positions have a precision of 15-24 mm for baselines ranging from 6 km to 22 km. It should be noted that the figure does not display outliers greater than 50 mm distant from the mean that have slipped through the CQ filter (cf. Table 3). The cumulative distribution does however take these outliers into account.
[image:7.595.88.515.206.640.2]
Figure 4: Cumulative distribution in horizontal position for NRTK and single-base RTK over increasing distances for (a) Bathurst, (b) Queens Square, (c) Macquarie University and (d) Sofala.
Note that NRTK operation in Bathurst and Sofala is for testing purposes only.
Investigation of this figure and the associated data reveals: NRTK outperforms single-base RTK in all test areas.
Even when compared to single-base RTK over a very short baseline of 13 metres, a slight improvement is gained by using NRTK, resulting in a smaller number and magnitude of outliers greater than 20 mm (Figure 4a).
(c) (d)
(a) (b)
As expected, NRTK performance degrades with increasing cell size (Figures 4b-d). Consequently, NRTK is currently available only in some regions and will not be extended to cover areas like Sofala until additional CORS are available.
A comparison of the NRTK observations at each test area suggests that NRTK accuracy may also decrease with increasing distance to the nearest CORS, but not as significantly as with single-base RTK. This somewhat contradicts the generally accepted notion that, theoretically, there should be very little distance dependency within an appropriately designed NRTK cell. It is recognised that more testing is required at various distances within a single NRTK cell to support a general statement to this effect.
It is confirmed that 50 km is a realistic but possibly optimistic limit for single-base RTK operation at the few-centimetre level (Figure 4d).
The cumulative distributions for the vertical component (not shown) confirm these findings, but as expected exhibiting larger values. Again referring to the Queens Square dataset as an example, 95% of the vertical positions have a precision of 23 mm or better using NRTK and a precision of 29-61 mm using single-base RTK over baselines ranging from 6 km to 22 km.
4.3 Benefit of Windowing
The windowing (or averaging) technique is often applied to improve the positioning result for real-time applications if the GNSS rover is allowed to remain stationary for a short period of time. Windowing is achieved by determining the average of several epochs observed at a point, thus increasing the reliability of the resulting position. It is important to note that windowing reduces the effect of extreme, short-lived outlier observations, but can still produce results that are significantly offset from the mean (Janssen et al., 2011a). This emphasises the importance of double occupations for high-accuracy applications, even when the windowing technique is employed (see section 4.4).
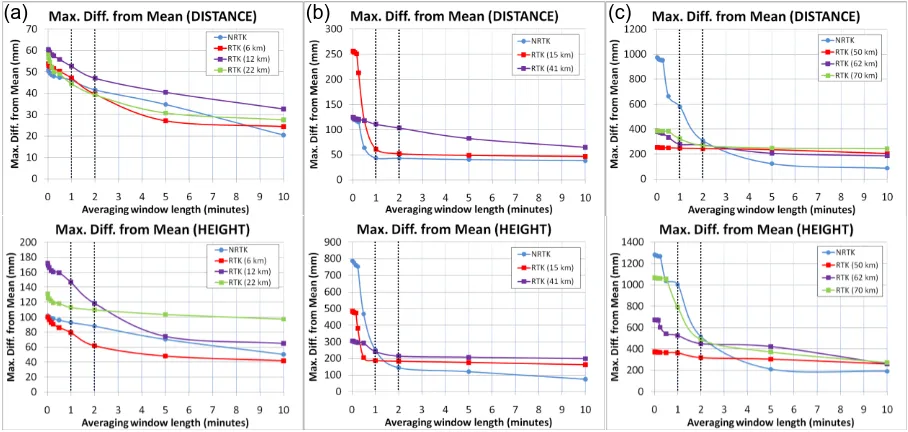
How long should a user spend on a mark in order to benefit from windowing without sacrificing productivity? Each 3-day dataset was investigated in regards to the RMS and the maximum difference from the mean, utilising observation windows of varying length. While the superior performance of NRTK compared to single-base RTK is evident, windowing provides only a relatively small improvement in the RMS (Figure 5). However, it significantly decreases the maximum difference from the mean by reducing the effect of extreme outliers (Figure 6), thus mitigating the risk of obtaining a positioning result that disagrees with the mean by a large amount.
it is advised to use a 2-minute observation window. These findings indicate that the adoption of a 3-minute observation window as recommended by Edwards et al. (2010) is rather conservative.
Figure 5: RMS of distance and height from mean for observation windows of up to 10 minutes for (a) Queens Square, (b) Macquarie University and (c) Sofala.
Figure 6: Maximum difference from mean (distance and height) for observation windows of up to 10 minutes for (a) Queens Square, (b) Macquarie University and (c) Sofala.
4.4 Benefit of Double Occupations
Even when the windowing technique is employed, it is beneficial to use double occupations in order to increase the reliability of the resulting position (and to check against blunders, of course). How long should a user wait until re-observing with the assumption that both occupations are sufficiently independent? In order to answer this question, the difference in horizontal position and ellipsoidal height was determined between every pair of epochs in each 3-day dataset that were a specified time apart. For example, comparing all epochs that
(a) (b) (c)
[image:9.595.70.524.386.602.2]are 300 seconds apart represents, on average, the effect of re-occupying the point after 5 minutes. This was repeated for every possible time separation up to 2 hours.
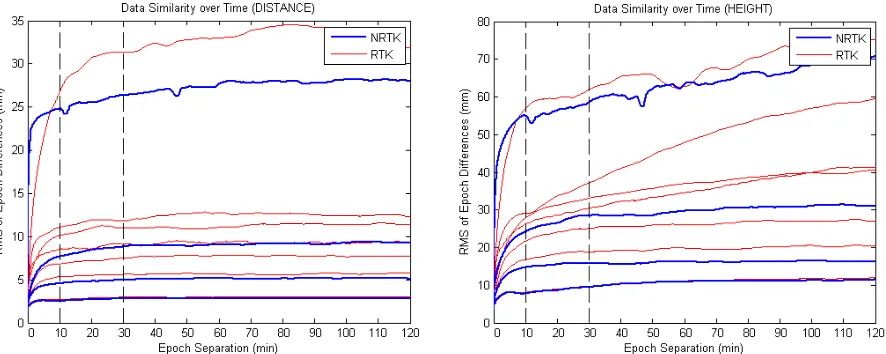
Figure 7 illustrates the RMS of the resulting horizontal distance and height difference between two occupations undertaken a specified time apart for each 3-day dataset, excluding single-base RTK over 62 km and 70 km to increase figure clarity. The datasets indicate that two occupations can be assumed sufficiently independent from each other if they are taken 10-30 minutes apart, while waiting longer to re-observe is generally not likely to improve positioning results any further. The recommendation of waiting for about 20-45 minutes made by Edwards et al. (2010) appears to be rather conservative for the data presented here.
[image:10.595.79.522.221.398.2]
Figure 7: RMS of the horizontal distance and height difference between two 1-second occupations undertaken up to 120 minutes apart for each 3-day dataset using NRTK and
single-base RTK over up to 50 km.
4.5 Investigation of Coordinate Quality Indicators
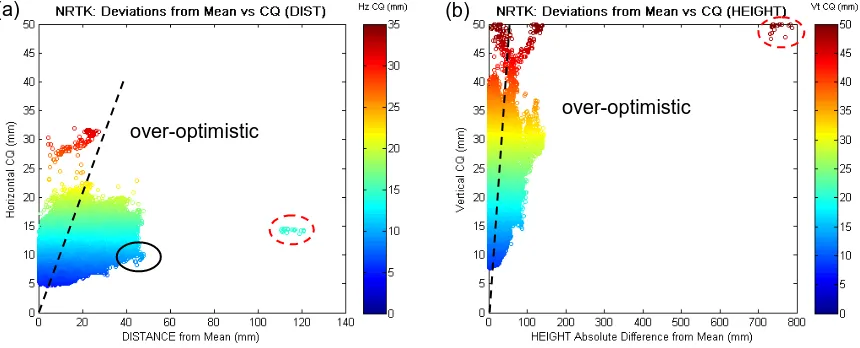
Recent studies have shown that users should be aware of overly optimistic CQ values, especially under limited satellite visibility and poor multipath conditions (e.g. Edwards et al., 2010; Wang et al., 2010). The present datasets are well suited to investigate the agreement between the CQ values calculated at the GNSS rover and the actual precision achieved over each 3-day period. Taking the Macquarie University dataset as an example, Figure 8 visualises this relationship in regards to the horizontal position for NRTK and single-base RTK over 15 km. The remaining three test areas produced comparable results.
In addition to the already mentioned smaller spread of the NRTK solutions, NRTK also exhibits smaller CQ values, suggesting a better quality of the position solutions. It is important to note that for both NRTK and single-base RTK there are instances where a low CQ value is reported, indicating a high-quality solution, even though the coordinate solution is significantly different from the mean. Obviously this is of more concern to the user than the reverse scenario, where a high CQ value is reported for an epoch with good agreement with the mean.
lot lower than indicated by the CQ, in this case by up to a factor of 5 in the horizontal and a factor of 7 in the vertical component, even under the favourable satellite visibility and multipath conditions encountered during this test. For example, as highlighted in Figure 9a, the reported CQ value may indicate a precision of 10 mm, although it is actually much closer to 50 mm. The remaining three test areas produced comparable results. It should be remembered that a CQ filter of 50 mm was applied to the data, so higher CQ values are not shown.
All datasets show that CQ values have a minimum threshold value of about 5 mm in the horizontal component and about 8 mm in the vertical component. The calculation of CQ values does not take into account external errors such as multipath or centring errors. It would be beneficial for the user to have the option of specifying values for some of these errors in the GNSS rover software, which could result in more realistic CQ values. It is also evident that a small number of large outliers (in the example shown in Figure 9 the same 18 NRTK epochs in both the horizontal and vertical components, cf. Table 3) are presumably caused by incorrect ambiguity resolution and cannot be detected by the CQ filter. These findings show that CQ values are prone to be overly optimistic and should be used with caution, confirming results by Edwards et al. (2010) and Wang et al. (2010).
[image:11.595.91.510.332.516.2]
Figure 8: Horizontal precision vs. CQ value for (a) NRTK and (b) single-base RTK over 15 km (Macquarie University). Deviations larger than 50 mm are not shown.
Figure 9: NRTK precision vs. CQ value for the (a) horizontal and (b) vertical component (Macquarie University).
(a) (b)
over-optimistic
over-optimistic
[image:11.595.82.512.563.737.2]5. NRTK ACCURACY
5.1 Study Areas and Methodology
NRTK performance based on larger inter-CORS distances than those found in the Sydney metropolitan area (25 km on average) was investigated in seven test areas across eastern NSW. The achievable accuracy was determined by comparison of NRTK and single-base RTK solutions on established marks to their official coordinates published in the State’s Survey Control Information Management System (SCIMS) database. A range of NRTK scenarios and cell sizes routinely encountered in practice were investigated. All testing was carried out with a high-quality bipod for rover antenna stability, using Leica Viva GNSS receivers.
As CORSnet-NSW operates in the GDA94(2010) realisation of the national datum, a site transformation (also known as site calibration or localisation) is required to relate surveys utilising CORSnet-NSW to the local survey control network (Janssen and McElroy, 2010). The site transformation points were chosen to be of the highest class and order possible, i.e. A1 horizontal and LCL3 vertical, or better. Detailed definitions of the terms class and order can be found in ICSM (2007). In order to ensure that the site transformation does not contaminate the test results, it was decided to observe for 5 minutes at each site transformation point. This is far beyond recommended best practice but ensured that a reliable, high-quality local transformation between the CORSnet-NSW reference frame, i.e. GDA94(2010), and the local ground control network, i.e. GDA94(1997), could be determined. One site transformation was performed using NRTK, another using single-base RTK to the closest CORS as a comparison. Absolute antenna modelling was applied to all GNSS rovers involved (Janssen and Haasdyk, 2011).
It should be noted that the site transformation used a direct 3-dimensional, 7-parameter transformation without the use of a geoid model, i.e. the geoid-ellipsoid separation was considered as part of the similarity transformation parameters from GDA94(2010) to local GDA94(1997) and Australian Height Datum (AHD71) coordinates. Investigation of four test areas showed that using AUSGeoid09 (Brown et al., 2011) as part of the site transformation produced no significant changes to the results (data not shown). While this indicates that the omission of a geoid model in the site transformation appears to be acceptable in this case, it is advised and best practice to use AUSGeoid09 in practice. The threshold for acceptance of the site transformation was set to 20 mm in Easting and Northing, and 50 mm in Height for any single observation.
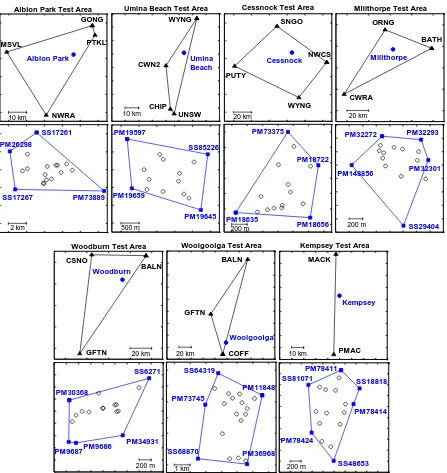
For each test area, the location of the test points surrounded by the site transformation points and the closest CORSnet-NSW sites is illustrated in Figure 10. The average and maximum inter-CORS distances around the perimeter of the surrounding CORS and the average distance to the nearest CORS used for single-base RTK operation are listed in Table 4. The NRTK cells are generally within recommended size (albeit significantly larger than those found in the Sydney metropolitan area), with the exception of including a 110 km baseline (BALN-GFTN) at Woodburn, and inter-CORS distances of 110 km (BALN-GFTN) and 164 km (BALN-COFF) in the Woolgoolga test area. Test points were generally designed to be located well inside the NRTK cell. The Woolgoolga test was designed to investigate performance on the edge of a larger than recommended NRTK cell. Similarly, the Kempsey test was carried out to examine a situation where NRTK is applied approximately halfway on a line between two CORS. It should be noted that NRTK operation in the Woodburn, Woolgoolga and Kempsey test areas is for testing purposes only.
Albion Park Test Area
10 km NWRA
GONG
PTKL
Albion Park MSVL
Umina Beach Test Area
10 km CHIP CWN2 WYNG Umina Beach UNSW
Cessnock Test Area SNGO
Cessnock NWCS
PUTY
WYNG
20 km
Millthorpe Test Area
Millthorpe
CWRA
BATH ORNG
20 km
Albion Park Test Area
2 km
SS17261 PM26298
SS17267 PM73889
Umina Beach Test Area
500 m
PM19645 PM19597
SS85226
PM19659
Cessnock Test Area
200 m PM18656
PM18635
PM18722 PM73375
Millthorpe Test Area
SS29404
200 m
PM148856
PM32272 PM32293
PM32301
Woodburn Test Area
20 km
Woodburn BALN
CSNO
GFTN
Woolgoolga Test Area
20 km
GFTN
Woolgoolga
COFF BALN
Kempsey Test Area
10 km
MACK
PMAC Kempsey
Woodburn Test Area
200 m
PM34931 SS6271
PM30368
PM9687PM9686
Woolgoolga Test Area
SS68870 PM73745 SS64319 PM11848 PM36968 1 km
Kempsey Test Area
[image:13.595.76.523.259.732.2]200 m SS18818 SS81071 PM78411 PM78424 SS48653 PM78414
Table 4: Inter-CORS distances and average single-base RTK distances observed in each test area.
Test Area Inter-CORS Distance (km) Single-base RTK
Average Maximum Distance (km) CORS Used
Albion Park 38 52 16 PTKL
Umina Beach 49 73 16 CWN2
Cessnock 66 80 34 SNGO
Millthorpe 70 92 19 ORNG
Woodburn 84 110 31 BALN
Woolgoolga 115 164 20 COFF
Kempsey – 83 49 PMAC
5.2 Assessment of Accuracy
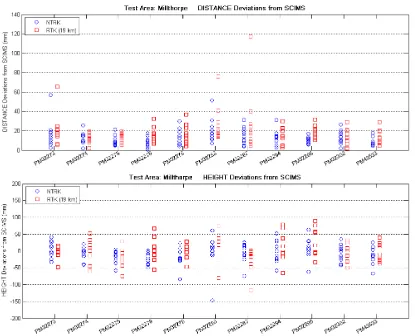
In order to quantify the achievable accuracy of NRTK and single-base RTK, real-time observations on established marks in seven study areas were compared against their published SCIMS coordinates. As an example, the resulting deviations from SCIMS in the horizontal and vertical component are shown for two test areas, i.e. Millthorpe (Figure 11) and Woolgoolga (Figure 12). Corresponding figures for the Albion Park and Cessnock test areas can be found in Janssen et al. (2011a). For every test point surveyed, each 1-minute occupation is represented individually.
[image:14.595.93.508.361.697.2]Figure 12: Horizontal and vertical accuracy vs. SCIMS in Woolgoolga. Results from NRTK (blue) and single-base RTK over about 20 km (red) are shown.
Across all seven test areas, it is evident that NRTK generally produces a better agreement with SCIMS coordinates (after a site transformation), also showing a smaller spread among re-occupations. Cases where both NRTK and single-base RTK show a consistent offset from the official SCIMS coordinates (e.g. SS61209 at Woolgoolga) may indicate an issue with the published SCIMS values, but this is out of scope for the present study. The NRTK results of Millthorpe and Woolgoolga are both compared to single-base RTK over distances of about 20 km to the nearest CORS. The larger NRTK spread and disagreement from SCIMS at Woolgoolga, where average inter-CORS distances are 115 km, indicates the risk involved in using a larger than recommended NRTK cell. Results from Kempsey (i.e. approximately halfway on a line between two CORS) are consistent with the other test areas.
Figure 13: RMS of NRTK (blue) and single-base RTK (red) positioning vs. SCIMS for each test area, with distance to nearest CORS shown in parentheses. Note that NRTK operation in the Woodburn,
Woolgoolga and Kempsey test areas is for testing purposes only.
6. CONCLUSIONS
This paper has briefly described the fundamental differences between the single-base RTK and NRTK concepts. In order to investigate NRTK performance using CORSnet-NSW outside the Sydney metropolitan area with larger inter-CORS distances, extensive tests have been carried out at several locations in eastern NSW. The achievable precision (i.e. repeatability) was investigated at four different locations, using several GNSS receivers at each test site collecting NRTK data and single-base RTK data connected to one of up to three different CORS for three consecutive days (i.e. 260,000 epochs per GNSS receiver). The achievable accuracy was examined over multiple days by comparison to 11-15 established ground control survey marks contained in the SCIMS database in seven test areas, incorporating a range of NRTK scenarios and consisting of 1750 separate occupations.
Based on the results presented, the following recommendations are made in regards to NRTK observations utilising CORSnet-NSW for high-accuracy applications:
NRTK has the same ‘look and feel’ as single-base RTK but provides better precision and agreement with SCIMS (after a site transformation). This is particularly evident in larger NRTK cells (within the recommended limit for inter-CORS distances) that would require longer single-base RTK baselines.
NRTK can deliver precisions of about 12 mm in the horizontal component and about 21 mm in the vertical component (RMS at 1 ) when inter-CORS distances are approximately 30 km.
For a larger NRTK cell incorporating an inter-CORS distance of 108 km and at a distance of 50 km to the nearest CORS, precision (RMS at 1 ) degrades to about 25 mm horizontally and 60 mm vertically. This emphasises the risks involved in using NRTK cells larger than the recommended maximum size. Consequently, NRTK should only be used within regions of NSW where it has been declared operational.
Consistent accuracies (against SCIMS) of about 20 mm (or better) in the horizontal and about 30 mm in the vertical component (RMS at 1 ) can be achieved with NRTK, unless larger than recommended inter-CORS distances are used, while single-base RTK accuracy degrades significantly for baselines greater than 30 km.
required or the user is distant from the nearest CORS, it is advised to use a 2-minute observation window.
Averaging for 60 seconds rather than 15 seconds delivers a large improvement in positioning quality, while averaging for longer than 1-2 minutes is generally not expected to provide substantial further improvement.
Using double occupations, i.e. re-observing each point after waiting about 10-30 minutes, increases the reliability of the resulting position. Waiting any longer is not likely to provide any further benefits other than perhaps logistic convenience.
Coordinate quality (CQ) indicators provided by the GNSS rover equipment are often overly optimistic (by a factor of up to 5-7), even under favourable satellite visibility and multipath conditions, and should therefore be used with caution.
These findings will form the basis of future updates of regulations, Surveyor General’s directions, standards and best practice guidelines in NSW.
ACKNOWLEDGEMENTS
The invaluable help from all LPI survey offices across NSW is gratefully acknowledged, supplying GNSS equipment and staff to perform the extensive fieldwork involved. Macquarie University is thanked for giving permission to collect GNSS data on university grounds.
REFERENCES
Brown NJ, Featherstone WE, Hu G, Johnston GM (2011) AUSGeoid09: A more direct and more accurate model for converting ellipsoidal heights to AHD heights, Journal of Spatial Science
56(1): 27-37.
Edwards SJ, Clarke PJ, Penna NT, Goebell S (2010) An examination of Network RTK GPS services in Great Britain, Survey Review 42(316): 107-121.
Feng Y, Li B (2008) A benefit of multiple carrier GNSS signals: Regional scale network-based RTK with doubled inter-station distances, Journal of Spatial Science 53(1): 135-147.
ICSM (2007) Standards and practices for control surveys (SP1), version 1.7,
http://www.icsm.gov.au/icsm/publications/sp1/sp1v1-7.pdf (accessed Oct 2011).
Janssen V (2009) A comparison of the VRS and MAC principles for Network RTK, Proceedings of
International Global Navigation Satellite Systems Society Symposium (IGNSS2009), Surfers
Paradise, Australia, 1-3 December, 13pp.
Janssen V, Haasdyk J (2011) CORS networks: Absolute antenna models are absolutely vital, Position
51: 36-40.
Janssen V, Haasdyk J, McElroy S (2011a) CORSnet-NSW Network RTK: Same look and feel... only better, Proceedings of Association of Public Authority Surveyors Conference (APAS2011), Bathurst, Australia, 6-7 April, 39-54.
Janssen V, Haasdyk J, McElroy S, Kinlyside D (2011b) CORSnet-NSW: Improving positioning infrastructure for New South Wales, to appear in Proceedings of Surveying & Spatial Sciences
Institute Biennial International Conference (SSSC2011), Wellington, New Zealand, 21-25
November.
Janssen V, McElroy S (2010) Coordinates and CORSnet-NSW: Dealing with distortions in GDA94,
Position 50: 24-27.
Leica Geosystems (2009) Leica SmartNet UK & Ireland Network RTK user guide, http://i.leica-geosystemsuk.com/CmpDoc/2009/7430/0_leica-smartnet-rtk-user-guide.pdf (accessed Oct 2011).
Wang C, Feng Y, Higgins M, Cowie B (2010) Assessment of commercial Network RTK user positioning performance over long inter-station distances, Journal of Global Positioning
Systems 9(2): 78-89.
Zhang K, Wu F, Wu S, Rizos C, Roberts C, Ge L, Yan T, Gordini C, Kealy A, Hale M, Ramm P, Asmussen H, Kinlyside D, Harcombe P (2006) Sparse or dense: Challenges of Australian Network RTK, Proceedings of International Global Navigation Satellite Systems Society