eurostat
1
MONEY AND FINANCE
MONNAIE ET FINANCES
2 α
1989
i
Theme / Thèmesa
eurostat
OFICINA ESTADÍSTICA DE LAS COMUNIDADES EUROPEAS DE EUROPÆISKE FÆLLESSKABERS STATISTISKE KONTOR STATISTISCHES AMT DER EUROPÄISCHEN GEMEINSCHAFTEN ΣΤΑΤΙΣΤΙΚΗ ΥΠΗΡΕΣΙΑ ΤΩΝ ΕΥΡΩΠΑΪΚΩΝ ΚΟΙΝΟΤΗΤΩΝ STATISTICAL OFFICE OF THE EUROPEAN COMMUNITIES OFFICE STATISTIQUE DES COMMUNAUTÉS EUROPÉENNES ISTITUTO STATISTICO DELLE COMUNITÀ EUROPEE
BUREAU VOOR DE STATISTIEK DER EUROPESE GEMEENSCHAPPEN SERVIÇO DE ESTATÍSTICA DAS COMUNIDADES EUROPEIAS
L2920 Luxembourg Tél. 43011 Télex: Comeur Lu 3 4 2 3
B1049 Bruxelles, bâtiment Berlaymont, rue de la Loi 2 0 0 (bureau de liaison) — Tél. 2351111
Las publicaciones de Eurostat están clasificadas por temas y por series. La clasificación se encuentra al final de la obra. Para mayor información sobre las publicaciones, rogamos se pongan en contacto con Eurostat.
Para los pedidos, diríjanse a las oficinas de venta cuyas direcciones figuran en la página interior de la contracubierta.
Eurostats publikationer er klassificeret efter emne og serie. En oversigt herover findes bag i hæftet. Yderligere oplysninger om publikationerne kan fås ved henvendelse til Eurostat.
Bestilling kan afgives til de salgssteder, der er anført på omslagets side 3.
Die Veröffentlichungen von Eurostat sind nach Themenkreisen und Reihen gegliedert. Die Gliederung ¡st hinten in jedem Band aufgeführt. Genauere Auskünfte über die Veröffentlichungen erteilt Eurostat. Ihre Bestellungen richten Sie bitte an die Verkaufsbüros, deren Anschriften jeweils auf der dritten Umschlagseite der Veröffentlichungen zu finden sind.
Οι εκδόσεις της Eurostat ταξινομούνται κατά θέμα και κατά σειρά. Η ακριβής ταξινόμηση αναφέρεται στο τέλος κάθε έκδοσης. Για λεπτομερέστερες πληροφορiες σχετικά με τις εκδόσεις, μπορεiτε να απευθύνεσθε στην Eurostat.
Για τις παραγγελiες μπορεiτε να απευθύνεσθε στα γραφεiα πώλησης, των οποiων οι διευθύνσεις αναγράφονται στη σελiδα 3 του εξωφύλλου.
Eurostat's publications are classified according to themes and series. This classification is indicated at the end of the publication. For more detailed information on publications, contact Eurostat.
Orders are obtainable from the sales offices mentioned on the inside back cover.
Les publications de l'Eurostat sont classées par thème et par série. Cette classification est précisée à la fin de l'ouvrage. Pour des informations plus détaillées sur les publications, contactez l'Eurostat.
Pour les commandes, adressez-vous aux bureaux de vente dont les adresses sont indiquées à la page 3 de la couverture.
Le pubblicazioni dell'Eurostat sono classificate per tema e per serie. Tale classificazione è precisata alla fine dell'opera. Per informazioni più dettagliate sulle pubblicazioni rivolgersi all'Eurostat.
Per eventuali ordinazioni rivolgersi a uno degli uffici di vendita i cui indirizzi figurano nella 3a pagina
della copertina.
De publikaties van Eurostat zijn ingedeeld naar onderwerp en serie. Deze indeling is achter in het boek opgenomen. Voor nadere informatie over de publikaties kunt u zich wenden tot Eurostat.
Gelieve bestellingen op te geven bij de verkoopbureaus, waarvan de adressen op bladzijde 3 van de omslag zijn vermeld.
MONEY AND FINANCE
MONNAIE ET FINANCES
Quarterly D Trimestriel
Bemærk: Denne bulletin udsendes hvert kvartal på engelsk/fransk. En oversættelse af hele teksten til de andre fællesskabssprog kan fås ved henvendelse til Eurostat.
Hinweis: Dieses vierteljährliche Bulletin erscheint regelmäßig in Englisch/Französisch. Eine voll ständige Übersetzung des Textes in die anderen Gemeinschaftssprachen ist auf Anfrage beim Euro stat erhältlich.
Σημεiωση: Το δελτiο αυτό δημοσιεύεται στα αγγλικά και γαλλικά κάθε τρiμηνο. Μια μετάφραση του όλου κειμένου στις άλλες κοινοτικές γλώσσες μπορεi να λάβει κανεiς από την Eurostat.
Notice: This bulletin is published quarterly in English/French. A translation of the whole text in the other languages of the Community is available from Eurostat.
Avertissement: Ce bulletin trimestriel est régulièrement publié en anglais/français. Une traduction des textes dans les autres langues communautaires peut être obtenue auprès de l'Eurostat.
Avvertenza: Questo bollettino trimestrale è pubblicato regolarmente in inglese/francese. Una tradu-zione completa nelle altre lingue della Comunità dei testi può essere ottenuta presso l'Eurostat.
Nota: Dit driemaandelijks bulletin wordt regelmatig gepubliceerd in het Engels/frans. Een vertaling van de volledige tekst in de andere talen van de Gemeenschap zijn verkrijgbaar bij Eurostat.
Luxembourg: Office des publications officielles des Communautés européennes, 1989
Kat./cat.: CA-BQ-89-002-2A-C
© CECA - CEE - CEEA, Bruxelles · Luxembourg, 1989
Contents
Main national and international publications 5
Symbols and abbreviations 6
Introduction 7 Concepts and definitions
Structural indicators 8 The European Monetary System 10
Current statistics 12
STATISTICAL TABLES
I. STRUCTURAL INDICATORS
1. Financial accounts
1.1. Net change in assets and liabilities vis-à-vis
the rest of the world 36 1.2. National economy 37 1.3. Households and private non-profit institutions 38
1.4. Non-financial corporate and quasi-corporate
enterprises 39 1.5. General government 40
1.6. Credit institutions 41 1.7. Insurance enterprises 42
2. Money supply
2.1. GDP/M1 (velocity of circulation of money) . . . . 43
2.2. Notes and coin/M1 (currency ratio) 43
2.3. M1/M3 (liquidity ratio) 43
3. Public finance
3.1. Central government budget 44 3.2. Central government debt 44
4. Interest rate differentials (National rates - US rates)
4.1. Official discount rate 46 4.2. Short-term rates 46 4.3. Long-term rates 46
5. Exchange rates and GDP purchasing power parities
5.1. Index of exchange rates 48 5.2. Index of GDP purchasing power parities 48
5.3. Difference: exchange rate - internal
purchas-ing power of the currency (% of PPS) 48
6. Position vis-à-vis the rest of the world
6.1. Assets/GDP in % 50 6.2. Liabilities/GDP in % 50 6.3. Net/GDP in % 50
7. Foreign official reserves (monetary gold excluded)
7.1. Annual variation of reserves in % 52 7.2. Reserves/average monthly imports 52
7.3. Reserves/world reserves 52
II. EUROPEAN MONETARY SYSTEM (EMS) AND THE ECU
1. Composition of the ECU basket 56 2. EMS: Bilateral central rates and intervention
points ; 56
3. Central rates 57 4. Realignments of EMS currencies 57
5. Weights of EMS currencies in the ECU basket . 57
6. The divergence indicator 58 7. ECU bond issues 59 8. Interest rates and yields of ECU investments .. 59
9. Consumer prices expressed in ECU 60
III. CURRENT STATISTICS
1. Integrated balance sheet of credit institutions 64
2. Money supply
2.1. Money supply 66 2.2. Money supply M1 68 2.3. Money supply M2 70 2.4. Money supply M3 72
3. Public finance
3.1. Central government budget deficit (-) or
sur-plus ( + ) 74 3.2. Central government debt 75
4. Interest rates and share yields
4.1. Short-term interest rates 76 4.1.1. Official discount rate 76 4.1.2. Day-to-day money rate 76 4.1.3. Treasury bill rate (three month) 76
4.2. Long-term interest rates 78 4.2.1. Yield on long-term government bonds (at
current prices) 78 4.2.2. Yield on long-term government bonds (at
constant prices) 78 4.2.3.Yield on shares 78
5. Index of share prices
5.1. Index of share prices 80 5.2. Index of share prices (at constant prices) . . . . 80
5.3. Index of share prices (in ECU) 80
6. Exchange rates
6.1. 1 ECU = 82 6.2. 1 USD = 84 6.3. Index of exchange rates 86
6.3.1. 1 unit of national currency = . . . ECU . . . . 86 6.3.2. 1 unit of national currency = . . . USD . . . . 86
7. Position vis-à-vis the rest of the world
7.1. Assets and liabilities of the national economy 88
7.1.1. Assets 88 7.1.2. Liabilities 88 7.1.3. Net position 88 7.2. Foreign assets and liabilities of general
government 89 7.2.1. Foreign assets 89 7.2.2. Foreign liabilities 89 7.2.3. Net position 89 7.3. Foreign assets and liabilities of credit
insti-tutions 90 7.3.1. Foreign assets 90
7.3.2. Foreign liabilities 90 7.3.3. Net position 90 7.4. Foreign assets and liabilities of private
non-banking sectors 91
7.4.1. Foreign assets 91 7.4.2. Foreign liabilities 91 7.4.3. Net position 91
8. Foreign official reserves
8.1. Foreign official reserves (monetary gold
in-cluded) 92 8.2. Foreign official reserves (monetary gold
ex-cluded) 92 8.2.1. Foreign exchange of which: ECU 92
8.2.2. Special drawing rights 94 8.2.3. Position in the IMF 94 8.3. Monetary gold 96 8.3.1. Valued at market prices 96
MAIN NATIONAL AND INTERNATIONAL PUBLICATIONS
Belgique/België:
Danmark:
BR Deutschland:
Ellas:
España:
France:
Ireland:
Italia:
Luxembourg:
Nederland:
Portugal:
United Kingdom:
United States of America:
Nippon:
International organizations:
Bulletin/Tijdschrift
Statistiske efterretninger Monetary review
Monatsberichte Beihefte
Monthly statistical bulletin
Boletín estadístico
Bulletin trimestriel Statistiques mensuelles Statistiques trimestrielles Bulletin mensuel
Quarterly bulletin Supplements
Bolletino economico Supplementi al bolletino Bolletino mensile di statistica
Bulletin trimestriel
Kwartaalbericht
Maandstatistiek van het financiewezen
Boletim trimestral
Financial statistics Quarterly bulletin
Survey of current business Federal reserve bulletin
Economic statistics (monthly)
International financial statistics (IFS) Financial statistics (monthly)
Banque nationale de Belgique/Nationale Bank van België
Danmarks Statistik Danmarks Nationalbank
Deutsche Bundesbank
Bank of Greece
Banco de España
Banque de France
Institut national de statistique et des études économiques (Insee)
Central Bank of Ireland
Banca d'Italia
Istituto Centrale di Statistica (Istat)
Institut monétaire luxembourgeois
Nederlandsche Bank
Centraal Bureau voor de Statistiek (CBS)
Banco de Portugal
Central Bureau of Statistics (CSO) Bank of England
United States Department of Commerce Board of Governors of the
Federal Reserve System
Bank of Japan
International Monetary Fund (IMF)
SYMBOLS AND ABBREVIATOINS
Eurostat Mio Mrd ECU * 0
Statistical Office of the European Communities Million
1 000 million
European currency unit Estimate made by Eurostat Nil
No data available
No data existing by definition
EUR 12 Total of the 12 Member States of the European Communities (Belgium, Denmark, FR of
Germany, Greece, Spain, France, Ireland, Italy, Luxembourg, the Netherlands, Portugal and United Kingdom)
GDP Gross domestic product at market prices
Currencies
BFR/LFR DKR DM DR ESC FF HFL IRL LIT PTA UKL USD SFR SKR NKR CAD ÖS FMK YEN AUSD NZLD SDR
Belgian franc/Luxembourg franc Danish krone
German mark Greek drachma Portuguese escudo French franc Netherlands guilder Irish pound
Italian lira Spanish peseta Pound sterling United States dollar Swiss franc
INTRODUCTION
1. This publication summarizes the various financial statistics managed by Eurostat covering the European Community, the United States of America and Japan.
This volume comprises three main parts:
(i) The first part presents a set of structural indi-cators, which show basic trends in the evolution of financial variables or relations between finan-cial variables and other economic indicators.
Structural indicators are shown only on an annual basis.
(ii) The second part deals mainly with current infor-mation on the working of the European Monetary System and the private use of the ECU as an instrument of investment.
(iii) The third part groups together most of the current financial indicators which are used in current economic analysis.
2. This publication covers only part of the information available to Eurostat: in fact, the financial statistics domains in the Cronos data bank (FINA and BIF1) include some 25 000 primary and derived time series. All of these data can be supplied on request or consulted via Euronet.
In addition:
(i) The financial accounts by sector, without the subsectors of general government, are published annually in ESA national accounts - detailed
tables by sector. The financial accounts of the
subsectors of general government appear in the yearbook General government accounts and stat-istics.
(ii) Daily and monthly data on the second part, the European Monetary System, are published montly
in ECU-EMS information.
(iii) Information about current financial indicators appear in the publications:
Eurostatistics - data for short-term economic
analysis (monthly);
Review - annual data over 10 years; Basic statistics - annual data.
I. STRUCTURAL INDICATORS
1. Financial accounts
The sections on financial accounts in the European system of integrated economic accounts (ESA), records, for the resident sectors of the national economy and for the rest of the world, the changes in different types of assets and liabilities.
The currency ratio shows to what extent banknotes and coin are used in transactions in relation to the use of checking deposits. The evolution of the ratio over time reflects the changes in the transaction practices within each country.
2.3 M1/M3 (liquidity ratio)
The section on national economy accounts, which appears first in this publication, presents the sum of the changes of financial assets and liabilities of the resident sector vis-à-vis the rest of the world. The ratio of this net change to GDP relates the financial situation of the net economy to the production of goods and services.
The nomenclature of sectors and transactions follows the ESA closely. In some cases however, transactions have been aggregated.
These aggregations refer to 'Currency and deposits', which is defined as the sum of 'Transferable sight depo-sits' (F20), 'Other depodepo-sits' (F30) and 'Securities', which cover respectively 'Bills and short-term bonds' (F40), 'Long-term bonds' (F50) and 'Shares and other equities' (F60). In the sector 'Insurance enterprises', 'Bills and short-term bonds' (F40) and 'Long-term bonds' (F50) are grouped together under the heading 'Bills and bonds'.
For more detailed methodological information on the contents of the sectors and transactions, reference should be made to the European system of integrated economic accounts — ESA, second edition, 1979.
2. Money supply
2.1 GDP/M1 (velocity of circulation of money)
The velocity of circulation of money Is the ratio of gross domestic product (GDP) to the annual average of the money stock M1 outstanding. The ratio gives the theoreti-cal number of times the stock of money is turned over per year in financing the annual flow of income.
Since the M1 concept of the money supply (notes and coin in circulation plus transferable sight deposits) is fairly comparable on an international level, it has been chosen as the denominator of the ratio, contrary to the practice followed by some countries in sometimes refer-ring to broader concepts of the money supply (M2 or M3). (See 111.2)
2.2 Notes and coin/M1 (Currency ratio)
This ratio shows the relative share of coin and banknotes in the money stock (M1). (For the definition of M1 see III.2)
This ratio indicates the readily spendable part of the economy's liquidity in relation to the total money stock.
Notes and coin and transferable sight deposits (M1) represent that part of the total money stock which can readily be used as a means of payment.
M3 is the broadest concept of the money stock and includes M1 plus placements which are in a potential liquid form, in that they can easily be converted into means of payment without any risk of capital loss to the holder (e.g. certain types of savings deposits, time deposits, etc.).
3. Public finance
3.1 Central government budget surplus ( + ) or deficit ( - ) as a percentage of GDP
Central government includes, in principle, the adminis-trative departments of the State and other central agen-cies whose competence extends over the whole eco-nomic territory, except for the administration of social security funds.
The sectoral delimitation refers to the definition adopted by the European system of integrated economic accounts (ESA), which could however not always be followed in the elaboration of the statistics ¡n this table. For further details about national definitions see section III.3.1.
3.2 Central government debt and central government foreign debt as a percentage of GDP
For the sectoral delimitation, see 3.1 above. For details of national sources and definitions, see section III.3.2.
4. Interest rate differentials
Interest rate differentials are calculated by subtracting US rates from national rates. Thus, a positive sign indi-cates that national rates are higher than US rates, imply-ing that the relevant country is potentially in a position to attract capital from the US. The reverse is true if the sign is negative.
Three indicators of interest rate differentials have been chosen: that between official discount rates, that between day-to-day money rates, and that between government bond yields. Official discount rates directly reflect a country's monetary policy, day-to-day money rates are an indicator of short-term rates, and government bond yields are an indicator of divergences in long-term rates.
For the definitions of these rates see section III.4.
5. Exchange rates (ECU) and GDP purchasing power standards (PPS)
Data on the following two indices (based on 1985) are presented in this section:
(i) The index of the exchange rate of the ECU with respect to national currencies.
(ii) The index of the purchasing power parity at GDP level of the currencies, expressed in purchasing power standard (PPS). The PPS is used in national accounts for comparisons in volume.
For further details concerning the method of calcu-lation of the purchasing power parities see Compari-son of ESA aggregates in real terms, (Eurostat 1984).
A table showing the differences between exchange rates and purchasing power parities is also provided. The differences are expressed as a percentage of the pur-chasing power parities.
6. Position vis-à-vis the rest of the world
The position vis-à-vis the rest of the world is expressed in terms of absolute amounts outstanding of all assets (and liabilities) of the resident sectors vis-à-vis the non-resident sectors.
These data do not include assets or liabilities of sub-sidiaries owned by resident companies but situated else-where in the world, in so far as the resident company does not establish a consolidated balance sheet on a worldwide scale. For more details about the calculation of these data the reader should consult section III.7.
7. Foreign official reserves (monetary gold excluded)
7.1 Annual percentage variation in reserves
This ratio measures the relative accumulation or de-pletion of countries' international means of payment.
These variations are calculated on a stock of reserves which is first converted into ECU, thus the change in reserves has two components: the ECU-dollar exchange rate (most of international reserves are held in US dollars), and the change in the volume of international means of payment.
7.2 Reserves/average monthly imports
This ratio indicates how many months' imports can be financed with the existing stock of official reserves, excluding monetary gold (i.e. gold held by the monetary authorities: excluded because it is not generally used as a means of international payment).
The ratio is calculated as the result of the volume of reserves outstanding (end-of-year) divided by the average monthly imports of the same year.
Data on imports are taken from foreign trade statistics and consequently include costs of freight and insurance.
7.3 Reserves/world reserves
II. THE EUROPEAN MONETARY SYSTEM (EMS) AND THE ECU
l a;€ ¡
The European Monetary System (EMS) was formally intro-duced on 13 March 1979. Its purpose is ' . . . t o create a zone of monetary stability in Europe through the imple-mentation of certain exchange rate, credit and resource transfer policies'.
In the second chapter of this bulletin, data are provided on the ECU in the context of the EMS (Tables 1 to 6) and also about its use in private transactions (Tables 7 to 9). For a detailed description of the calculation of the daily exchange rate of the ECU, see the note at the end of this chapter.
1. The composition of the ECU basket
When introduced by the Council Regulation of 18 Decem-ber 1978, the value and composition of the ECU was identical to that of the European Unit of Account (EUA), which had been in existence since 1974.
The initial value of the EUA, on which the ECU is based, was defined as being equal to 1 SDR, or to USD 1.20635 on 28 June 1974, the date on which the IMF introduced the SDR currency basket.
The composition of the EUA basket was the arithmetical average of:
(i) the respective proportion of each Community cur-rency in the SDR basket;
(ii) the respective proportion of each of the nine member countries in the total GDP of the European Com-munity in 1972, calculated on the basis of 1972 ex-change rates; and
(iii) the relative part of each country in the intra-Commu-nity trade of 1973, calculated on the basis of 1973 exchange rates.
However, unlike the EUA there is a revision procedure in the EMS treaty for the ECU basket, which stipulates that the composition of the ECU has to be re-examined, and if necessary revised, within six months of the coming into operation of the European Monetary System and there-after every five years, or on request if the weight of any currency has changed by 25% or more.
The first change in the composition of the basket took place in September 1984 and was mainly designed to integrate the drachma into the basket. At the same time the original weights of the EC currencies in the basket were restored.
The currency components of the German mark, the Dutch guilder and the pound sterling were therefore reduced and those for all other currencies increased.
2. EMS: Bilateral central rates and intervention points
All EC currencies except the pound sterling, the drachma, the escudo and the peseta, have an ECU-related central rate expressed as a certain quantity of each currency per ECU. From these ECU-related central rates the grid of the bilateral central rates and intervention points of the cur-rencies participating in the exchange rate mechanism is calculated. This grid changes at every devaluation or revaluation of a currency belonging to the exchange rate mechanism.
3. Central rates
Table 3 presents ECU central rates at the date of the EMS currency realignments. The pound sterling and the drach-ma do not participate in the exchange rate mechanism, and thus their central rates are only theoretical, needed for the functioning of the divergence indicator.
4. Realignments of EMS currencies
Realignments are represented by the rate of revaluation or devaluation in percentage terms with respect to the central rate valid before the realignment. Since all curren-cies in the ECU basket are interconnected, it is clear that if the central rate is altered for one currency, all other central rates have to be modified.
In Table 4 however, only the realignments of those curren-cies which were at the origin of a general realignment are shown.
5. Weights of the EMS currencies in the ECU basket
The weight of a currency in the ECU depends on the amount of this currency in the ECU basket and on its exchange rate vis-à-vis other currencies. Any variation of the market rate translates into a change in the relative weights of every currency in the basket.
The data in Table 5 of this section give the weights of the EMS currencies at the dates of the different realign-ments.
6. The divergence indicator
or downwards from the Community average as repre-sented by the ECU.
For a given currency the DI is obtained:
(i) first by calculating the appreciation or depreciation of the market rate of the ECU in terms of that currency against its ECU-related central rate; and
(ii) then by comparing the result obtained with the maxi-mum divergence spread (MDS), which is the inter-vention limit of ± 2.25%, corrected by the weight of each currency in the basket in such a way that an increase in the weight of a currency reduces its maximum divergence spread.
In order to permit a comparison of movements in the divergence indicators for each of the EMS currencies, the MDS is expressed as an index number ranging between ± 100. At an absolute index number of 75, a currency reaches its divergence threshold.
7. Consumer prices expressed in ECU
For each country the index of consumer prices in ECU is calculated by dividing the national consumer price index by the index of exchange rates (the inverse of the series III.6.3.1). It measures the change of the purchasing power of one ECU in the country concerned.
Three composite indicators are calculated, the first cover-ing all the Member States of the Community (EUR 12), the second relating to the eight Member States participating in the exchange rate mechanism (Belgium, Denmark, FR of Germany, France, Ireland, Italy, Luxembourg and the Netherlands) and the third covering the 10 member countries (EMS countries plus Greece and the United Kingdom) whose currencies go to make up the ECU. These indices are calculated as weighted arithmetic means (chain indices) of the consumer price indices expressed in ECU as mentioned above.
The weights are defined as follows:
(i) For the EUR and EMS indices, the relative share of each Member State in the final consumption of house-holds for the group of countries in question (EUR 12 or EMS), expressed in ECU at current prices and current exchange rates (annual weighting).
(ii) For the ECU index, the relative share of each Member State's currency in the ECU basket (monthly weight-ing).
8. ECU bond issues
All ECU denominated bond issues both national and international are covered, together with ECU issues offer-ing the possibility of the conversion into other currencies. The issues are recorded as at the payment date.
The heading 'European Community institutions' covers the European Investment Bank and the Commission of the European Communities (EEC, ECSC, Euratom).
The column 'Non-European Community organizations' refers to the specialized institutions of the United Nations, the World Bank, the Council of Europe, etc.
9. Interest rates and yields on ECU investments
The interest rates for one, three and six months and one year deposits are calculated on the basis of the Friday London market rates (source: Financial Times).
The bonds are classified for three maturities: under 5 years, from 5 to 7 years and more than 7 years.
The redemption yields of ECU bonds are calculated each Wednesday from a sample of fixed interest bonds, denominated in ECU and listed on the Luxembourg stock exchange (source: Luxembourg stock exchange).
The monthly and yearly averages are the unweighted arithmetic averages of these weekly rates and yields.
The method of calculation of the ECU
ffrl
I.,
CURRENT STATISTICS
1. Integrated balance sheet of credit institutions
The layout for the integrated balance sheet of credit institutions was drawn up in cooperation with the Work-ing Party on BankWork-ing and Monetary Statistics, which is composed of experts from the central banks and the statistical offices of the Member States of the European Communities.
The sector credit institutions comprises of three subsec-tors: central banking authorities, other monetary institu-tions and other credit instituinstitu-tions.
The integrated balance sheet shows the situation at the end of the accounting period for assets and liabilities of the credit institutions vis-à-vis the resident sectors and the rest of the world.
Due to statistical difficulties, intrasectoral assets and liabilities are not equal. Statistical adjustments are included under the heading 'sundry items' on the assets side.
The published data are only a small part of available data. More detailed information on the three subsectors of credit institutions and on their assets and liabilities is stored in the BIF1 data base in Eurostat's data bank 'Cronos'. It is available on request.
2. Money supply
These series cover the three most commonly used con-cepts of the money supply: the narrow concept M1 and the broader definitions of M2 and M3.
The series expressed in ECU are converted using the end of period ECU exchange rate. All growth rates are calcu-lated directly from data expressed in national currency. Growth rates over the preceding periods (monthly and quarterly) are calculated from seasonally adjusted time series, according to the 'Dainties' method of the Cronos data base. The consumer price index has been used as deflator for the calculation of the annual growth rates at constant prices.
Definitions:
M1: Almost invariably, for all countries covered here, this concept consists of currency (notes and coin) in circulation outside banks plus sight deposits held by the private sector with the banking system.
M2: This concept of the money supply, in addition to the elements included in the M1 definition - currency plus sight deposits - also includes certain less
liquid financial instruments, mainly savings deposits and other short-term claims on monetary institutions.
M3: This is the broadest definition of the money supply, comprising the readily spendable financial instru-ments (M1), the nearly-liquid ones (M2) plus certain placements in a potentially liquid form such as depo-sits at statutory notice, placements with contractual maturity over one year, etc.
Notes by country:
Belgium:
M2: M1 plus short-term (less than one year) claims of residents on financial intermediaries, denominated in Belgian francs or foreign currencies.
M3: M2 plus claims of residents on financial intermediar-ies of more than one year of original contractual maturity.
Denmark:
M2: M1 plus time deposits held by domestic non-bank sectors (excluding central government) with commer-cial banks and major savings banks, plus the non-bank sector's holdings of treasury bills.
M3: Not available.
FR of Germany:
M2: M1 plus domestic non-bank time deposits and funds borrowed for less than four years.
M3: M2 plus domestic non-banks' savings deposits at statutory notice held at domestic banks.
Greece:
M2: M1 plus private time and savings deposits.
M3: Not available.
Spain:
M2: M1 plus savings deposits with private banks, savings banks and cooperatives.
M3: M2 plus time deposits, certificates of deposits and bills with private banks, savings banks and coopera-tives.
France:
M3: M2 plus deposits in foreign currency, non-marketable deposits with banks and the Treasury and money market securities (certificates of deposit, bills issued by financial institutions and bills issued by the 'Caisse nationale des télécommunications').
Ireland:
M2: Not available.
M3: M1 plus deposit accounts (Irish pounds and foreign currency) of resident private sector entities at within-the-State offices of licenced banks.
Japan:
M2: M1 plus quasi money (total of private deposits, public deposits, and instalments of Sogo Banks minus demand deposits with financial institutions sur-veyed).
M3: M2 plus deposits of post offices and agricultural cooperatives, fishery cooperatives, credit coopera-tives, labour credit associations, and money and loan trusts of all banks.
Italy:
M2: M1 plus savings deposits and banks' securities repurchase agreements with customers.
M3: M2 plus bankers' acceptances and Treasury bills.
Luxembourg:
M2: M1 plus deposits and bills up to two years and savings deposits up to one year maturity.
M3: Not available.
The Netherlands:
M2: M1 plus short-term claims of the non-monetary domestic sector on monetary institutions and gov-ernment.
M3: Not available.
Portugal:
M2: M1 plus time and savings deposits and emigrants' deposits.
M3: Not available.
United Kingdom:
M2: M1 plus sterling retail deposits held by UK private sector with UK banks, with building societies and the National Savings Bank ordinary account.
M3: M2 plus all sterling deposits (including certificates of deposit) held with UK banks by the private sector.
United States of America:
M2: M1 plus overnight repurchase agreements issued by all commercial banks and overnight Eurodollars issued to US residents by foreign branches of US banks worldwide, money market deposit accounts (MMDA), savings and small denomination time depo-sits, and balances in both taxable and tax-exempt general purpose and broker/dealer money market mutual funds.
M3: M2 plus large-denomination time deposits and term repurchase agreement (RP) liabilities issued by com-mercial banks and thrift institutions, term Eurodol-lars held by US residents at foreign branches of US banks worldwide and at all banking offices in the United Kingdom and Canada, and balances in both taxable and tax-exempt, institution-only money mar-ket mutual funds.
3. Public finance
3.1 Central government budget
The data on revenue, expenditure and the surplus (or deficit) relate to the budget of central government as defined in the European system of integrated economic accounts.
Notes by country:
Belgium: Revenue and expenditure relate to current trans-actions, excluding revenue transferred to the European Communities, capital transactions and expenditure on contractual redemption (i.e. redemption based on the drawing of lots, of repurchase in the stock market in the course of the contractual life of the loans) and of debt chargeable to the Treasury.
Source: Banque Nationale de Belgique.
Denmark: Central government current revenue plus
capi-tal revenue, minus current outlays and capicapi-tal outlays.
Source: Danmarks Statistik.
FR of Germany: Receipts and expenditure of the Bund
and Länder.
Source: Deutsche Bundesbank
Spain: General government current and capital income
minus current and capital outlays.
Source: Banco de Espana.
Greece: Revenue on ordinary and investment budget
minus expenditure on ordinary and investment budget.
Source: Bank of Greece.
France: The budgetary balance is the difference between the definite revenue and expenditure and the balance of temporary transactions. The latter includes certain lend-ing operations (e.g. houslend-ing loans for the construction of low cost housing — HLM: habitation aux loyers modérés) and, as the largest item, the advances received by the Treasury.
Source: Insee.
Ireland: Revenue (taxes and dues, customs duties and
postal revenue) less current expenditure and capital expenditure.
Italy: Variations in Treasury cash balances. Revenue = taxes and dues, revenue from monopolies and public services. Expenditure = current expenditure.
Source: I stat.
Luxembourg: Receipts (ordinary and extraordinary) and
expenditure of general government.
Source: Ministry of Finance.
The Netherlands: Surplus or deficit of central
govern-ment. Revenue: Taxes on income and capital and taxes on production.
Source: CBS.
Portugal: Collected revenue minus current expenditure
and capital expenditure.
Source: Ministry of Finance.
United Kingdom: Revenue (including the 'National
insu-rance surcharge', broadcast receiving licences, interest payments and dividends). Expenditure covers all expendi-ture (including Northern Ireland and transfers to the European Communities).
Source: CSO.
United States: Data relate to consolidated central govern-ment, which means that intragovernmental transactions are eliminated.
Source: IMF.
France: Government debt excluding coins both in 'stock' and in 'circulation', amounting to about FF 10 Mrd in 1982.
Source: Insee.
Ireland: External debt in foreign exchange converted into IRL using the market rate of 31 December of each year.
Source: Central Bank of Ireland.
Italy: Long-term debt and floating debt (Treasury bills, advances of the Banca d'Italia and other credit insti-tutions).
Source: I stat.
Luxembourg: Consolidated debt and floating debt.
Source: Ministry of Finance.
The Netherlands: Consolidated and short-term debt of the central government.
Source: CBS.
Portugal: Direct domestic and foreign debt.
Source: Ministry of Finance.
United Kingdom: 'National debt'. Nominal amounts on 31
March (including floating debt in the form of Treasury bills).
Source: CSO.
3.2 Central government debt
These series refer exclusively to central government debt and do not cover the public sector in a broad sense.
Notes by country:
Belgium: Consolidated debt, direct and indirect (i.e.
including the debts of the Fonds des routes, the
Inter-communales autoroutières and the Office de la
naviga-tion), short-term and long-term debt.
Source: Ministry of Finance.
Denmark: Global domestic debt: Bonds in circulation,
debt vis-à-vis the central banking authorities and the postal services.
Source: Danmarks Nationalbank.
FR of Germany: Consolidated debt of the Bund and the
Länder. Assets and liabilities between these two sectors are excluded.
Source: Deutsche Bundesbank.
Greece: Only the foreign debt of central government. See also country notes in chapter III.7. Position vis-à-vis the rest of the world.
4. interest rates and share yields
4.1. Short-term interest rates
4.1.1. Official discount rate
Rate at which the central bank discounts, in general within the limits of rediscount quotas, eligible com-mercial bills presented for discounting.
4.1.2. Day-to-day money rate
Belgium: Rate of money market between financial
insti-tutions authorized to participate in this market.
Denmark: Simple average of daily offer rates for interbank deposits.
FR of Germany: Interbank rate.
Greece: Monthly average of interbank money market rate.
Spain: Average of daily interbank rate.
France: Rate for day-to-day loans against commercial
bills.
Ireland: Interbank rate.
Italy: Monthly average of the maximum interest rate
The Netherlands: Representative rate on the money market for loans between banks.
Portugal: Interbank money market - average interest
rate (24 hours to 5 days).
United Kingdom: Rate at which the London Clearing
Banks borrow or lend funds on the money market on an overnight basis.
United States: Effective rate on day-to-day Federal
Reserve Funds.
Japan: The average rate for typical borrowers of uncondi-tional loans registered every working day of the month.
4.1.3. Treasury bill rate (three-month)
Belgium: Rate on three-month Treasury certificates.
FR of Germany: Nominal rates of bills of the Bund and
the Federal Railways with maturity between 60 and 90 days.
Greece: Treasury bill rate - end of month.
Spain: Weighted average three-month Treasury bills
traded on the secondary market.
France: Negotiable 13-week Treasury bills.
Ireland: Exchequer bills. Average rate of discount of the last auction of the month.
Italy: Ordinary Treasury bills.
The Netherlands: Weighted rate of Treasury bills on the secondary market with remaining maturity of three months.
Portugal: Treasury bills - average interest rate in the primary market.
United Kingdom: Rate on three-month Treasury bills.
United States: Yield on three-month Treasury bills.
Japan: Yield at issue on 60-day securities issued by the government. The rate is fixed by the Ministry of Finance and rarely changed officially.
4.2. Long-term rates
4.2.1. and 4.2.2. Yield on long-term government bonds at current and at constant prices
In principle, all yields are calculated for bonds on the secondary market. For the series on long-term govern-ment bond yields at current prices the consumer price index has been used as deflator.
Notes by country:
Belgium: Fully taxed, fixed-interest public bonds with
original contractual maturity of over foui years.
Denmark: Yield on fixed-interest redeemable government
bonds.
FR of Germany: Yields on fully-taxed, fixed-interest public bonds, with original contractual maturity of over four years.
Greece: Yield on public sector bonds.
Spain: Bond yield on the secondary market for
govern-ment bonds of more than two years.
France: Fixed-interest-rate bonds on the secondary mar-ket (excluding lottery bonds) issued by the public and semi-public sectors.
Ireland: Yield on fixed-interest redeemable bonds of
15 years to maturity.
Italy: The average yield to redemption on fixed-interest redeemable (perpetual bonds are excluded) government bonds.
Luxembourg: Weighted average of four monthly bond
yields.
The Netherlands: Weighted average yield of the three
latest government issues with remaining maturity of at least 10 years. Monthly yields are based on average Friday prices. The statistics refer to fixed-interest-rate bonds.
Portugal: Average yield on long-term bonds.
United Kingdom: Yield on fixed-interest redeemable
government bonds with 20 years to maturity.
United States: Averages (to maturity or call) for all out-standing bonds neither due nor callable in less than 10 years, including one very low yielding 'flower' bond.
Japan: Unweighted arithmetical average of the rates of
yield to final maturity of central government bonds. The sample covers short-term and medium-term maturity.
4.2.3. Yield on shares
The yields are given in percentages per year and defined as the annual dividends paid over the current market price of the share.
Notes by country:
Belgium: Average yield on a representative sample of
Belgian company shares.
FR of Germany: Aggregate of dividends (including stock
dividends) divided by the aggregate market value (end of period) of all quoted shares.
Spain: Ordinary share yield of electric utilities.
France: Weighted average yield calculated for 295 securi-ties, based on stock prices of the last Friday of the month.
The Netherlands: Weighted average effective gross yield at the end of period calculated for the Dutch multination-al and domestic shares quoted on the Amsterdam stock exchange.
United Kingdom: Yield of the 500 shares constituting the Financial Times Share Index.
United States: Yield on 500 common stocks selected by
Standard and Poor. The yield is the monthly average of yield obtained each week by dividing the aggregate cash dividends by the total market value of each Wednesday.
Japan: The arithmetic average of the individual rates of yield on all shares quoted on the First Section on the Tokyo stock exchange.
5. Index of share prices
Three indices are published under this heading (all using 1985 = 100). The annual and quarterly averages are the arithmetic averages of the monthly averages.
5.1. Index of share prices
This is the traditional index of share prices derived from the national indices and calculated on the base 1985 = 100.
5.2. Index of share prices (at constant prices)
An index of share prices at constant prices is derived from the traditional national indices deflated by the con-sumer price index. (For Ireland, where only a quarterly consumer price index exists, the monthly figures are estimates, derived by linear interpolation from the quart-erly data).
This index highlights the evolution, in terms of domestic purchasing power, of the value of a portfolio formed in 1985.
5.3. Index of share prices (in ECU)
This index is calculated at current exchange rates. The portfolio of securities represented by the traditional index with the base of 1985 = 100 is converted into ECU by dividing by the ECU-exchange rate (the inverse of series III.6.3.1. contained in the chapter 'Current statistics').
This index shows the evolution in terms of international purchasing power with respect to the ECU of a portfolio of securities formed in 1985.
Notes by country:
Belgium: Weighted index of actively traded shares of
companies registered in Belgium. The index refers to the 'marche au comptant' (cash market).
Denmark: Index of shares quoted on the 'main list of
companies' on the Copenhagen stock exchange. The index is derived from the subgroups Banking, Shipping, Industry, Commerce, Insurance and Transport-Other.
FR of Germany: The index is based on a sample that
covers approximately 90% of common stock of com-panies having their headquarters in the FR of Germany.
Greece: General share price index on the Athens stock
exchange.
Spain: General index of share prices quoted on the
Madrid stock exchange. The composition of the index is revised annually.
France: Index of the Paris stock exchange. The selection of companies included in the index is based on the importance in the market and a reasonable spread of economic activity.
Ireland: The index is the average of daily spot quotations of companies, having a market capitalization of at least IRL 500 000. The index covers over 98% of the market value.
Italy: The index is an average of daily spot quotations of common shares of 40 major companies on the Milan stock exchange. Selection of companies has been based on the relative importance in the market and reasonable spread of economic activity.
Luxembourg: The index measures the changes in the
price of nine companies selected from a total of 24, listed in the section 'actions et parts - Luxembourg' in the
'cote officielle' of the Luxembourg stock exchange.
A single general index is calculated from these nine individual shares.
The Netherlands: The index - general share price index
- covers 55 shares from six groups of companies quoted on the Amsterdam stock exchange and which are con-sidered to be representative of prices in the market of their respective group.
Portugal: Lisbon stock exchange - data are monthly
average quotations weighted by the volume of trans-actions in the last 12 months.
United Kingdom: The data refer to the average of daily
quotations of 500 industrial ordinary shares on the Lon-don stock exchange. The figures are taken from the 'FT-Actuaries' share indices published daily in the Finan-cial Times.
United States: Standard and Poor's corporation index
(1941-43 = 100). Effective July 1976, it includes a new financial group, banks and insurance companies. With this change the index includes 400 industrial stocks (formerly 425), and 20 transportation (formerly 15 rail), 40 public utilities (formerly 60), and 40 financial.
Japan: Source: OECD Monthly financial statistics
6. Exchange rates
For the calculation of the ECU exchange rate see the note at the end of chapter II 'European Monetary System and the ECU'. Monthly, quarterly and annual averages are weighted by the number of working days in the relevant period. Index figures are based on the average rate of 1985.
the effect on the trade balance of the country in question of a change of 1 % in the domestic currency price of one of the other currencies. The weights therefore take account of the size of trade flows as well as of relevant price elasticities and the feedback effects of exchange rate changes on domestic costs and prices'.
Data for Greece and Portugal are not provided by the IMF and thus are not given here.
7. Position vis-à-vis the rest of the world
The total amount of external assets and liabilities vis-à-vis non-residents is broken down, on the basis of the available data, within three institutional sectors or broad categories:
(i) General government: Central government, local gov-ernment, local government and social security funds.
(ii) Credit institutions: Central banking authorities, other monetary institutions and other credit institutions.
(iii) Private non-banking sectors: non-financial corporate and quasi-corporate enterprises, insurance enter-prises, private non-profit institutions serving house-holds, and households.
The assets include gold valued at the London market rate at the end of the period. Since only information on monetary gold is known, assets net of gold can be obtained by subtracting from the data in this section the gold reserves in section 8, 'Foreign official reserves'.
Notes by country:
Belgium: Data include foreign direct investment.
Denmark: Direct investments are included.
FR of Germany: Including direct investment and transfer-able securities.
Greece: The sector 'general government' covers only
assets and liabilities of the central government. Direct investment is not included. In addition, published amounts do not include either the loans taken up by Greek shipowners abroad nor the foreign currency depo-sits of Greek nationals living abroad (including ship-owners) with financial institutions in Greece.
France: Direct investment is not included. The non-finan-cial private sector covers only trade credits granted by residents and refinanced by the Banque Française du Commerce Extérieur and outstanding external long-term borrowing.
Ireland: Direct investment is not included. The sector
'general government' only covers external liabilities of central government. The external position of the non-financial private sector comprises estimates (source: OECD) for semi-public corporations, plus those for State-sponsored bodies.
Italy: Data include direct investment and participations.
Luxembourg: The existing statistical sources do not per-mit the identification of the external position of the non-financial private sector.
The Netherlands: The institutional sector 'general ment' only covers the external liabilities of central govern-ment. Since 1976, central government has had no external liabilities. Also, the statistics currently published do not permit the identification of the external position of the non-financial private sector.
United Kingdom: Assets and liabilities in the form of
direct investment and securities are included. The amounts for the non-financial private sector are esti-mated by subtracting from the total external assets and liabilities of the United Kingdom the external assets and liabilities of credit institutions and general government.
8. Foreign official reserves
The data in this section refer to 'gross official reserves' which are defined as those assets and claims on non-residents which are under the control of the monetary authorities and are available for use to finance balance of payments imbalances.
8.1. Total reserves (monetary gold included)
This is the sum of the series 8.2.1. up to 8.3.1, for which definitions are provided below.
8.2. Total reserves (monetary gold excluded)
This comprises the same categories of reserve assets as above (8.1), except monetary gold.
8.2.1. Foreign exchange
This covers claims on non-residents held by the monetary authorities. Apart from claims in the form of bank depo-sits, Treasury bills, etc. other claims usable in the event of a balance-of-payments imbalance are also included here, such as arrangements between central banks and other non-marketable claims.
Of which: reserves in ECU: These holdings of reserves in ECU represent the counterpart of the national dollar and gold reserves transferred to the European Monetary Cooperation Fund (EMCF).
8.2.2. Special drawing rights
Holding of special drawing rights represent unconditional reserve assets that were created by the IMF. SDRs are allocated to IMF members in proportion to their quotas. Changes in monetary authorities' holdings of SDRs come about either through allocation and cancellation or through transactions in which SDRs are paid or received from the Fund or other holders.
8.2.3. Reserve position in the IMF
The reserve position in the fund of an IMF member country is the sum of the reserve tranche purchases that a member could make and the amount of any indebted-ness of the Fund under a loan agreement that is readily repayable to that member.
8.3. Monetary gold
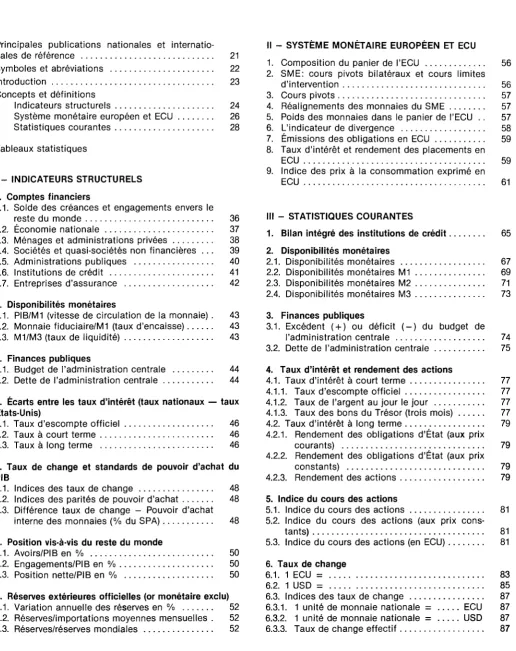
TABLE DES MATIERES
Principales publications nationales et
internatio-nales de référence 21 Symboles et abréviations 22
Introduction 23 Concepts et définitions
Indicateurs structurels 24 Système monétaire européen et ECU 26
[image:21.595.20.537.127.779.2]Statistiques courantes 28
Tableaux statistiques
I - INDICATEURS STRUCTURELS
1. Comptes financiers
1.1. Solde des créances et engagements envers le
reste du monde 36 1.2. Économie nationale 37 1.3. Ménages et administrations privées 38
1.4. Sociétés et quasi-sociétés non financières . . . 39
1.5. Administrations publiques 40 1.6. Institutions de crédit 41 1.7. Entreprises d'assurance 42
2. Disponibilités monétaires
2.1. PIB/M1 (vitesse de circulation de la monnaie) . 43 2.2. Monnaie fiduciaire/M1 (taux d'encaisse) 43
2.3. M1/M3 (taux de liquidité) 43
3. Finances publiques
3.1. Budget de l'administration centrale 44 3.2. Dette de l'administration centrale 44
4. Écarts entre les taux d'intérêt (taux nationaux — taux États-Unis)
4.1. Taux d'escompte officiel 46 4.2. Taux à court terme 46 4.3. Taux à long terme 46
5. Taux de change et standards de pouvoir d'achat du PIB
5.1. Indices des taux de change 48 5.2. Indices des parités de pouvoir d'achat 48
5.3. Différence taux de change - Pouvoir d'achat
interne des monnaies (% du SPA) 48
6. Position vis-à-vis du reste du monde
6.1. Avoirs/PIB en % 50 6.2. Engagements/PIB en % 50 6.3. Position nette/PIB en % 50
7. Réserves extérieures officielles (or monétaire exclu)
7.1. Variation annuelle des réserves en % 52 7.2. Réserves/importations moyennes mensuelles . 52
7.3. Réserves/réserves mondiales 52
Il - SYSTEME MONETAIRE EUROPEEN ET ECU
1. Composition du panier de l'ECU 56 2. SME: cours pivots bilatéraux et cours limites
d'intervention 56 3. Cours pivots 57 4. Réalignements des monnaies du SME 57
5. Poids des monnaies dans le panier de l'ECU .. 57
6. L'indicateur de divergence 58 7. Émissions des obligations en ECU 59
8. Taux d'intérêt et rendement des placements en
ECU 59 9. Indice des prix à la consommation exprimé en
ECU 61
III - STATISTIQUES COURANTES
1. Bilan intégré des institutions de crédit 65
2. Disponibilités monétaires
2.1. Disponibilités monétaires 67 2.2. Disponibilités monétaires M1 69 2.3. Disponibilités monétaires M2 71 2.4. Disponibilités monétaires M3 73
3. Finances publiques
3.1. Excédent ( + ) ou déficit ( - ) du budget de
l'administration centrale 74 3.2. Dette de l'administration centrale 75
4. Taux d'intérêt et rendement des actions
4.1. Taux d'intérêt à court terme 77 4.1.1. Taux d'escompte officiel 77 4.1.2. Taux de l'argent au jour le jour 77 4.1.3. Taux des bons du Trésor (trois mois) 77
4.2. Taux d'intérêt à long terme 79 4.2.1. Rendement des obligations d'État (aux prix
courants) 79 4.2.2. Rendement des obligations d'État (aux prix
constants) 79 4.2.3. Rendement des actions 79
5. Indice du cours des actions
5.1. Indice du cours des actions 81 5.2. Indice du cours des actions (aux prix
cons-tants) 81 5.3. Indice du cours des actions (en ECU) 81
6. Taux de change
6.1. 1 ECU = 83 6.2. 1 USD = 85 6.3. Indices des taux de change 87
6.3.1. 1 unité de monnaie nationale = ECU 87 6.3.2. 1 unité de monnaie nationale = USD 87
7. Position vis-à-vis du reste du monde
7.1. Avoirs et engagements de l'économie
natio-nale 88 7.1.1. Avoirs 88 7.1.2. Engagements 88 7.1.3. Position nette 88 7.2. Avoirs et engagements des administrations
publiques 89 7.1.1. Avoirs 89 7.1.2. Engagements 89 7.1.3. Position nette 89 7.3. Avoirs et engagements des institutions de
cré-dit 90 7.1.1. Avoirs 90 7.1.2. Engagements 90 7.1.3. Position nette 90 7.4. Avoirs et engagements des secteurs privés
non bancaires 91
7.1.1. Avoirs 91 7.1.2. Engagements 91 7.1.3. Position nette 91
8. Réserves extérieures officielles
8.1. Réserves extérieures officielles (y compris l'or
monétaire) 93 8.2. Réserves extérieures officielles (non compris
l'or monétaire) 93 8.2.1. Devises 93
Dont: ECU 93 8.2.2. Droits de tirage spéciaux 95
8.2.3. Position au FMI 95 8.3. Or monétaire 97 8.3.1. Évalué aux prix de marché 97
PRINCIPALES PUBLICATIONS NATIONALES ET INTERNATIONALES
Belgique/België:
Danmark:
BR Deutschland:
Ellas:
Espana:
France:
Ireland:
Italia:
Luxembourg:
Nederland:
Portugal:
United Kingdom:
United States of America:
Nippon:
Organisations internationales
Bulletin/Tijdschrift
Statistiske efterretninger Monetary review
Monatsberichte Beihefte
Monthly Statistical bulletin
Boletin estadístico
Bulletin trimestriel Statistiques mensuelles Statistiques trimestrielles Bulletin mensuel
Quarterly bulletin Supplements
Bollettino economico Supplementi al bollettino Bollettino mensile di statistica
Bulletin trimestriel
Kwartaalbericht
Maandstatistiek van het financiewezen
Boletim trimestral
Financial statistics Quarterly bulletin
Survey of current business Federal reserve bulletin
Economic statistics (monthly)
Statistiques financières internationales IFS
Statistiques financières mensuelles
Banque nationale de Belgique/Nationale Bank van België
Danmarks Statistik Danmarks Nationalbank
Deutsche Bundesbank
Bank of Greece
Banco de Espana
Banque de France
Institut national de statistique et des études économiques (INSEE)
Central Bank of Ireland
Banca d'Italia
Istituto centrale di statistica (Istat)
Institut monétaire luxembourgeois
Nederlandsche Bank
Centraal Bureau voor de Statistiek (CBS)
Banco de Portugal
Central Bureau of Statistics (CSO) Bank of England
United States Department of Commerce Board of Governors of the Federal Reserve System
Bank of Japan
SYMBOLES ET ABREVIATIONS
Eurostat Mio Mrd Écu
Office statistique des Communautés européennes Million
Milliard
Unité monétaire européenne Estimation de l'Eurostat Néant
Donnée non disponible Donnée non existante
EUR 12 Total des 12 États membres des Communautés européennes (Belgique, Danemark,
RF d'Allemagne, Grèce, Espagne, France, Irlande, Italie, Luxembourg, Pays-Bas, Portugal et Royaume-Uni)
PIB Produit intérieur brut au prix du marché
Monnaies
BFR/LFR DKR DM DR ESC FF HFL IRL LIT PTA UKL USD SFR SKR NKR CAD ÖS
FMK YEN AUSD NZLD DTS
Franc belge/franc luxembourgeois Couronne danoise
Mark allemand Drachme grecque Escudo portugais Franc français Florin néerlandais Livre irlandaise Lire italienne Peseta espagnole Livre sterling
Dollar des États-Unis Franc suisse
INTRODUCTION
1. La présente publication donne un aperçu des différen-tes statistiques financières gérées par Eurostat et portant sur la Communauté européenne, les États-Unis d'Amérique et le Japon.
Ce volume comporte essentiellement trois parties:
- la première partie présente un ensemble d'indica-teurs structurels qui reflètent les tendances fonda-mentales de l'évolution des variables financières ou des relations entre les variables financières et d'au-tres indicateurs économiques. Les indicateurs structurels ne sont présentés que sur une base annuelle;
- la seconde partie porte principalement sur les infor-mations courantes relatives au fonctionnement du système monétaire européen, ainsi que sur l'utilisa-tion privée de l'Écu comme instrument d'investisse-ment;
- la troisième partie regroupe la plupart des indica-teurs financiers courants qui sont utilisés dans l'analyse économique courante.
La présente publication ne contient qu'une partie des informations dont dispose Eurostat: en effet, les domaines de statistiques financières de la banque de données Cronos (FINA et BIF1) contiennent quelque 25 000 séries chronologiques primaires et dérivées.
3.
Toutes ces données peuvent être fournies sur demande ou consultées via Euronet.
En outre:
- les comptes financiers par secteur, sans les sous-secteurs de l'administration publique, sont publiés annuellement sous le titre Comptes nationaux SEC
- Tableaux détaillés par secteur. Les comptes
financiers des sous-secteurs de l'administration publique sont publiés annuellement dans Comptes et statistiques des administrations publiques;
- des données journalières et mensuelles sur la seconde partie (le système monétaire européen) sont publiées chaque mois dans ECU-SME Informa-tions;
- des informations sur les indicateurs financiers cou-rants paraissent dans les publications suivantes:
Eurostatistiques - Données pour l'analyse de la
conjoncture (mensuel)
Revue - Données annuelles sur dix ans Statistiques de base - Données annuelles.
I - INDICATEURS STRUCTURELS
1
1. Comptes financiers
Le compte financier du système européen de comptes économiques intégrés (SEC) enregistre les variations de différents types de créances et d'engagement pour les secteurs résidents de l'économie nationale et pour le reste du monde.
Le compte de l'économie nationale, qui est le premier compte apparaissant dans cette publication, présente la somme des variations des avoirs et des engagements financiers des secteurs résidents vis-à-vis du reste du monde. Le ratio de cette variation nette et du PIB repré-sente le rapport entre la situation financière de l'écono-mie nationale, d'une part, et la production de biens et de services, d'autre part.
La nomenclature des secteurs et des transactions est très proche de celle du SEC mais, dans certains cas, des transactions ont été agrégées.
Ces agrégations concernant le poste «numéraire et dépôts», défini comme la somme des «dépôts à vue transférables» (F20) et des «autres dépôts» (F30), ainsi que celui des «titres» défini comme la somme des «titres à court terme» (F40), des «obligations» (F50) et des «actions et autres participations» (F60). Dans le secteur des compagnies d'assurances, les «titres à court terme» (F40) et les «obligations» (F50) sont regroupés sous la rubrique «titres à court terme et obligations».
Pour obtenir de plus amples informations méthodolo-giques sur le contenu des secteurs et des opérations, il convient de se référer au Système européen de comptes économiques intégrés — SEC, deuxième édition, 1979.
2.2. Monnaie fiduciaire/M1 (taux d'encaisse)
Ce taux reflète la part relative de la masse monétaire (M1) que représentent la monnaie métallique et les billets de banque. (Pour la définition de M1, voir au point III.2 ci-après).
Le taux d'encaisse montre dans quelle mesure les billets de banque et la monnaie métallique sont utilisés dans les opérations par rapport aux paiements par chèque. L'évo-lution chronologique du ratio rend compte de la manière dont les modalités des transactions varient dans chaque pays.
2.3. M1/M3 (taux de liquidité)
Ce taux reflète le rapport entre la partie aisément disponi-ble des liquidités d'une économie, d'une part, et la masse monétaire totale, d'autre part.
La partie de la masse monétaire totale qui peut être facilement utilisée comme moyen de paiement consiste dans les billets de banque, la monnaie métallique et les dépôts à vue transférables (M1).
M3 est le concept le plus large de la masse monétaire; il comprend M1, ainsi que les placements qui sont effec-tués sous une forme quasi liquide, dans la mesure où ils peuvent facilement être convertis en moyens de paiement sans aucun risque de perte de capital pour le détenteur (c'est le cas de certains types de dépôts d'épargne, de dépôts à terme, etc.).
2. Disponibilités monétaires
2.1. PIB/M1 (vitesse de circulation de la monnaie)
On calcule la vitesse de circulation de la monnaie en rapportant le produit intérieur brut (PIB) à la moyenne annuelle de l'encours de la masse monétaire M1. Le ratio ainsi obtenu représente le nombre théorique de rotations annuelles de la masse monétaire pour le financement du flux annuel de produit.
Le concept M1 de la masse monétaire (monnaie fiduciaire en circulation et dépôts à vue transférables) offrant une très bonne comparabilité au niveau international, il a été choisi comme dénominateur du rapport, alors que cer-tains pays se réfèrent parfois aux concepts plus larges M2 ou M3 des disponibilités monétaires (voir III.2).
3. Finances publiques
3.1. Excédent ( + ) ou déficit ( - ) du budget de l'adminis-tration centrale, en pourcentage du PIB
L'administration centrale comprend, en principe, les organes administratifs de l'État et d'autres organismes centraux dont les compétences s'étendent sur la totalité du territoire économique, à l'exception des organismes de sécurité sociale.